INTRODUCING THE INVISIBLE HANDS OF STRUCTURAL VIOLENCE
Representations, visualizations, and stories are powerful, especially when used in conjunction with each other
Visualizations of all types hold a particular significance in our society. Despite this, visualizing data to show patterns it contains is often not enough to evoke significant action. There are countless datasets assembled by the United States government, universities, and non-profit organizations that prove, numerically, systematic inequality in our society. The American Civil Liberties Union recently published a study detailing racial targeting in marijuana arrests despite legislature reform, and the American Academy of Sciences released a report on the risk of police brutality by an individual’s age, sex/gender, and race/ethnicity. Their findings detailed that “African American men and women, American Indian/Alaska Native men and women, and Latino men face higher lifetime risk of being killed by police than do their white peers” (Edwards, Lee, and Esposito 2019).
However, despite the problems asserted by numbers, our society has been constructed to ignore them. Individuals who experience the daily manifestations of structural violence, who are represented as numbers and statistics in data to prove this violence, continually have their experiences denied by structures of power. The question becomes, how can we make people “see” the power structures that inflict violence on individuals when we reject the data that we view as “hard facts and truths?” One possibility that this project will assert is that the pairing of stories and individual narratives to data can evoke a novel connection between the reader and the subject; statistics and numbers represent real people and actual events, which the conglomeration of large data values often does a poor job of reinforcing. Furthermore, datasets only represent a snapshot of the world: they do not have the power to answer the questions of “why did this occur and who benefitted?” That’s where ethnographic data visualization can be meaningful; it provides contextualization in a world where contextualization can mean the difference between life and death.
What is structural violence? Well, it is meaningfully broad
In his 1969 piece entitled Violence, Peace, and Peace Research, Johan Galtung coined structural violence. Structural violence is now a term predominantly used by medical anthropologists such as Paul Farmer to describe how societal-driven differences become “embodied as individual experience” and consequently impact health (Farmer et al. 2003, 30).
The definition of structural violence goes beyond our societal conceptions of violence and relationships: Galtung argues that violence extends beyond the act of physical, intentional wrongdoing or inflicting pain on another individual. Instead, he sees violence as any act, physical or not, that hinders an individual from achieving their optimal self. With this idea, we can infer that humans can become this “utopian human,” yet the organization of our society and culture with its violent relationships ensure that we are sub-optimal.
This dynamic affects some individuals more than others, which is where the term “structural” applies.
A structure is a framework, and a framework is a complexity of relationships.
Structures can garner power, not necessarily from the individual relationships that compose it, but rather from the aggregate. This aggregate is created by those in power to sustain or gain more power without regard to, or at the cost of, others.
So, anthropology defines structural violence in terms of its complexity
It is violence committed by structures in society. This violence cannot be traced back or blamed on one individual but is rather represented by a complex web of interdependent relationships.
Because the structures of structural violence are so connected, a structure is often an intangible, “unphysical” thing. This is why visualization of structural violence can be complex. However, visualization can elicit a novel form of understanding by rendering an “unphysical” or invisible phenomenon more tangible through comparisons to tangible ideas. This can be accomplished by depicting the process in which an ethnographer understands their subject- it is not the only way to comprehend their subject, but gives insight into how an ethnographer has rendered their surroundings and interactions in their head.
For example, the image below aims to visualize my definition of structural violence; it combines Galtung’s definition with my comprehension methods. In my head, structural violence is the process in which an individual’s full potential is slowly depreciated by relationships sustained in our society. Some specific examples listed in the visualization, such as racism, poverty, toxic environments, and little to no access to health care, are actual problems that Philadelphia residents encounter daily.
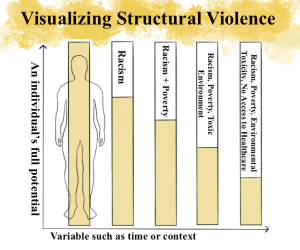
In my mind, I visualize an individual’s full potential not in an “additive” manner (such as a visual of filling a cup) but through processes or factors which hinder an individual; this is why I show factors such as racism and poverty acting to decrease an individual’s “level” (the yellow bar) in the image above. However, it is essential to note that it is inherently challenging to visualize structural violence while not removing or disregarding my interlocutors’ agency. This is why images require constant and continual contextualization: I understand structural violence not as inhibiting individuals from reaching their total capacity but rather a force that pushes an individual’s baseline unfairly backward. Because this baseline is lower than the rest of society, they must input a more considerable amount of energy and effort to achieve the same. Simply put, the system is rigged so that some have a greater chance of achieving more (such as achieving or sustaining good health).
While the previous visualization depicts structural violence’s effects as decreasing the amount of an individual’s “full potential” (as represented by the bars’ fullness), there is no system of logic that can be applied to comprehend and organize the relationships of structural violence. Relationships and power manifest themselves in specific events and patterns, which feed back into maintaining the relationship’s power. This visualization below discusses this idea; in visualization, I am applying a subjective logic of organization to the relationships that compose structural violence and also in identifying the nodes and connections between the relationships shown. Here, my logic mirrors the website’s organization by linking larger structures (generally on the left-hand side) to examples in which they manifest (generally on the right-hand side). While there is no concrete or “accurate” manner to create a map of the relationships of structural violence (as we assume there are limitless relationships and we live in a world with no absolute “truths”), this visualization attempts to provide commentary on how complex and connected structural violence is in Philadelphia.
This page will lay the site framework for how I will visualize and discuss structural violence; please click here for a more in-depth look at how the complexities of data, logic, and relationships can and cannot be visualized.
How Can One Study Invisible, Violent Relationships?
Paul Farmer’s work describes how political and economic systems have wreaked havoc on the health of Haitian populations; it is a gold standard in analyzing the presence of structural violence in society. While he provides ethnographic evidence for how the presence of structural violence in the world affects his constituents’ health, he also outlines the critical aspects of amassing a seemingly “whole” perspective of structural violence through written ethnography.
In describing the methodology and written form of ethnography, Farmer states that:
Our works are long in part because the more we know about something, the less easy it is to dismiss any twist of interpretation, any ostensibly arcane historical detail, as irrelevant (Farmer 2001, 309).
He compares ethnography and the ethnographic facts that constitute it to popular media, as media does not prioritize the same values as anthropology (Farmer 2001, 309). In one sense, Farmer is warning against looking only to the relationships that we can look up on the internet or the patterns that data present, as their meanings are all social constructions. Instead, he promotes ethnographic engagement with BOTH the past and present to determine “which construction materials [of structural violence] were used, and when, and why and how” (Farmer 2001, 309).
Adding in Ethnographic Data Visualization
While Farmer promotes an analysis that includes historical events and their contributions to the present, his text An Anthropology of Structural Violence does not articulate the benefits of utilizing ethnographic data visualization as a methodology to identify and connect the “construction materials” of structural violence.
The data visualization aspect on this website will be a novel contribution to Farmer’s suggestions.
I feel that ethnographic data visualization can add a layer of complexity on top of interlocutors’ storytelling. While data can only show patterns, not solutions, visualizations can give meaning to “white space” or absence. It can call into question why some data is present while others absent.
By looking at what is present or what is acting, we fail to consider the underlying absence and the impact it has on our social construction of the world. Farmer describes absences, specifically those tied to the relationships of structural violence, as intentional; things such as stories, opportunities, and data do not exist or are absent because of “erasures” (Farmer 2001, 309). The use of the word erasure indicates action, intent, and decisiveness- that there was once something there, but powerful structures, relationships, or individuals acted to render them absent. This is why visualization is imperative to understanding structural violence.
Farmer’s Impact on this Website’s Design
The layout of this website aims to discuss examples of the manifestations of structural violence in Philadelphia and how these violent relationships are assaulting the afflicted populations’ health.
The section, Socially Ingrained Violence, will look at visual maps of the Philadelphia region as a function of time. These, compounded with data and narrative, can show the timeline and effects of structural violence. This section is a visual attempt at Farmer’s emphasis of a “historically deep and geographically broad analysis” (Farmer 2001, 309). The examples discussed here will include the formation and function of the Philadelphia neighborhoods, the city’s changing demographics, the impact of infrastructure, and how the accumulation of relationships resulted in a metaphorical, geographic vacuum.
Just as Farmer attests, an account of the structural violence in Philadelphia would be incomplete without “tak[ing] into account political economy” (Farmer 2001, 309). The section Health As a Commodity outlines the substantial role neoliberalism contributes to violent relationships and how our neoliberal construction of health has allowed some to prosper while others to suffer from poor health.
Additionally, sections such as Mama Sunshine and Can We Get the Lead Out? demonstrate health inequalities specific to the Philadelphia region through ethnographic data visualization and interlocutors’ storytelling. These stories specifically aim to identify, understand, and visualize “which construction materials were used, and when, and why, and how” in the opioid epidemic and childhood lead poisoning epidemic (Farmer 2001, 309).
However, it is important to caution the reader that my website organization in no way attempts to argue that there is a historical origin to structural violence. This idea of compounding, or the dependence of relationships on each other, argues that looking for an “origin” of structural violence would prove unfruitful. Structural violence is a complex interaction of culturally reinforced societal values, over time, that shape our definitions of concepts, such as housing, healthcare, personhood, and the environment. It is the result of the aggregate rather than an origin.