Contextualizing Gentrification
Philadelphia’s neighborhoods are changing, and fast
Construction and demolition now characterize many of the neighborhoods and communities in the city. Practices of renovating historic rowhomes into posh, modern homes initially occurred in neighborhoods such as Graduate Hospital and Old City; however, gentrification has entered the Riverwards neighborhoods in the past 10 to 15 years (Maule 2016).
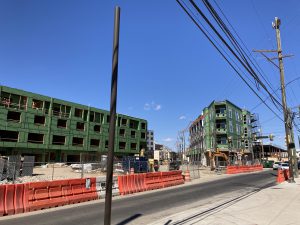
Gentrification is usually discussed in terms of race/ethnicity and income; it is a process that often occurs in neighborhoods with an abundance of relatively low-priced housing. This housing is commodified by (usually) upper-class white residents who have the mindset that with “changes,” they can re-make a “hardened” neighborhood into a “posh, cozy, or eclectic” atmosphere. Gentrification causes an abrupt increase in real estate and rental prices, which displaces the original neighborhood population. This process is currently happening in the neighborhood of Fishtown. New renovations, such as those depicted in the image below, raise the value of the housing stock to supersede the previous population. Not only is the practice of gentrification altering the historic landscape of Philadelphia, but it is altering the collective identities of each neighborhood. Occupants in homes in Fishtown were often third-generation homeowners. Now, an influx of professionals with higher education degrees occupies the neighborhood.
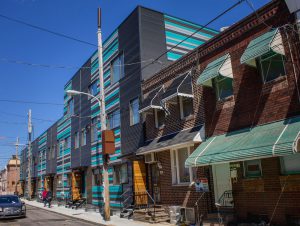
Juxtaposition of a renovated, modern rowhome to a historic rowhome in Philadelphia. Image taken from https://hiddencityphila.org/2017/06/row-house-past-and-its-future/The following visualization shows the drastic effects of gentrification in Fishtown from 2010 to 2018. It juxtaposes the amount of housing available at incremental value brackets in Fishtown against the nearby Kensington neighborhood. While Fishtown and Kensington share very similar histories in the rise of Philadelphia, their current narratives could not be more different. On average, the homes in Fishtown (represented by Census tract 158) are worth 4x those in Kensington (represented by Census tract 178), although they are of the same rowhome construction.
Gentrification displays the cracks in Philadelphia’s low available housing stock and the systematic inequality that was historically built into the US housing system. So, you may ask, how does gentrification tie to discussions surrounding the relationship between health and structural violence? Well, Rachel pointed out that gentrification processes, and specifically those involving housing demolitions, have unequally re-introduced buried lead back into the Philadelphia environment.
“[Lead] doesn’t want to be disturbed. It just sits there, so it doesn’t go away. It stays there until somebody disturbs it.” -Rachel Kaminski
One question that arose as I created the contamination map visualization was: through what societal processes is lead re-introduced back into the Philadelphia environment? For society to undervalue lead poisoning to the extent that Rachel described, the typical lead disruption processes have to be frequent yet poorly informed. One needs to look no further than gentrification, which has been a “hot topic” in many up-and-coming Philadelphia neighborhoods in the last decade.
This visualization aims to depict the enormity of housing demolitions occurring within the Philadelphia area in the past decade. Cycle through the “year of completed date” filter to see the different yearly patterns this dataset contains.
The categories in this dataset are significant to Philadelphia’s history. The classification and categorization practices of demolitions have changed over the years (which skews the data), but you can still filter this visualization by demolition category. There are two categories that I wish to draw your attention to; the first is the “tankri” or tank removal demolition. The second is the “full demolition.”
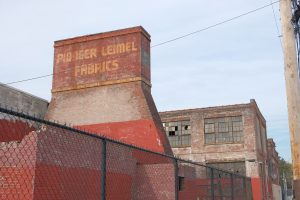
The creation of these categories marks the importance of Philadelphia’s industrial history in housing remodels. Many older Philadelphia homes were heated using fuel oil, which required underground oil tanks. Factories and smelting operations also used tanks of these sorts to contain hazardous waste materials. As homes transitioned to more modern heating systems and factories were left abandoned, tanks with hazardous materials were left, often unknowingly to the homeowner, underground. The frequency of demolitions involving tank removals in Philadelphia signifies this history. Additionally, full demolitions imply abrupt processes of gentrification and an enormous risk of releasing lead particles into the community.
This visualization expands upon the previous by contextualizing demolitions in Philadelphia with the contamination map. The presumably overwhelming amount of data aims to emphasize the number of individuals potentially subject to lead dust in Philadelphia per year. It is arguably more individuals than this visualization can depict when considering the distance that lead-contaminated dust can travel (up to 400 ft).
This visualization is a data representation of Rachel’s frustrations with the city of Philadelphia. However, it only represents half of the story. Not only does Rachel have to employ specific health practices, like keeping her children away from demolition sites, but she additionally cannot make sense of the city’s regulations surrounding demolitions. She describes many of these issues in the clip below.
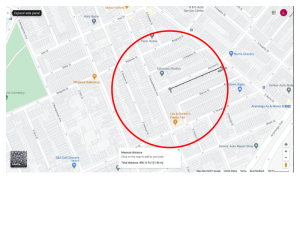
The image below represents the radius of “notification” that Rachel described in the clip; a study by a Boston research team determined that lead-contaminated dust can travel up to 400 feet in a demolition. The red circle outline shows the number of homes that could be potentially affected by lead if a demolition would occur at the property in the center of the circle. The difference between the number of homes within the radius of dust exposure compared to the requirements of notification of demolitions is visually striking in comparison to Philadelphia’s standard practice. Rachel told me that standard practice in Philadelphia is three homes on either side and seven in the front and back of the property.
Impacts of Gentrification
Community groups such as GLTO recognize the complexity of lives and space in addition to the difficulties in rectifying one’s home and community as toxic. Murphy’s discussion of “alterlife,” aimed at grasping the complexities of the relationships between molecules, colonialism, and human bodies, adds to these concerns. She discusses how viewing life as “already altered” shows how one’s life and health status are deeply intertwined with capitalism and production patterns, where the historical remnants of valued goods are now considered bodily contaminants.
Murphy’s use of the concept of alterlife implores us to understand the complexity of spaces currently existing and cultivated throughout Philadelphia’s history. Many individuals who reside in contaminated spaces in the Riverwards do not have the economic means to move to an uncontaminated space. This socioeconomic barrier to housing means that a condition of their existence, limited by unequal economic opportunities, is to have a potential bodily-chemical relationship with hard metals such as lead. Through this framework, we can understand that Philadelphia’s greater economy was built on a continual outpour of toxicity into the land, which is granting individuals unequal life chances. It is also important to acknowledge that areas with lead contamination have lower real estate values and receive less city investment. The result is that populations with greater percentages of poverty are living in unequally-contaminated spaces.
The following visualizations aim to provide contextualization and commentary on Murphy’s arguments. It shows geographic areas of intersection of demolitions with other variables.
In creating these visualizations, multiple patterns appeared to me. First, there seems to be an aggregation of tank removals in the Fishtown area, coupled with a large concentration of historical smelting and contamination sites. Furthermore, a similar pattern occurs for full demolitions; there are harsh lines of divides surrounding the Fishtown neighborhood in full demolitions.
When considering other demographic factors such as household income, full housing demolitions correlate with areas associated with higher incomes. Not only are they higher incomes, but they are drastically larger incomes (the highest bracket is broad, from $86,700 to $250,000). This socioeconomic disparity is exemplified in a comparison between Kensington and Fishtown; again, these neighborhoods are similar historically but now significantly differ in demolitions and income. This means that they might also differ in lead contamination released by demolitions.
Finally, it is also imperative to analyze the individual actors who are inflicting violence on the surrounding populations when considering structural violence. We need to look no further than the last visualization. While all Riverward neighborhoods are arguably similar in terms of historical contamination sites, they differ drastically in household incomes. Those who have the monetary means to renovate are hiring individuals and contractors that often do not abide by the health regulations Rachel discussed. Children in the surrounding area could be poisoned by dust that contractors do not control; studies such as this one show how quickly lead-contaminated dust can accumulate in areas surrounding a demolition site which might be a child’s play space. It is hidden violence where one side gets a lavish, renovated home while the other has a constant fear for their child’s health.
![]()