DRAWING CONNECTIONS
Literally and Figuratively
My goal for this website, besides creating a vessel for community narratives, was to emphasize that absence doesn’t just appear in relationships and the built environment in Philadelphia, but additionally in the partial knowledge that feigns whole knowledge in our society.
To illustrate this point (for the final time, I promise), let me fill in the narrative absence of the movie placed on the “Home” page of this website. The narrative of events extending out past the timeline of 4 minutes, 48 seconds is arguably just as important to discuss as the movie’s actual contents; namely, my emotions and reactions as an outsider in the Philadelphia environment did not simply end with a bright afternoon, filled with games and snacks.
Five PM marked our day’s close at the airstream activation site on H street; cleanup ensued. Setting up and breaking down an airstream trailer in a city was no easy task. The trailer was connected to both my boss’s car and two generators to run the technology (and slight air conditioning). Safety clips were in-between and below the wheels to prevent it from rolling back. As a group, we removed the brakes and loaded all the yard games and equipment inside of the trailer. We began to say our goodbyes. Our community partners had left the corner lot of grass, and the sun began to set. This sudden feeling of absence snapped me back into a reality that I was an outsider in this neighborhood. I remember feeling glad to be heading home before it was dark, because I was a college-aged female living in a semi-unfamiliar city who had been told her entire life to never walk alone at night. However, as my group of interns prepared to order an Uber to take us to the Center City area, my boss realized his car battery had died. I subconsciously knew that it wasn’t an option to leave the airstream trailer, in which thousands and thousands of dollars of grant money had been invested, on a street corner in Kensington overnight. I felt uncomfortable, standing on the corner of H street as daylight diminished, with no game plan.
These thoughts, experiences, and emotions occurred before I was substantially engulfed by the study of anthropology. In the semester following my summer in Kensington, anthropology showed me a whole new side to academics that I had never been exposed to before. This, in turn, redefined health for me. Before my Princeton education, I took the world for what it was and never questioned it. I never knew that I was allowed to question it and I was never taught how to formulate those questions. Anthropology as a discipline provided this baseline; it legitimized my questions like: Why do I see the world in the way that I do? What causes society to be structured the way it is? How (and who ?!) defines health in our society? What are the structures functioning in society that allow me to rehabilitate my sports-induced shoulder inflammation, but do not allow others basic access to quality healthcare?
I loved my anthropology classes, in comparison to my other “cookie-cutter” pre-med classes, because they emphasized complexity rather than “one correct solution.” Instead of explaining things in a linear fashion, my professors pushed me to make things more complicated. This is because humans, our societies, and cultures are complicated! There’s always another perspective and there’s always another story to be told. In this way, I feel like learning what “anthropology is” is a continuous process, where we assign value to the fact that there are limitless stories, perspectives, and representations in our world. It’s “turtles all the way down”, right Geertz? (Geertz 1973, 29).
Looking back and reflecting on those feelings I had that evening in Kensington, I wish that I had many of the tools contained in this website. I wish that I had knowledge of data as a social construct and how it has the power to skew my perception away from the hands of structural violence. I now realize the extent which data and media about the Kensington neighborhood influenced my emotions and perceptions. Building up to the airstream’s first activation, I was looking at data visualizations in the “Heart of Kensington Collective Impact” report in order to contextualize our lab’s presence in the neighborhood. While this report emphasized how the community needed to collaborate to make effective change, the heat maps depicting intersections of gun violence and the narcotics market were abrupt and startling. It’s hard to “unsee” a geographic area marked in such a stigmatizing way. Data, and its visualizations, influenced my perception as an outsider. My emotions that day were a function of partial knowledge: a half-story instead of a whole story. I took this half-story, the heat map data visualizations, as the entire “truth” rather than a subjective interpretation of the lovely individuals who I had just spent the day with. Data in this way held power over me (in influencing my emotions), but also over the residents of Kensington for influencing the perspectives of outsiders like myself.
My inherent writing of this thesis, and giving you insight into my past memories and emotions, exemplifies that perceptions can be undone with proactive engagement; it comes from a personal willingness to break the structures that attempt to separate us in society in search for an equitable, and healthier, future.
Before this project, I thought that data was “the tool” to a conceptual understanding; however, I quickly realized that I was looking to the wrong sources- individuals of power were creating data and categories for neighborhoods such as Kensington rather than inviting residents to express how they define their neighborhood through data. This made me question, theoretically: What categories do they create? How do they populate them? What is present and what is absent?
In late 2020, I created community art kits with the goal of engaging with these questions. The creation of these packets was my way of answering how I, as an anthropologist, can create space to share health data authored by Philadelphia residents for the purpose of sharing the narratives of those residents. I mailed packets of art supplies, along with pre-addressed envelopes to Jacquelyn Saez, a program manager for the Sunday Suppers nonprofit. She distributed them to individuals in the Kensington community (endless thank you’s, Jackie!) while I waited at home, with fingers crossed that I would have an opportunity for collaboration.
Maria’s Health Data Narrative
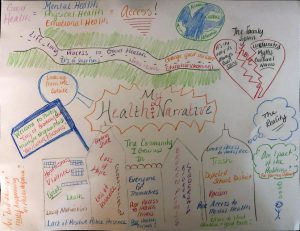
The above image arrived on my doorstep on Sunday, April 11th, which happened to be exactly 5 days before this project was due. I couldn’t help but smile, recollecting on how this journey had come full circle in the span of the past 12 months, through obstacles of remote learning, the COVID19 pandemic, and learning how to do virtual ethnography. I picked up the manilla envelope, and its contents revealed Maria’s hand-drawn health data narrative; this piece of paper encompassed this entire project, as the methodology of ethnographic data visualization inherently prioritizes “drawing connections” by linking data and local narrative.
Maria created a visual representation encompassing many of the themes I attempted to express on this website. She illustrated Philadelphia row homes, populated with labels such as “loss of hope,” “loss of motivation,” “lack of positive police presence,” “poor access to health centers,” “broken promises,” “limited access to parks and recreation,” “depleted schools,” and the absence of “affordable,” yet healthy, foods. The visual dichotomy of filling a home with absence reaffirmed to me that the most effective way to communicate absence as a result of structural violence is with properly contextualized images, not solely the presence of words.
![]()