Community Data and Design
Delineating Societal Data and Community Data
Roz’s perspective, which is that every Sunshine or individual affected by violence or trauma is “somebody’s someone,” is another mechanism that can be applied to dismantle structural violence. Currently, structural violence is operating in Kensington by classifying bodies in terms of our social construction of health, deeming them as worthy or unworthy of receiving medical attention. Roz’s relentless acceptance of human beings, regardless of the stage of life they are in, shows how lumping individuals into socially constructed categories serves a specific purpose rather than out of necessity.
Data are social creations in which these categories of health are reinforced. However, there are two types of data I wish to delineate. There is data in which society produces (that oftentimes reaffirms society’s narrative) or there is data collected by community members for the purpose of assisting their community (assistance in this instance is through their own terms, not society’s terms). Data in both instances are social creations, but its intention and use drastically differs.
For example, data are collected by the Philadelphia Health Department about health behaviors in Kensington, Philadelphia, like the number of overdoses present in the ZIP code per year and the number of Nacan doses administered by emergency personnel. These data are not “publicly” available on open data portals; I was only able to obtain it (after a month long, virtual wild goose chase) and filling out a Health Data Request Form by the Philadelphia Department of Health. This form was similar to a “right to know” request. In comparison with community derived data, these data only show half stories without proper contextualization of the workings of structural violence; they are often displayed or created to further the agenda or narrative of powerful Philadelphia organizations.
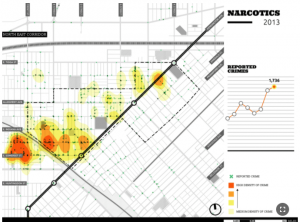
The visualization above is an example of an un-contextualized visualization that can be compiled from opioid overdose data via the Philadelphia Department of Health. While these maps show an overarching narrative of the climb of opioid overdose deaths throughout the past decade in Philadelphia, it abruptly highlights the Kensington neighborhood. This choropleth map, singling out one geographic area, visually reinforces many of the ill-contrived narratives about the neighborhood.
The maps produced by the Heart of Kensington report are another example of ill-contrived visualizations; they depict intersections in the Kensington neighborhood as heat maps. The deeper red coloring indicates higher levels of criminal activity. The use of the red color here is intentional, as red symbolizes “danger,” “bad things,” and “blood” in our society. These maps were produced for the purpose of rationalizing their proposed plan in targeted revitalization of the neighborhood (“Heart of Kensington Collective Impact 2022, Neighborhood Plan,” n.d.).
While I am not opposed to community planning in the Kensington neighborhood, as long as it centers on the direct needs (rather than perceived needs) of community residents, it is imperative to point out that data is often utilized and created to evoke emotion. This is followed closely by action. However, action can be both good and bad: it can further structural violence by inhibiting the recognition and societal acceptance of embodiment, or it can promote productive community change.
Roz’s Data Collection
Community derived data contrasts with my previous examples in its style, mode of collection, and intention. My interlocutor, Roz, taught me these differences when she described her data collection process in Kensington, Philadelphia.
Roz told me that she originally started writing down data of the Sunshines she encountered as a form of prayer; she said,
I think for me, I’m praying for them in my own way, which is like writing their names in the Bible because you can’t really hover over someone who’s blue in the face.
The data that Roz collects in her handheld Bible are examples of data for the purpose of action rather than categorization. It is data for the purpose of improving lives, rather than just commodifying them as numbers. As time passed and Roz continued to reverse Sunshine’s overdoses in Philadelphia, the types of data she collected changed. Now, she documents the time, location, number of Narcan doses administered, sex/gender, rough age, survival prognosis, and whether they accepted EMS assistance. Roz then walked me through her social production of data, and how cyclic transfer of data from Sunshine to Roz to the community enables data to improve the lives of Sunshines:
“The data has changed quite a bit since I first started, but I also noticed that, um, the stamp name is the name of the drug; like the dealer puts a stamp on their bag…that’s how dealers kind of brand their product.
…Okay, let’s say for instance, they’re selling this batch called Pac Man. So we get Pac Man from F and Allegheny or whatever, I’m just making this up… So now they know this might be some good shit. So now they tell all the other sunshines, ‘Hey we got Pac Man; it’s really good.’
…I feel like the data is important because if I’m in a certain part of my neighborhood, and I’m seeing people dropping, dropping, dropping I want to know what’s nearby. And what that batch is so I know to tell the next person, ‘Hey, this particular batch is killing people, stay away from Pac Man because it’s taken six lives in the last hour.’
…And if they are going to go do it, [I tell them] don’t use your normal dose. Like, if you’re always using two, or three, bags…don’t use three bags because you’re not going to survive…It’s like a form of harm reduction that no one thought would be part of our conversation. Because, I was growing up to say no to drugs. But realistically, that’s not going to happen when you’re in a community where people use drugs.
…Learning these things over the years has been a part of keeping my community alive.”
The following visualization is one that I created in an attempt to visually depict not only the enormity of individuals Roz has interacted with and impacted, but additionally to show how lives in the harm reduction community are an aggregate and inherently interconnected. Societal data on the number of overdoses per ZIP code does not have the ability to demarcate these crucial relationships.
Through Roz’s collection of data, and distribution of data in the form of harm reduction, data can be applied to counteract structural violence and improve the health of those oppressed. In this instance, data does not adhere to society standards of categorization, but rather locally constructed categories that benefit individuals’ lives.
Roz does not collect data in order to affirm the “larger problem” or media driven narrative that is told about Kensington, but to discern patterns that enable her to intervene, connect, and revitalize her community.
Design for the Community versus Design by the Community
Structural violence also operates in neighborhoods such as Kensington through impersonalized or unintentional design. Roz articulated this when discussing her Community Kit creation with me: oftentimes, she sees individuals or programs come into the community and “put their own spin” on Kensington resident’s narratives, therefore conforming the program’s ‘solution’ to the subjective ‘community problem.’ When these communities are presented with solutions, frameworks, or designs that fit society’s expectations rather than the local needs or local embodiments of the community, further violence is inflicted.
An example of this can be seen through Nixon’s War on Drugs; this social narrative framed Sunshines as criminals rather than individuals embodying the effects of structural violence. Rather than taking responsibility and being proactively, the government displaced responsibility onto Sunshines. The ‘solution’ was prison time, which solved society’s fear of drugs (in 1989, 64% of polled Americans said that drug abuse was the nation’s number one problem) but did nothing to help the communities affected by structural violence (A Brief History of the Drug War, n.d.).
Rather than co-opting individuals’ narratives and designing for them, which replicates the power dynamics present in structural violence, community members need to be present and a central perspective in designing practical and applicable solutions for their communities.
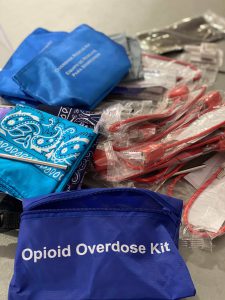
The Community Kit
Roz’s creation, design, and production of the Community Kit counteracts structural violence in her community. These kits include a face mask, tourniquet, Narcan, gun lock, tampon, and gloves. Roz has placed these kits in all of the corner stores in her community, and it is local knowledge that they are available for anyone’s use. The circumstances of need or actions that occurred which preceded the use of the kit do not provide a barrier of accessibility; as Roz stated, there are
No questions asked.
These design decisions, such as the lack of conditions for use, show how some resources are counterproductive in communities; they judge an individual’s actions that led up to the necessity of the kit rather than compelling action to meet their needs.
These kits address the specific needs of Kensington residents; for example, a drug dealer may need an additional gun lock because of the weapons in his household, but he wants to ensure the safety of his children. The tampon and tourniquet are materials to be used if an individual is shot, so that the blood flow can be slowed whether on an extremity (tourniquet) or trunk (tampon) of the body while help arrives.
Roz said that her creation of these kits was based on the need to “co-exist.” She said that proactive approaches like this, with local narratives, circumstances, and needs of her community in mind,
keep people alive long enough until they get their shit together.
They do not “reinforce behavior” as society often argues; the Community kits were created with the goal of saving lives, regardless of the individual’s community role, rather than furthering societal norms of health. If societal norms of health were the basis for design in Kensington, Roz’s constituents’ lives would be lost.
Connecting Community Data and Design by the Community
The Community Kit is an example that shows how data only has the potential to affirm a problem; it does not present a solution. Data shows us, in the opioid epidemic, how individuals with barriers to healthcare are more likely to live in environments and neighborhoods burdened by the epidemic; this increases their risk of poor health and enduring violence. However, this data, while showing us the geographic areas of importance, cannot be used for a solution without proper contextualization. It needs to acknowledge community distrust and the embodiment of structural violence.
In the case of the city of Philadelphia’s data, data can tell us of the “bad” narratives that compose the Kensington neighborhood, from sex trafficking to drug use to gun violence. However, many solutions using this data, such as Roz’s Community Kit, aim to reduce the numbers represented in the data, rather than focusing on how to directly impact the lives of individuals in the neighborhood. These factors, and the relationship between data and structural violence, is imperative to keep in mind when aiming to show how structural violence operates to affect an individual’s health.
![]()