Category Archives: Restricted

Muslim Migration into the EU, 1957 to 2004

Caption

Muslim Migration into the EU

Summary

This map shows the migration of Muslims into Europe. The European countries are color coded by year (1957-2004) in which they joined the European Economic Community (EEC).

Source

Historical Atlas of the Islamic World (p. 166)

Copyright

Copyright © Oxford University Press, 2004

License

This map is used on this website by permission of Oxford University Press.

The license only allows it to be used in connection with SOC284 and WWS572B at Princeton University during the 2008-9 academic year.

The map appears in Malise Ruthven and Azim Nanji, Historical Atlas of the Islamic World (Oxford University Press, 2004).

Napoleonic Europe in late 1812

Caption

Napoleonic Europe in late 1812

Summary

“By mid-1812, the areas shown in peach were incorporated into France, and most of the rest of Europe was directly controlled by or allied with Napoleon. But Russia had withdrawn from the failing Continental system, and the decline of Napoleon was about to begin.” [book].

Source

Donald Kagan et al. The Western Heritage Since 1300. (p. 682)

Prentice Hall [Pearson]

Copyright

© 2004 Prentice Hall [Pearson]

Modern Missions in the South Pacific

Caption

Modern Missions in the South Pacific

Summary

Map shows missionary routes from North America and Europe into Southeast Asia and Australia, 1797 – 1901. It provides dates, origins and names of missions.
This is a copyrighted work. Its use on QED is under the “Fair Use” rule..

Source

The MacMillan Atlas History of Christianity (p. 145)

By Franklin H. Littell. Cartography by Emanuel Hausman.

Copyright

© 1976 Maps and plans copyright by Carta Ltd. Text copyright Macmillan Publishing Co., Inc.

Movement of Jews in Arabic Countries to Israel

Caption

Movement of Jews in Arabic Countries to Israel

Summary

Map shows the presence of Jewish minorities in Arab and non-Arab countries, and their migration to Israel in the mid 1940s.

Source

The Penguin Atlas of Diasporas. By Gerard Chaliand and Jean-Pierre Rageau. Maps by Catherine Petit. Penguin Books U.S.A. Inc., 1995. (p. 53)

Copyright

© 1995 Gerard Chaliand and Jean-Pierre Rageau

Modern Missions in Asia

Caption

Modern Missions in Asia

Summary

Map shows missionary routes from North America and Europe into Asia, 1807-1909. It provides dates, origins and names of missions.
This is a copyrighted work. Its use on QED is under the “Fair Use” rule..

Source

The MacMillan Atlas History of Christianity (p. 146)

By Franklin H. Littell. Cartography by Emanuel Hausman.

Copyright

© 1976 Maps and plans copyright by Carta Ltd. Text copyright Macmillan Publishing Co., Inc.

Modern Missions in Latin America

Caption

Modern Missions in Latin America

Summary

Map shows missionary routes from North America and Europe into Asia, 1835- 1910. It provides dates, origins and names of missions.
This is a copyrighted work. Its use on QED is under the “Fair Use” rule..

Source

The MacMillan Atlas History of Christianity (p. 144)

By Franklin H. Littell. Cartography by Emanuel Hausman.

Copyright

© 1976 Maps and plans copyright by Carta Ltd. Text copyright Macmillan Publishing Co., Inc.

Modern Missions in Africa

Caption

Modern Missions in Africa

Summary

Map shows missionary routes from Europe and North America into Africa, 1741-1927. It provides dates, origins and names of missions.
This is a copyrighted work. Its use on QED is under the “Fair Use” rule..

Source

The MacMillan Atlas History of Christianity (p. 147)

By Franklin H. Littell. Cartography by Emanuel Hausman.

Copyright

© 1976 Maps and plans copyright by Carta Ltd. Text copyright Macmillan Publishing Co., Inc.

Missionary Awakening in Europe

Caption

Missionary Awakening in Europe

Summary

Map shows missionary routes from Europe to other regions in the world, 1793 – 1930. It provides dates, origins and names of missions.
This is a copyrighted work. Its use on QED is under the “Fair Use” rule..

Source

The MacMillan Atlas History of Christianity (p. 142)

By Franklin H. Littell. Cartography by Emanuel Hausman.

Copyright

© 1976 Maps and plans copyright by Carta Ltd. Text copyright Macmillan Publishing Co., Inc.

Millennium in Maps – Population, 1999

Caption

Population, 1999

Summary

This poster includes:

  • a world cartogramwp depicting national population and growth;
  • four world maps on:
    • Fertility (“the average number of children born to women during their lifetime”)
    • Life Expectancy
    • Urbanization (urban population as a percent of total population)
    • World Migration
  • graphs on population by age and sex for Italy and Nigeria
  • a graph showing world population growth from 1750, with three projections to 2150

On the cartogram, each country’s area is proportional to its population.
Countries are color-keyed according to their population growth rates, not including migration.

Additional graphs:

  • Fertility in developing and in developed countries (in 1950, the present, and projected in 2050)
  • Urban Agglomeration (5 million people and above) in 1998 and 2015 (projected)
  • Life Expectancy in developing and in developed countries
  • Migrant Population (based on place of birth)

Source

Produced by National Geographic Maps for National Geographic Magazine, Washington, D.C., 1999.

This map is in the collection of copyrighted maps of the Geosciences and Map Library, Fine Hall (B level), Princeton University.

Call number: G3201.E39.1998.N3 (a)

Copyright

© 1998 National Geographic Society, Washington, D.C.

Series

This map is one in a series:


Missionary Awakening in America

Caption

Missionary Awakening in America

Summary

Map shows missionary routes from America to other regions in the world, 1810-1902.
This is a copyrighted work. Its use on QED is under the “Fair Use” rule..

Source

The MacMillan Atlas History of Christianity (p. 143)

By Franklin H. Littell. Cartography by Emanuel Hausman.

Copyright

© 1976 Maps and plans copyright by Carta Ltd. Text copyright Macmillan Publishing Co., Inc.

Millennium in Maps – Cultures, 1999

Caption

Millennium in Maps – Cultures, 1999

Summary

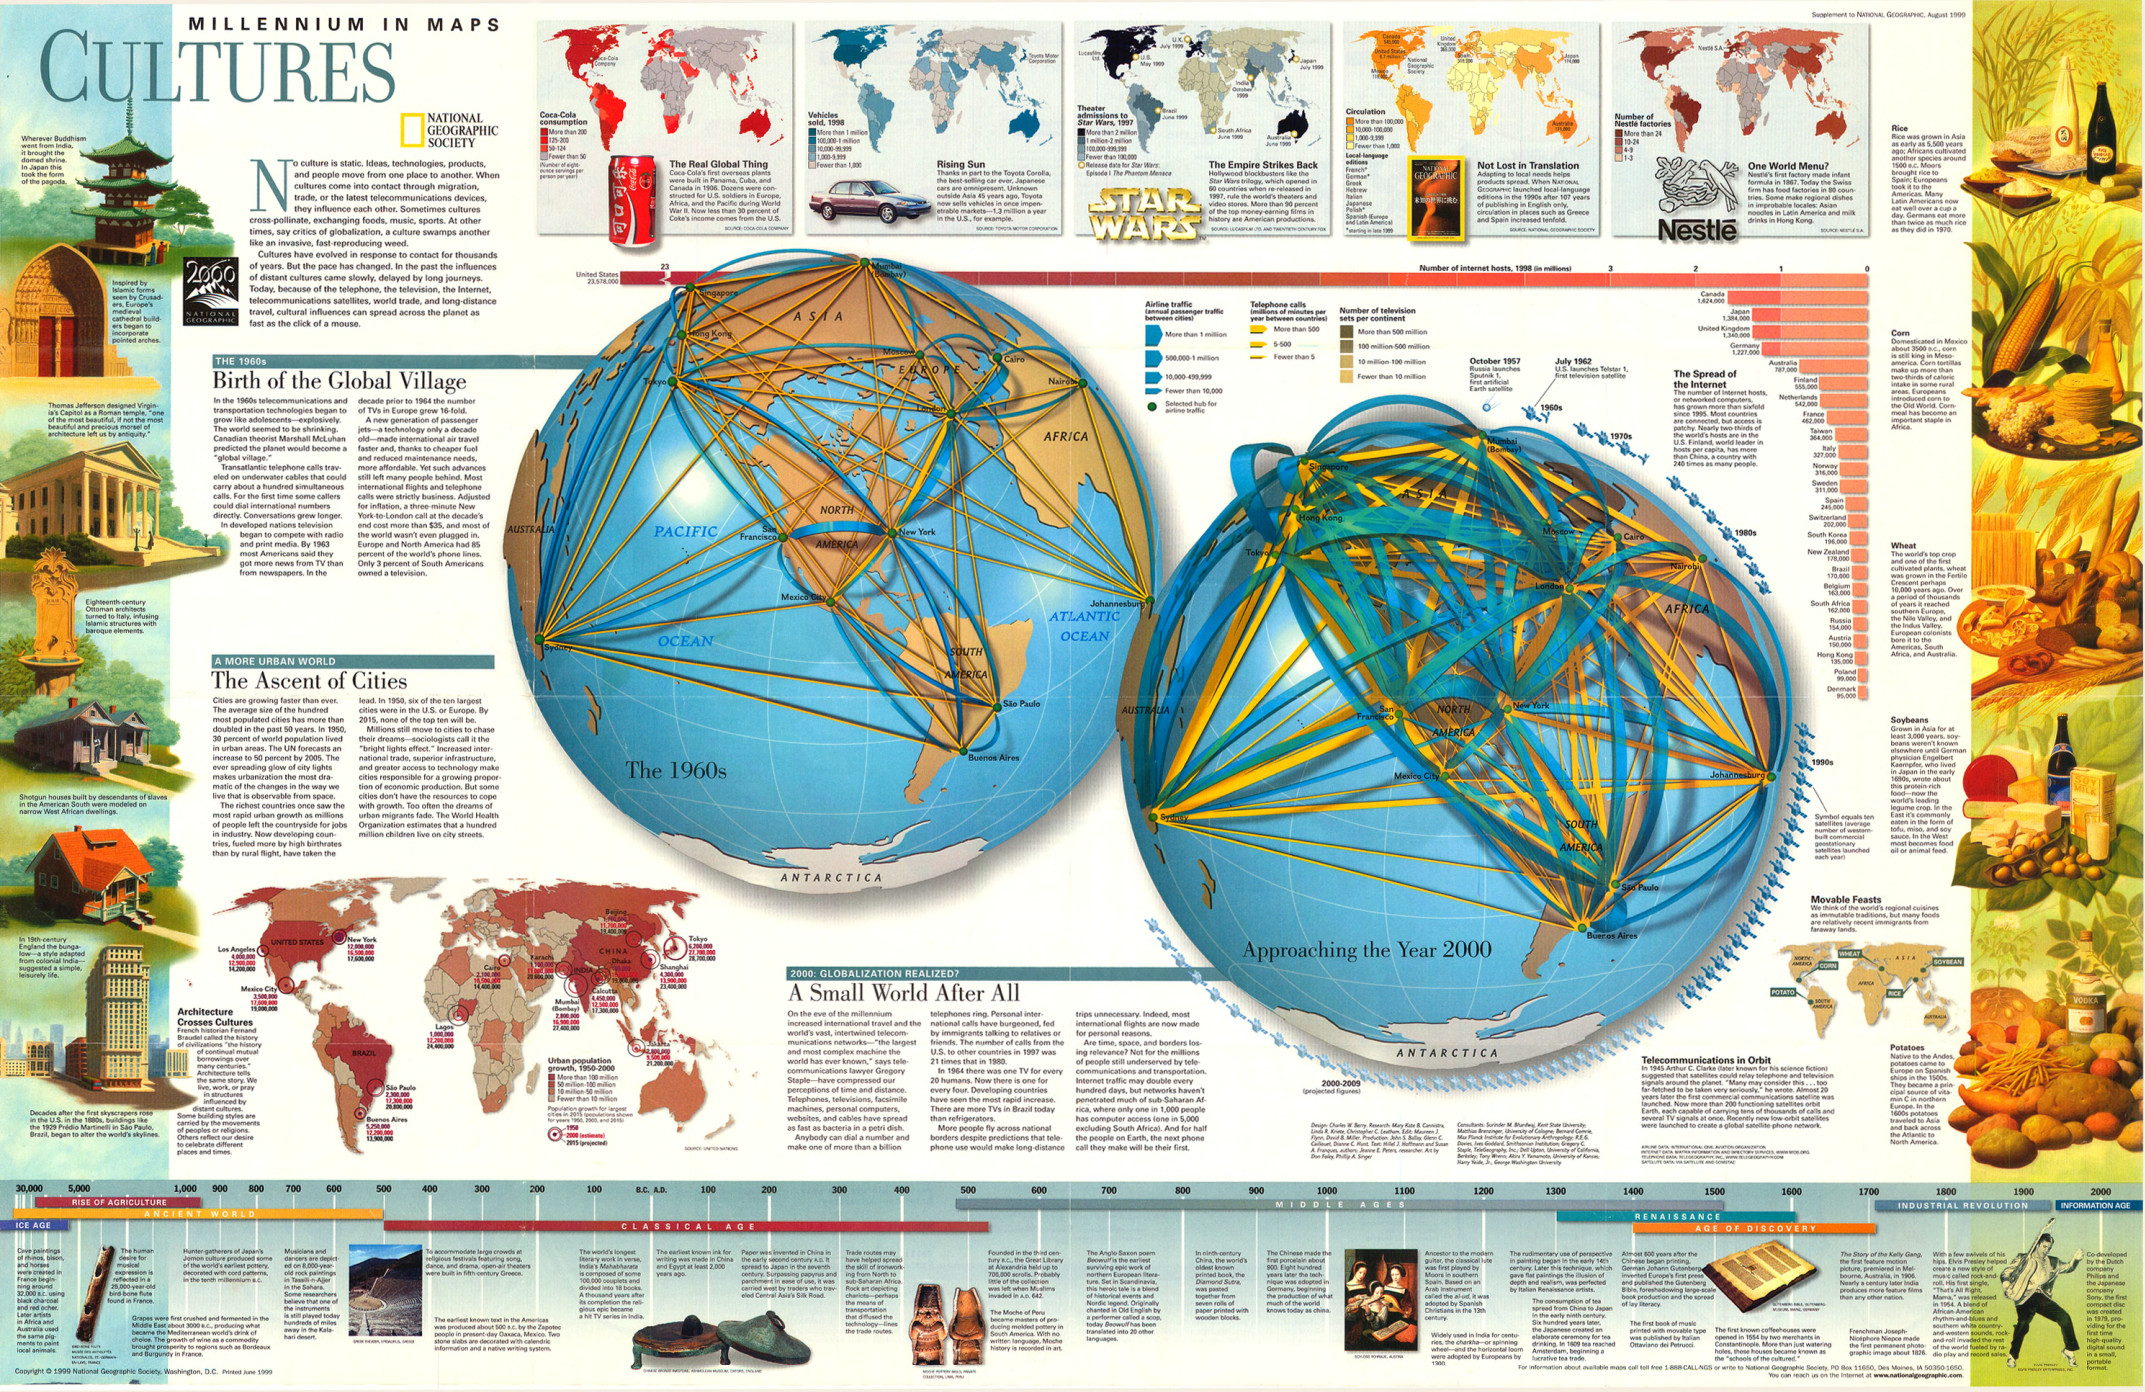
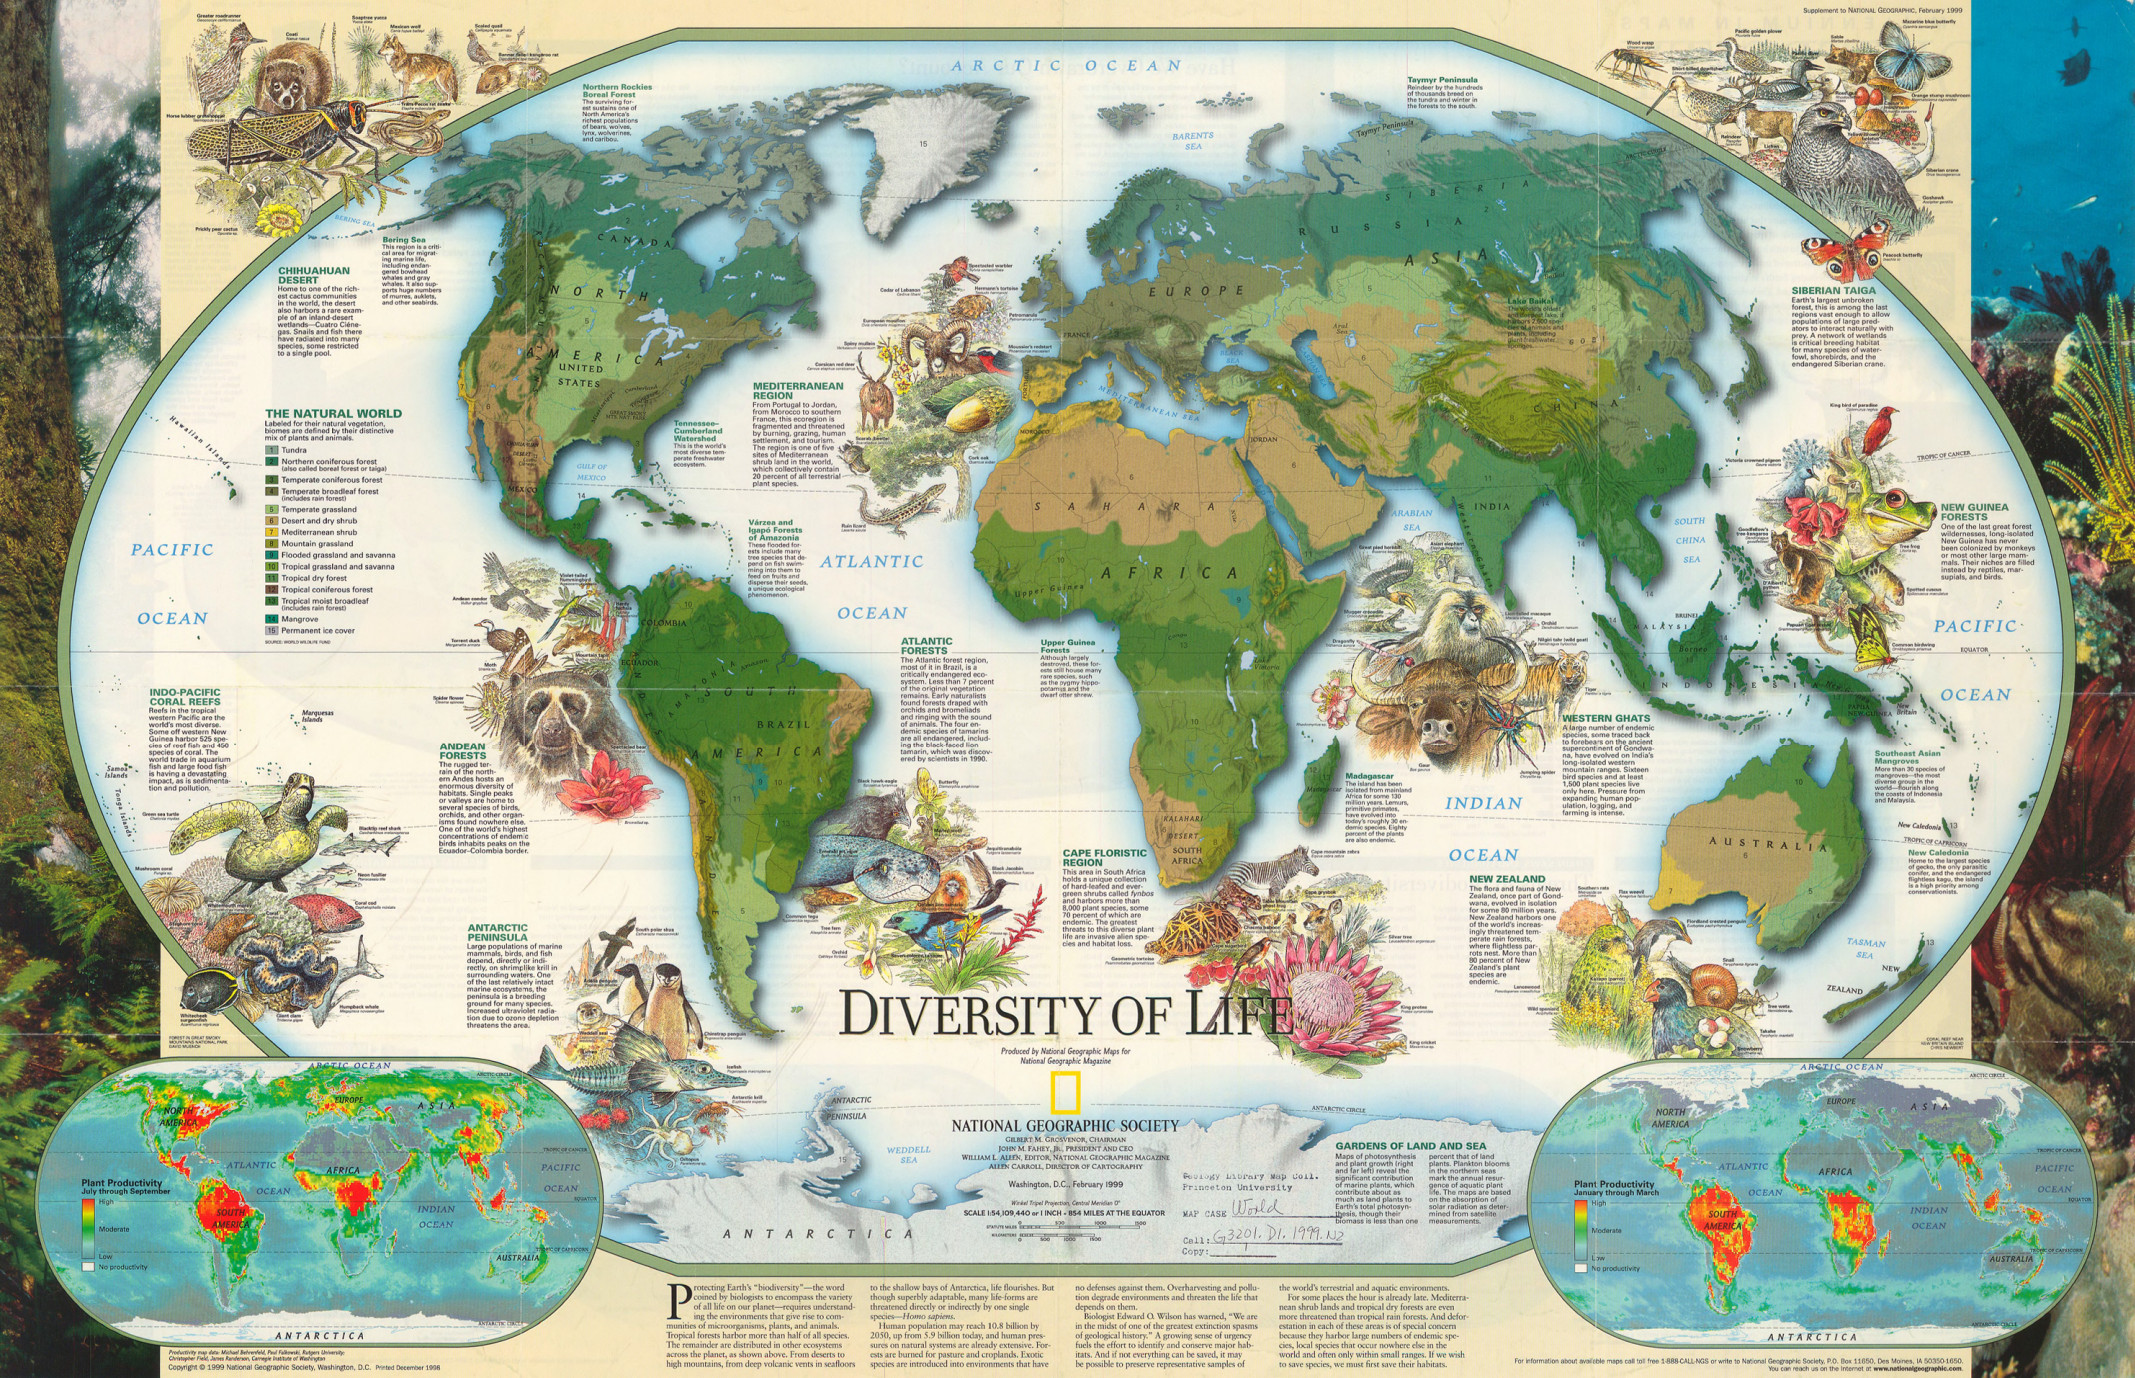
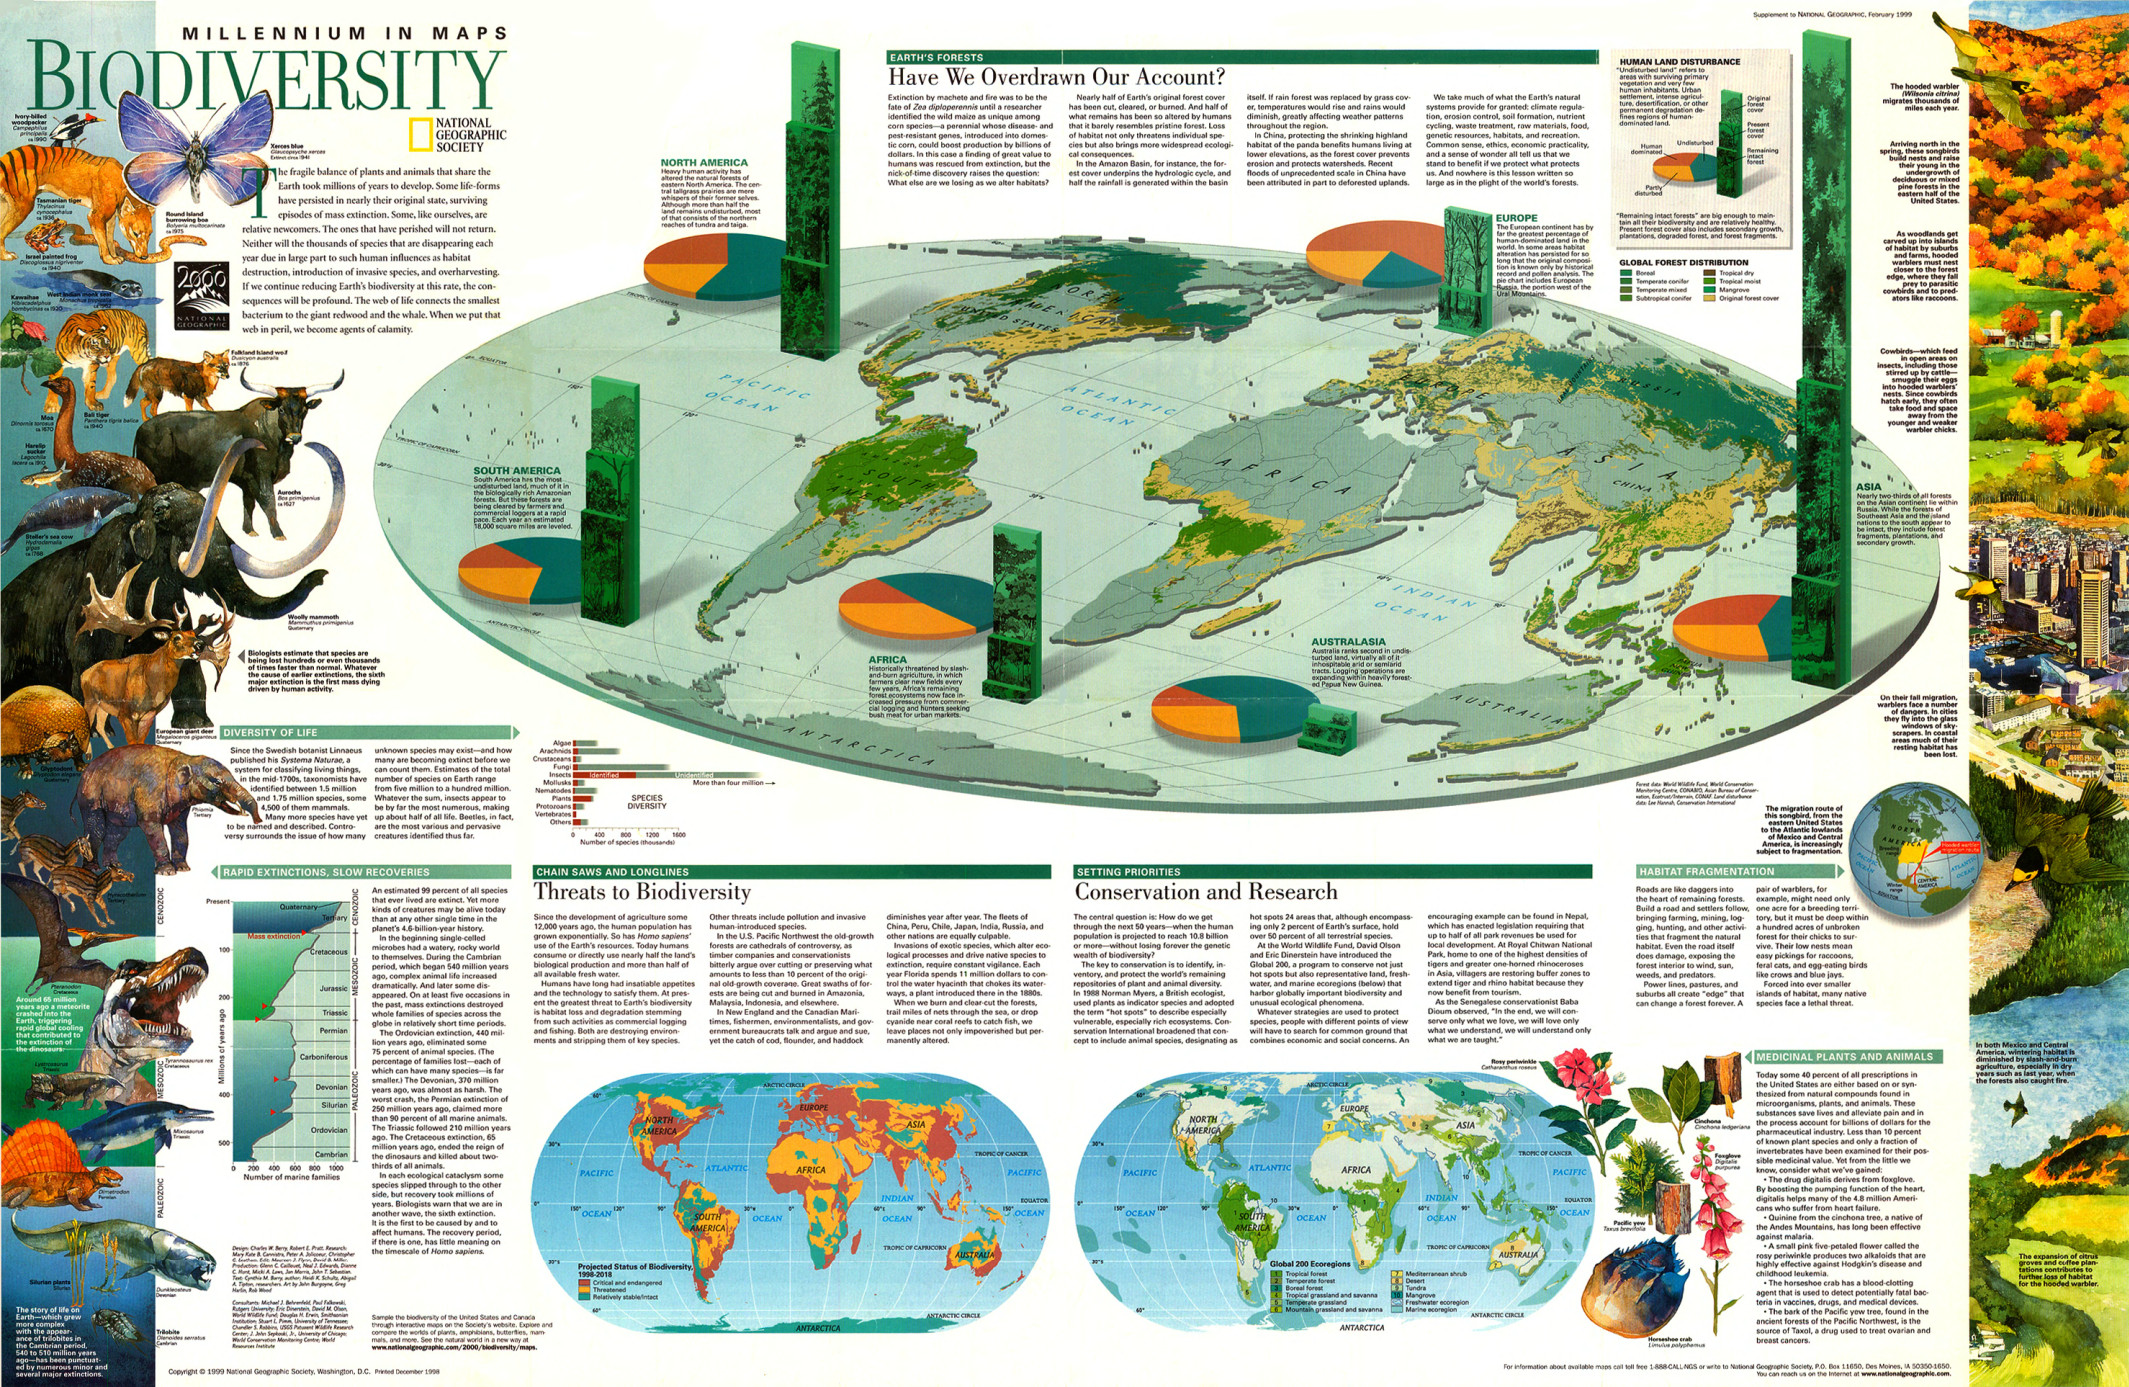
This poster includes two globes
and several world maps illustrating the expansion of globalization from the 1960s
until its publication in 1999.

The globes show the growth in airline traffic, telephone calls, and the number of telephone sets per continent.

The inset maps depict various statistics by country:

  • Coca-Cola consumption
  • Toyota vehicles sold, 1998
  • Theater admissions to Star Wars, 1997
  • Circulation of National Geographic magazine
  • Number of Nestle factories

The poster also includes:

  • Essays on the following topics:
    • The 1960s: Birth of the Global Village
    • A more urban world: The Ascent of Cities
    • 2000: Globalization Realized?: A Small World After All
  • A sidebar on architecture
  • Special sections:
    • Architecture Crosses Cultures
    • Telecommunications in Orbit
    • The Spread of the Internet
    • Movable Feasts – the story of rice, corn, wheat, soybeans, and potatoes

Legends:

  • Airline traffic (annual passenger traffic between cities)
  • Telephone calls (millions of minutes per year between countries)
  • Number of television sets per continent
  • Number of Internet Hosts, 1998 (in millions)
  • Urban Population Growth, 1950-2000
  • Population growth for largest cities in 2015 (population shown for 1960, 2000, 2015)

A timeline provides a historical perspective on culture and globalization from about
30,000 years ago:

  • Ice Age
  • Ancient World
  • Rise of Agriculture
  • Classical Age
  • Middle Ages
  • Renaissance
  • Age of Discovery
  • Industrial Revolution
  • Information Age

Source

Produced by National Geographic Maps for National Geographic Magazine, Washington, D.C., February 1999.

This map is in the collection of copyrighted maps of the Geosciences and Map Library, Fine Hall (B level), Princeton University.

Call number: G3201.P9.1999.N3

Copyright

© 1999 National Geographic Society, Washington D.C. All rights reserved.

Series

This map is one in a series:


Millennium in Maps – Diversity of Life, 1999

Caption

Millennium in Maps – Diversity of Life, 1999

Summary

This poster includes three world maps, an extended essay and supplementary descriptions.

The main map is color-keyed according to natural biomes, defined by their distinctive mix of vegetation and animals.

The two smaller maps show “Plant Productivity” for July through September and for January through March.

The legend for the main map is labeled “The Natural World” and indicates:

  • Tundra
  • Northern coniferous forest (also called boreal forest or taiga)
  • Temperate coniferous forest
  • Temperate broadleaf forest (includes rain forest)
  • Temperate grassland
  • Desert and dry shrub
  • Mediterranean shrub
  • Mountain grassland
  • Flooded grassland and savanna
  • Tropical grassland and savanna
  • Tropical dry forest
  • Tropical coniferous forest
  • Tropical moist broadleaf (includes rain forest)
  • Mangrove
  • Permanent ice cover

Descriptions of the following ecosystems are provided:

  • Indo-Pacific Coral Reefs
  • Andean Forests
  • Antarctic Peninsula
  • Chihuahuan Desert
  • Mediterranean Region
  • Siberian Taiga
  • New Guinea Forests
  • Western Ghats
  • New Zealand
  • Cape Floristic Region
  • Atlantic Forests

Additional information is provided for the following regions:

  • Bering Sea
  • Northern Rockies Boreal Forest
  • Tennessee-Cumberland Watershed
  • Varzea and Igapo Forests of Amazonia
  • Upper Guinea Forests
  • Taymir Peninsula
  • Southeast Asian Mangroves
  • New Caledonia
  • Madagascar


Source

Produced by National Geographic Maps for National Geographic Magazine, February 1999.
Data source: World Wildlife Fund.

This map is in the collection of copyrighted maps of the Geosciences and Map Library, Fine Hall (B level), Princeton University.

Call number: G3201.D1.1999.N2

Copyright

© 1999 National Geographic Society, Washington D.C. All rights reserved.

Series

This map is one in a series:


Military Spending and Service c. 2000

Caption

Military Spending and Service c. 2000

Summary

This map details military spending and service requirements in Muslim countries in 2000. Countries are color coded by military spending and duration of required military service.

Source

Historical Atlas of the Islamic World (p. 151)

Copyright

Copyright © Oxford University Press, 2004

License

This map is used on this website by permission of Oxford University Press.

The license only allows it to be used in connection with SOC284 and WWS572B at Princeton University during the 2008-9 academic year.

The map appears in Malise Ruthven and Azim Nanji, Historical Atlas of the Islamic World (Oxford University Press, 2004).

Millennium in Maps – Biodiversity, 1999

Caption

Millennium in Maps – Biodiversity, 1999

Summary

This poster includes three world maps and accompanying essays, graphs and supplemental materials.

The three principal maps depict:

  • Global forest distribution
  • Projected Status of Biodiversity, 1998-2018
  • Global 200 Ecoregions
    • Tropical Forest
    • Temperate Forest
    • Boreal Forest
    • Tropical grassland and savanna
    • Temperate grassland
    • Mountain grassland and savanna
    • Mediterranean shrub
    • Desert
    • Tundra
    • Mangrove
    • Freshwater ecoregion
    • Marine ecoregion

The main map is labeled “Have We Overdrawn Our Account?” and also
shows pie charts on “Human Land Disturbance” depicting human
dominated, undisturbed, and partly disturbed percentages for each
continent. Vertical bar graphs show original, present and remaining
intact forest covers.

Essays:

  • “Threats to Biodiversity” illustrates the degradation of biodiversity through commercial logging, fishing, pollution and invasive human-introduced species.
  • “Conservation and Research” describes the need to conserve “hot spots,” representative land, freshwater, and marine ecoregions that harbor biodiversity worldwide.

Other components:

  • Graphs on extinct and living species
  • Information about bird migrations
  • Special sections:
    • “Rapid extinctions, slow recoveries”
    • “Habitat Fragmentation”
    • “Medicinal Plants and Animals”

Source

Produced by National Geographic Maps for National Geographic Magazine, Washington, D.C., 1999. Biodiversity: Taking Stock of Life.

This map is in the collection of copyrighted maps of the Geosciences and Map Library, Fine Hall (B level), Princeton University.

Call number: G3261.D1.1999.N3

Copyright

© 1999 National Geographic Society, Washington, D.C.

Series

This map is one in a series:


Mexico and Central America, 1800-1900

Caption

Mexico and Central America, 1800-1900

Summary

This map demonstrates the liaison between independence movements and art movements in the Caribbean during the 19th Century. For each country in Central America and each island in the Caribbean, their respective dates of independence is accompanied by religious and European affiliation as well as the dominant art movement of that area and time. .

Source

Atlas of World Art (pp. 216-217).
Oxford University Press

Copyright

© 2004 Laurance King Publishing

Mahayana Buddhism

Caption

Mahayana Buddhism

Summary

Map shows principal transmission routes of expansion of Mahayana Buddhism to East Asia, and important Buddhist sacred mountains and sites.
This is a copyrighted work. Its use on QED is under the “Fair Use” rule..

Source

Buddhism: The Illustrated Guide (p. 121)

Kevin Trainor, Oxford University Press, Oxford-New York, 2001.

Copyright

© 2001 Oxford University Press

Linguistic Regions of the Islamic World circa 900-1500

Caption

Islam in China, 9th-20th Centuries

Summary

This map illustrates the variety of linguistic regions that prevailed during the extension of the Muslim World.

As it rose in the Center of the World, the Muslim world rapidly built economic, linguistic, and cultural connections with parts of Europe, Asia and Africa.

Legend indicates:

  • Islamic influence
  • Semitic
  • Indo-European
  • Ural-Altaic (Turkic)
  • Dravidian
  • Hamitic
  • Malay
  • Sinitic
  • Bantu-Sudanese
  • Caucasian

Source

An Historical Atlas of Islam – Atlas Historique de l’Islam, Second Edition. Edited by Hugh Kennedy, Tuta sub Aegide Pallas 1683,
Brill, Leiden-Boston-Koeln, 2002, page 4.

Cartography by Marc Bel, Peter van der Donck.

Copyright

© 2002 Koninklijke Brill NV, The Netherlands. All rights reserved.

Series

This map is one in a series:


L’Interventionnisme Américain de L’Après-Guerre Froide

Caption

L’Interventionnisme Américain de L’Après-Guerre Froide
(American Intervention After the Cold War)

Summary

Color-coded map shows U.S. interventions in the world from 1989 to 1997, including troop dispatches, preventive military deployment, and the suspension of economic aid.

The map identifies the supporting partners of the U.S. in its international operations, such as N.A.T.O. It also indicates the nature of the American interventions, such as mediations towards peace negotiations, legislation regulating international commerce, pressures exerted on countries involved in drug trafficking, and negotiations towards disarming.

This is a copyrighted work. Its use on QED is under the “Fair Use” rule.

Source

Atlas des États-Unis – Les paradoxes de la puissance. By Philippe Lemarchand, ed Atlande et complexes, Bruxelles, 1997. (p. 91)

Copyright

© 1997 Philippe Lemarchand

Les Manifestations D’Antiaméricanisme

Caption

Les Manifestations D’Antiaméricanisme
(Manifestations of Americanism)

Summary

Color-coded map shows anti-American sentiment across the globe, and sources/sites of anti-American terrorism, vandalism, assassination and kidnappings, and protest from 1976 to 1997.

This is a copyrighted work. Its use on QED is under the “Fair Use” rule.

Source

Atlas des ɉtats-Unis – Les paradoxes de la puissance. By Philippe Lemarchand, ed Atlande et complexes, Bruxelles, 1997. (p. 205)

Copyright

© 1997 Philippe Lemarchand

Le Trafic Téléphonique International Vers les États-Unis

Caption

Le Trafic Téléphonique International Vers les ɉtats-Unis
(International Phone Calls to the United States)

Summary

Color-coded map shows percentages of international phone traffic to the U.S. in the late 1990s.

This is a copyrighted work. Its use on QED is under the “Fair Use” rule.

Source

Atlas Des ɉtats-Unis – Les paradoxes de la puissance. By Philippe Lemarchand, ed Atlande et complexes, Bruxelles, 1997. (p. 199)

Copyright

© 1997 Philippe Lemarchand

Les Forces Américaines à Travers le Monde 1985-1998

Caption

Les Forces Américaines à Travers le Monde
(American Military Forces Across the World)

Summary

Color-coded map shows American forces stations around the world (by location and numbers), from 1985 to 1998.

This is a copyrighted work. Its use on QED is under the “Fair Use” rule.

Source

Atlas des ɉtats-Unis – Les paradoxes de la puissance. By Philippe Lemarchand, ed Atlande et complexes, Bruxelles, 1997. (p. 185)

Copyright

© 1997 Philippe Lemarchand

Les Images Américaines

Caption

Les Images Américaines
(American Images)

Summary

Color-coded map shows entertainment exportation: percentages of imported feature films from the U.S. by country, and countries where Superbowl is transmitted in the late 1990s.

This is a copyrighted work. Its use on QED is under the “Fair Use” rule.

Source

Atlas des ɉtats-Unis – Les paradoxes de la puissance. By Philippe Lemarchand, ed Atlande et complexes, Bruxelles, 1997. (p. 197)

Copyright

© 1997 Philippe Lemarchand

Le Monde Vu Des États-Unis

Caption

Le Monde Vu Des ɉtats-Unis
(The World as seen from the United States)

Summary

Color-coded map shows world alliances and regional (geographic) blocks from US perspective, by country in the late 1990s. It also indicates the main orientations or goals of the American foreign politics in each region, such as free exchange, democratization, economic take-off, oil safety, etc. It additionally describes the regional risks as envisioned by the U.S., such as nuclear proliferation, ethnic conflicts, the islamic factor, disease epidemics, and economic competition.

This is a copyrighted work. Its use on QED is under the “Fair Use” rule.

Source

Atlas Des ɉtats-Unis – Les paradoxes de la puissance. By Philippe Lemarchand, ed Atlande et complexes, Bruxelles, 1997. (p. 90)

Copyright

© 1997 Philippe Lemarchand

Le Poids du Marché Américain

Caption

Le Poids du Marché Américain
(The Importance of the American Market)

Summary

Color-coded map shows origin and percentages of imports to the U.S. from Asia, the Americas and the European Union in the late 1990s.

This is a copyrighted work. Its use on QED is under the “Fair Use” rule.

Source

Atlas des ɉtats-Unis – Les paradoxes de la puissance. By Philippe Lemarchand, ed Atlande et complexes, Bruxelles, 1997. (p. 180)

Copyright

© 1997 Philippe Lemarchand

Latin America in 1830

Caption

Latin America in 1830

Summary

“By 1830, Latin America had been liberated from European government. This map shows the initial borders of the states of the region, with the dates of their independence. The United Provinces of La Plata formed the nucleus of what later became Argentina.” [book].

Source

Donald Kagan et al. The Western Heritage Since 1300. (p. 720)

Prentice Hall [Pearson]

Copyright

© 2004 Prentice Hall [Pearson]

L’Attractivité Universitaire Américaine

Caption

L’Attractivité Universitaire Américaine
(The Attraction of American Universities)

Summary

Color-coded map shows percentages of students educated in US by country of origin in the late 90s.

This is a copyrighted work. Its use on QED is under the “Fair Use” rule.

Source

Atlas des États-Unis – Les paradoxes de la puissance. By Philippe Lemarchand, ed Atlande et complexes, Bruxelles, 1997. (p. 195)

Copyright

© 1997 Philippe Lemarchand

La Terre Promise

Caption

La Terre Promise
(The Promised Land)

Summary

Color-coded map shows immigration to the United States by country. Map also offers pie charts about global immigration to the U.S. by continent or region, main origin of clandestine/illegal immigration to US, and immigrants sent back to country of origin in 1992 and 1995 by percentages.

This is a copyrighted work. Its use on QED is under the “Fair Use” rule.

Source

Atlas des ɉtats-Unis – Les paradoxes de la puissance. By Philippe Lemarchand, ed Atlande et complexes, Bruxelles, 1997. (p. 203)

Copyright

© 1997 Philippe Lemarchand

L’Anglais dans le Monde

Caption

L’Anglais dans le Monde
(English in the World)

Summary

Color-coded map shows percentages of the population who speak English comparing countries with English as official language and non-anglophone countries in the late 1990s.

This is a copyrighted work. Its use on QED is under the “Fair Use” rule.

Source

Atlas des ɉtats-Unis – Les paradoxes de la puissance. By Philippe Lemarchand, ed Atlande et complexes, Bruxelles, 1997. (p. 193)

Copyright

© 1997 Philippe Lemarchand

Land Route of India in the First – Second Centuries AD

Caption

Land Route of India in the First – Second Centuries AD

Summary

Map shows trade relations between the Harappan cities, parts of Mesopotamia, Central Asia and Egypt.

Source

Indo-Roman Trade

By Ajoy Kumar Singh.

Commonwealth Publishers, New Delhi – 110002, India.
Published by Janaki Prakashan For. Printed at: Gaurav Printers, Maujpur, Delhi – 110053, India.

Copyright

Ajoy Kumar Singh, 1988

L’Aide Américaine

Caption

L’Aide Américaine
(American Aid)

Summary

Color-coded map shows American aid in millions of dollars by country, and the distribution of aid by region (see pie chart) in the late 1990s.

This is a copyrighted work. Its use on QED is under the “Fair Use” rule.

Source

Atlas des ɉtats-Unis – Les paradoxes de la puissance. By Philippe Lemarchand, ed Atlande et complexes, Bruxelles, 1997. (p. 171)

Copyright

© 1997 Philippe Lemarchand

Landmarks in the Development of the World Council of Churches, 1910-1968

Caption

Landmarks in the Development of the World Council of Churches

Summary

Map shows important sites and dates of meetings in the development of the World Council of Churches. It also shows meeting points of the International Missionary Council Assemblies.
This is a copyrighted work. Its use on QED is under the “Fair Use” rule..

Source

Atlas of Man and Religion (pp. 126-127)

By Gordon K. Hawes, The Religious Education Press, a member of the Pergamon Group, Oxford, 1970. Layout and maps by Stanley Knight R. R. G. S.

Copyright

© 1970 Gordon K. Hawes & Stanley Knight