Category Archives: Restricted

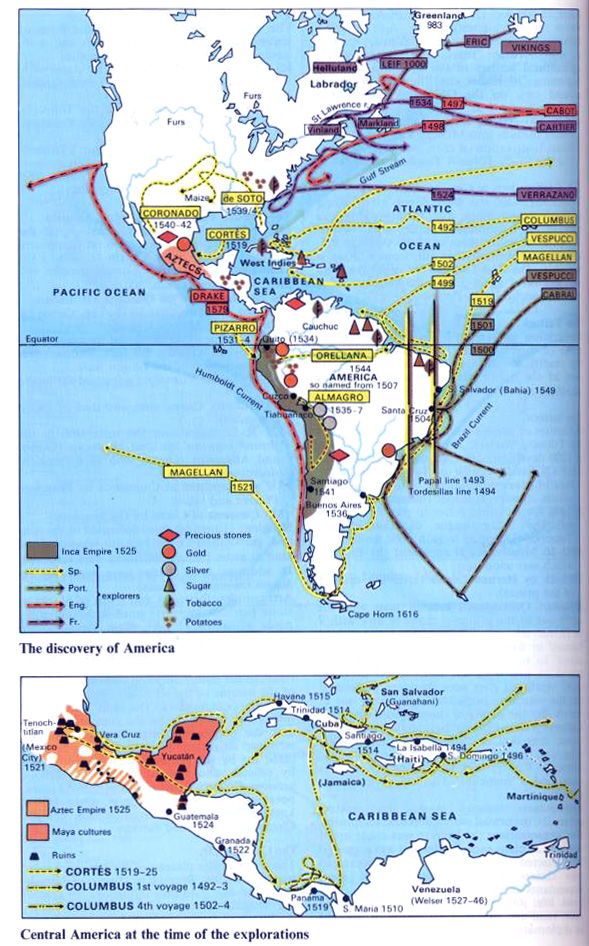
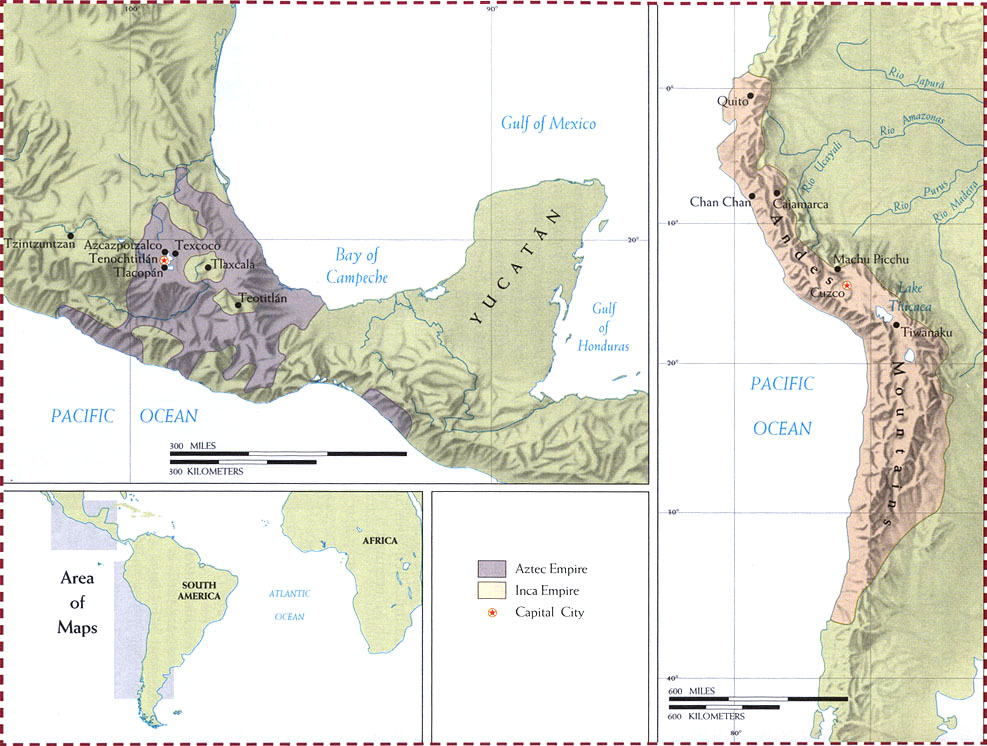
The Discovery of America and Central America at Time of the Explorations

Caption

The Discovery of America, Central America at Time of the Explorations

Summary

Routes of exploration and location of natural resources in North and South America at the time of discovery (1492-1616);Central America explorers and empires.

Source

The Penguin Atlas of World History Vol. 1 (p. 224)

Copyright

© May 25, 2004 Penguin

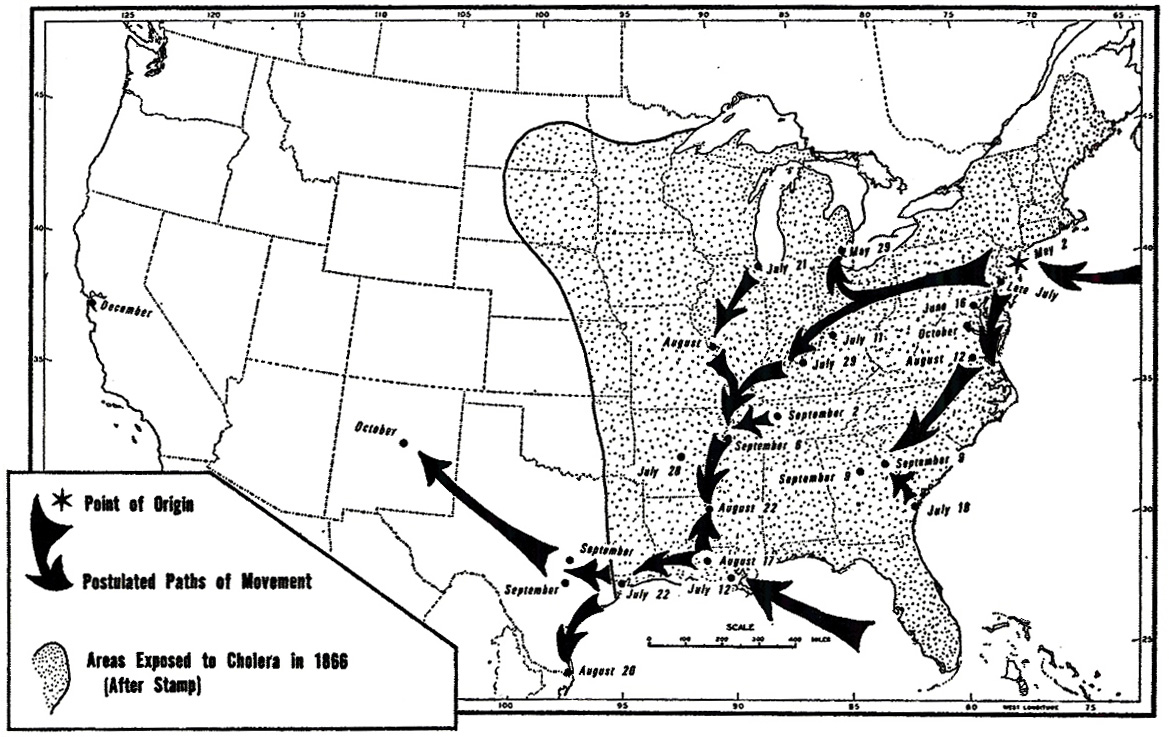
The Diffusion of Cholera in the United States in 1866

Caption

The Diffusion of Cholera in the United States in 1866

Summary

This map depicts “the diffusion of cholera in the United States in 1866 showing the
growing effect of the maturing transport system (river, rail, and sail) on the diffusion of this disease compared to the 1832 epidemic.” (Koch, p. 259)

In 1832, cholera typically entered the U.S. from northeastern seaports and from Canada, and then traveled down the east coast or west along the Erie Canal and then down the Mississippi. By 1866, New Orleans was also a point of entry, and the disease traveled by both rail and river systems along the lines of the transportation network linking major cities.

Source

The image was scanned from Fig 10.6 in Tom Koch (2005). Cartographies of Disease. ESRI Press, Redlands, California.

The image was published in Pyle, G.F (1969). “The Diffusion of Cholera in the United States in the Nineteenth Century.” Geographic Analysis 1 (1): 59-75.

Copyright status

Copyright © 1969 by the Ohio State University Press.

All rights reserved

Collection


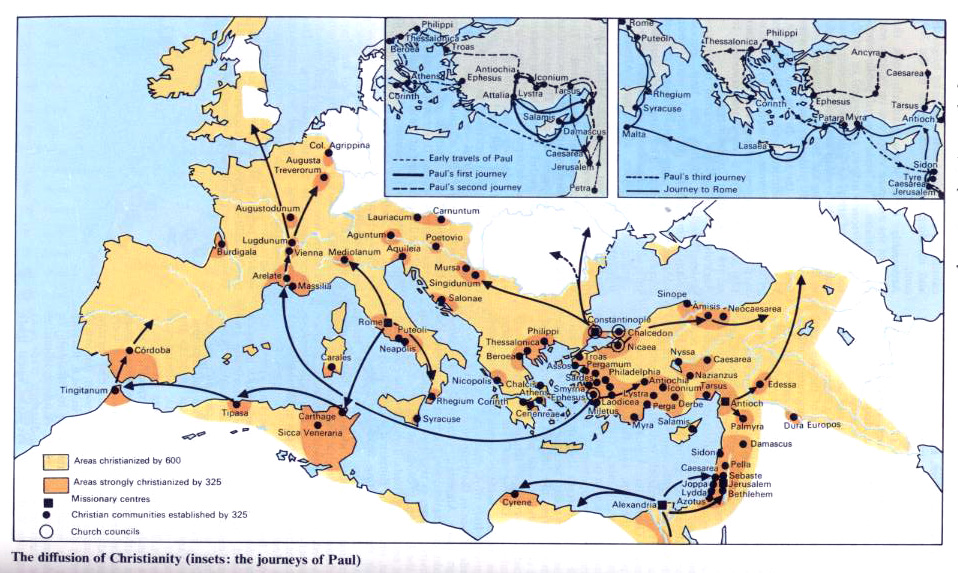
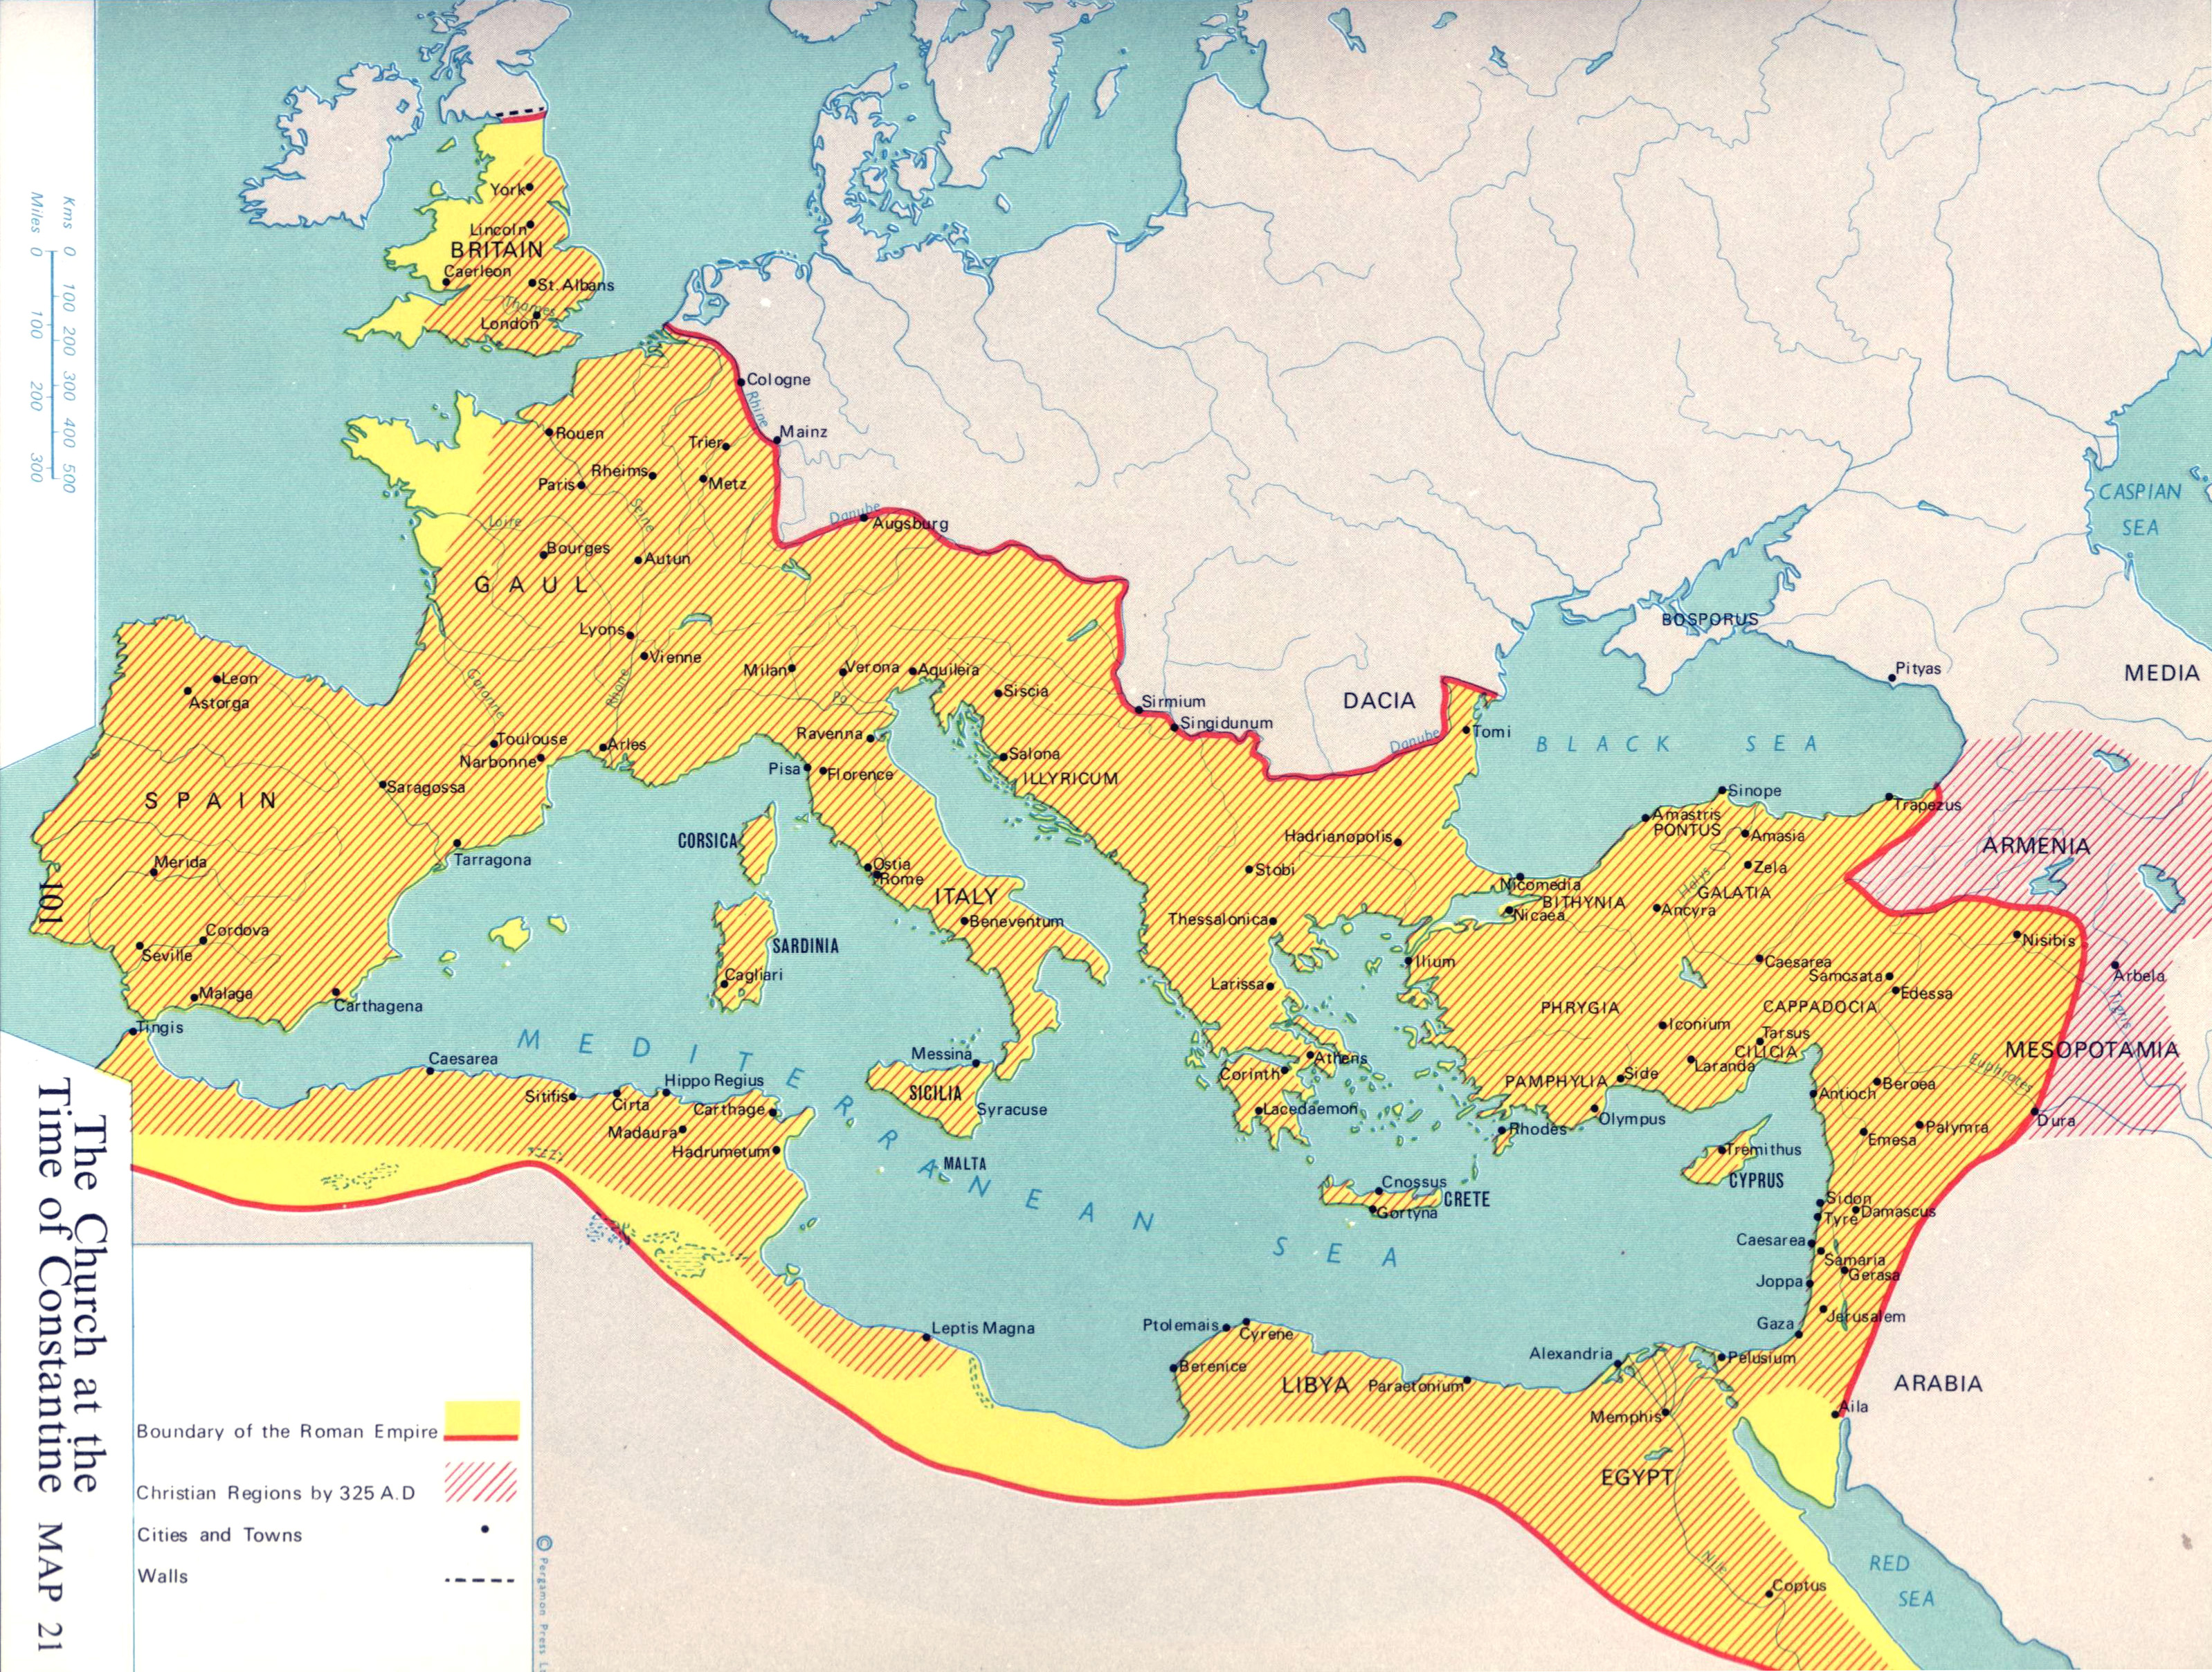
The Church at the Time of Constantine

Caption

The Church at the Time of Constantine

Summary

Map shows the extent of the Roman empire, Christian territories, and major cities, towns, and walls by 325 A.D.
This is a copyrighted work. Its use on QED is under the “Fair Use” rule..

Source

Atlas of Man and Religion (p. 101)

By Gordon K. Hawes, The Religious Education Press, a member of the Pergamon Group, Oxford, 1970. Layout and maps by Stanley Knight R. R. G. S.

Copyright

© 1970 Gordon K. Hawes & Stanley Knight

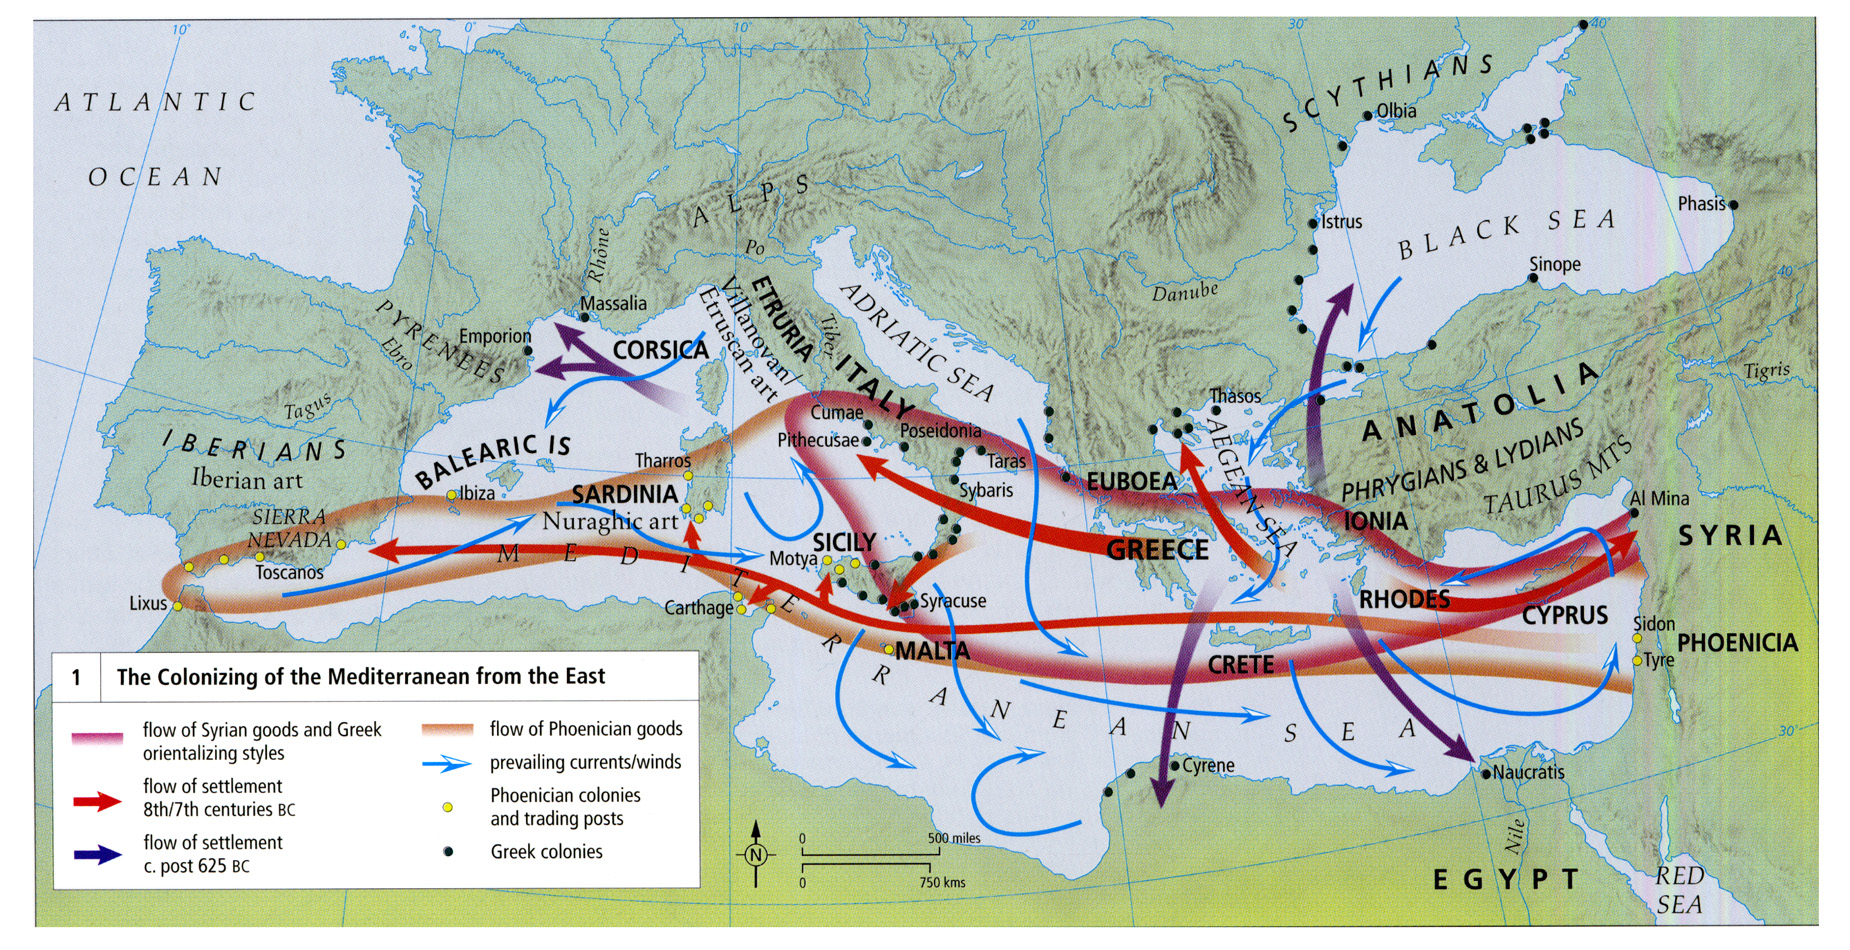
The Colonizing of the Mediterranean from the East, 625 BC

Caption

The Colonizing of the Mediterranean from the East, 625 BC

Summary

This map follows the flow of settlements in the Mediterranean in 8th and 7th centuries BC. Dotted on the map are indications of Phoenician and Greek colonies and trading posts, which correlate with the reach of Phoenician and Syrian goods, as well as the Greek orientalizing styles. The Phoenicians Phoenicians were major traders during this time, with trading posts all over the Mediterranean, carrying with them the culture of each individual Mediterranean empire, from the Egyptians to the Greeks. .

Source

Atlas of World Art (p. 34)
Oxford University Press

Copyright

© 2004 Laurance King Publishing

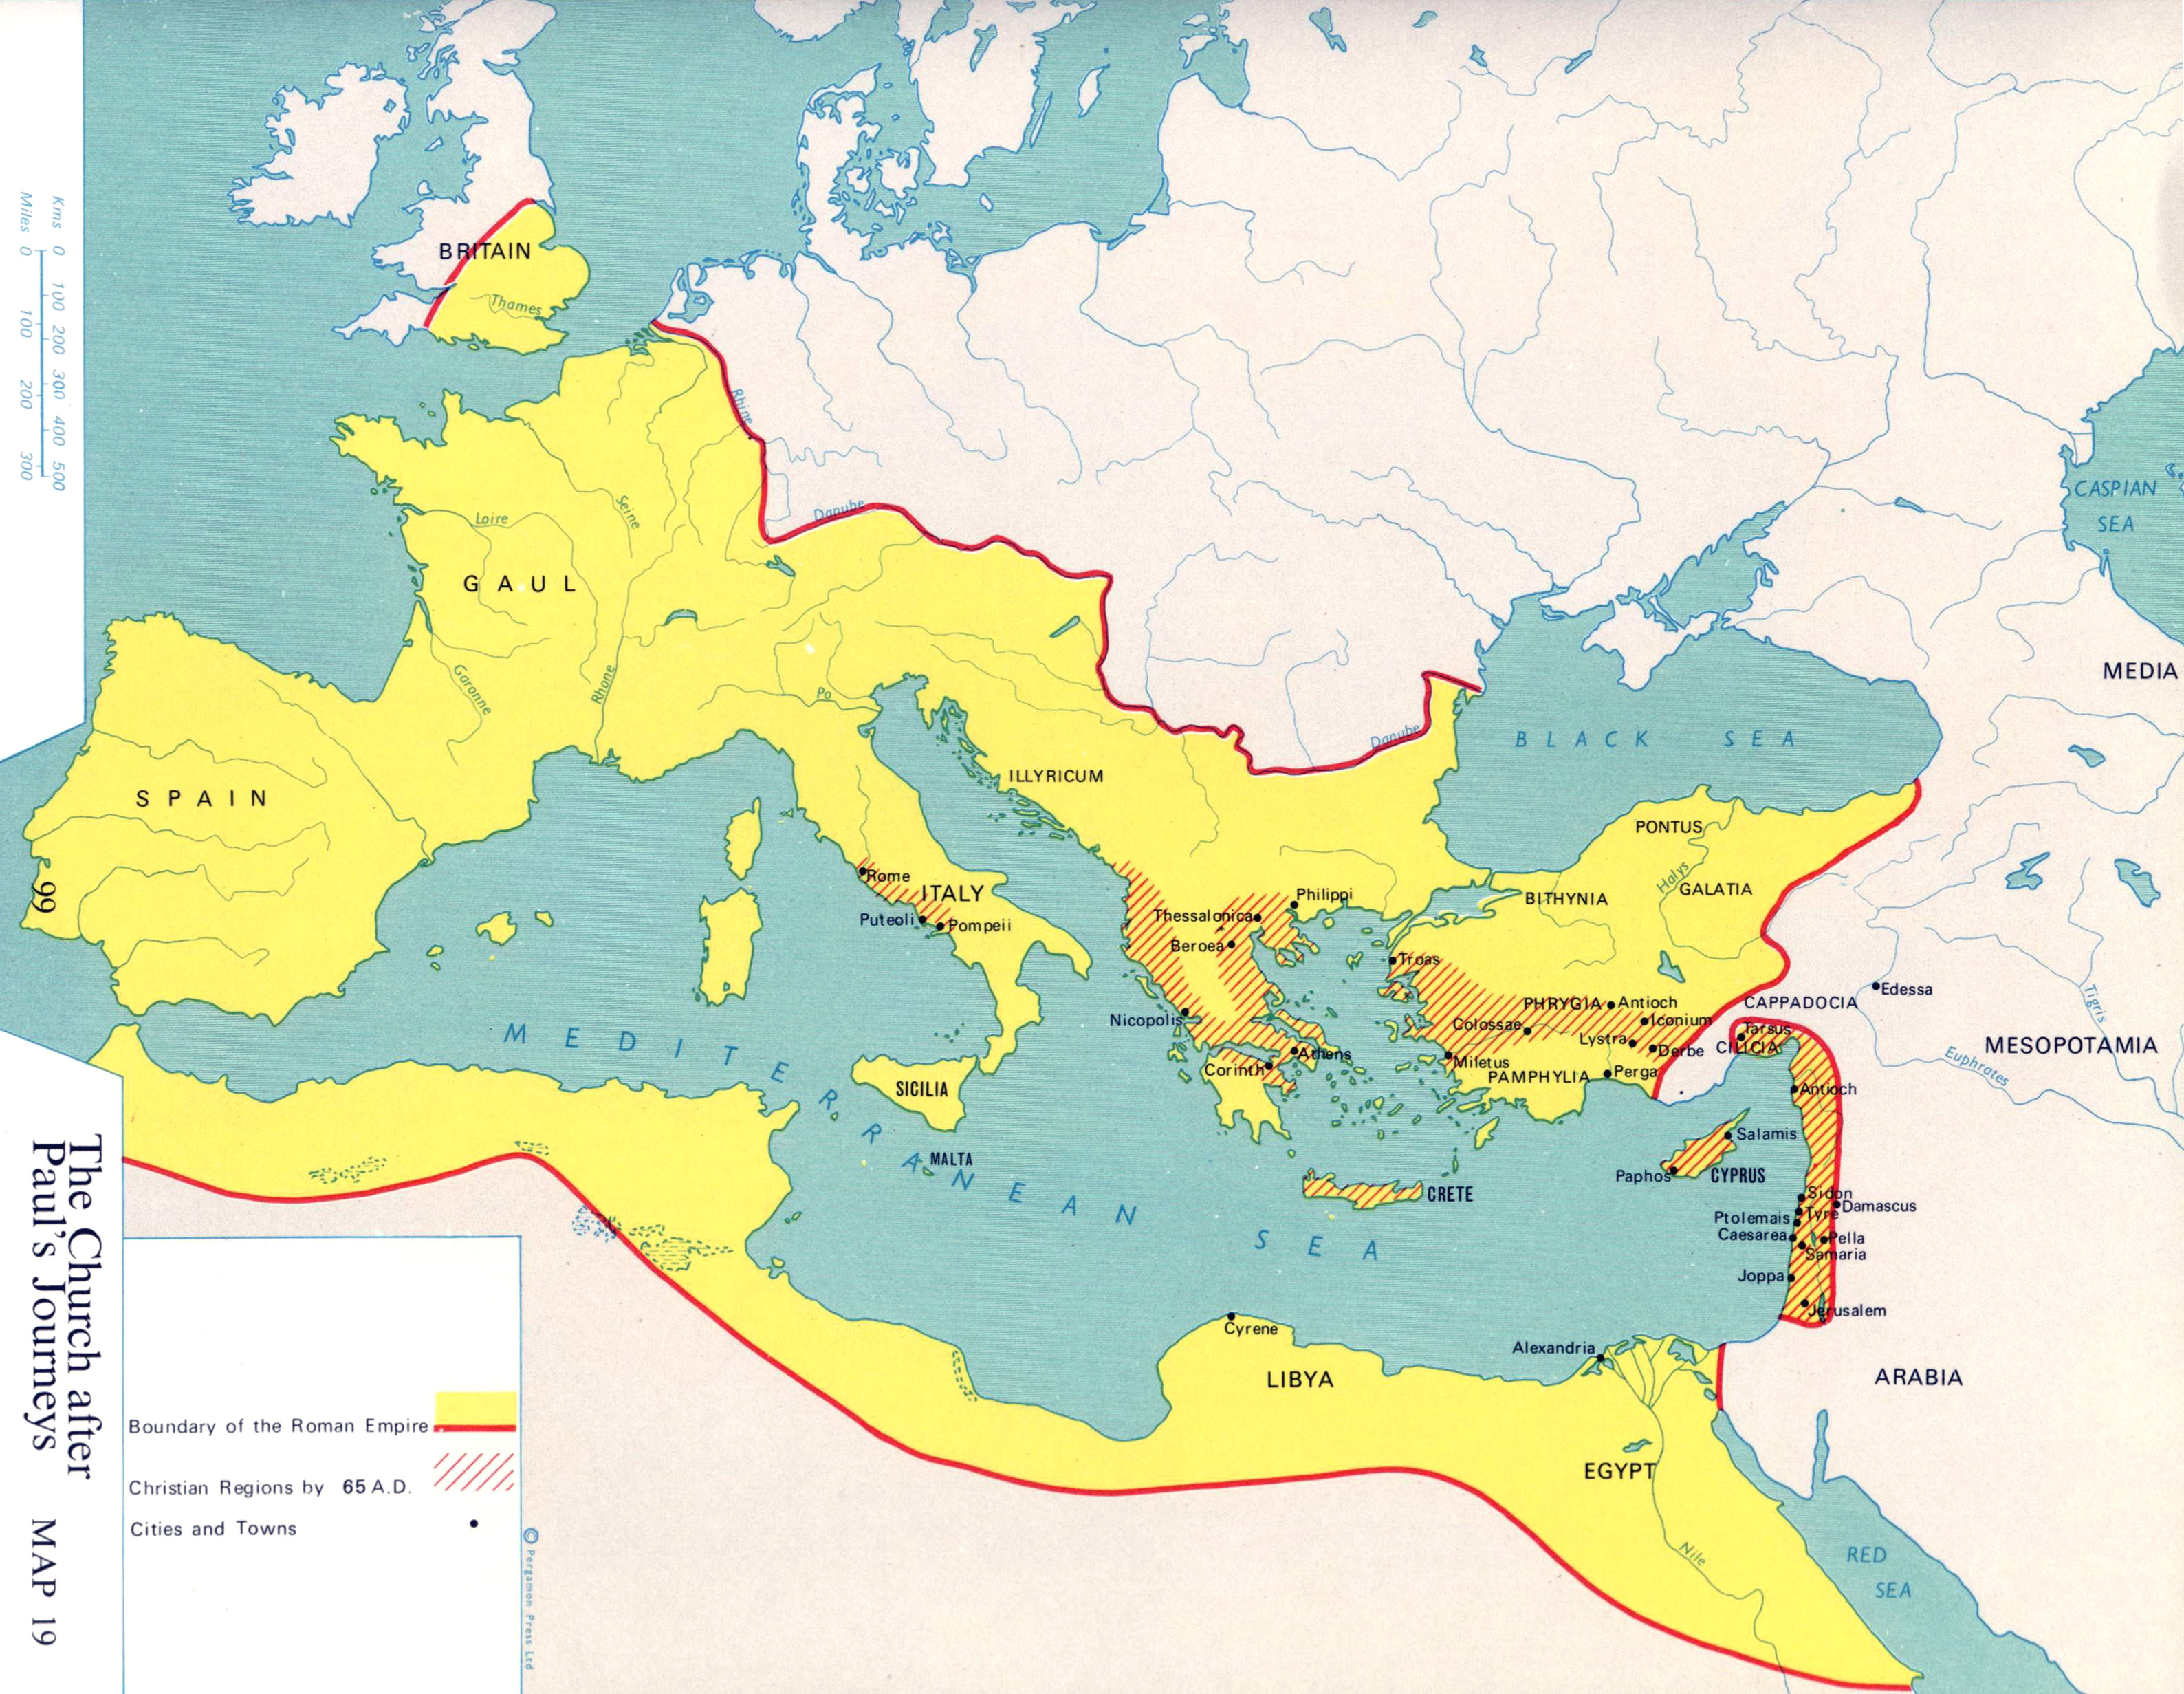
The Church after Paul’s Journeys

Caption

The Church after Paul’s Journeys

Summary

Map shows the extent of the Roman empire, Christian territories, and major cities and towns by 65 A.D.
This is a copyrighted work. Its use on QED is under the “Fair Use” rule..

Source

Atlas of Man and Religion (p. 99)

By Gordon K. Hawes, The Religious Education Press, a member of the Pergamon Group, Oxford, 1970. Layout and maps by Stanley Knight R. R. G. S.

Copyright

© 1970 Gordon K. Hawes & Stanley Knight

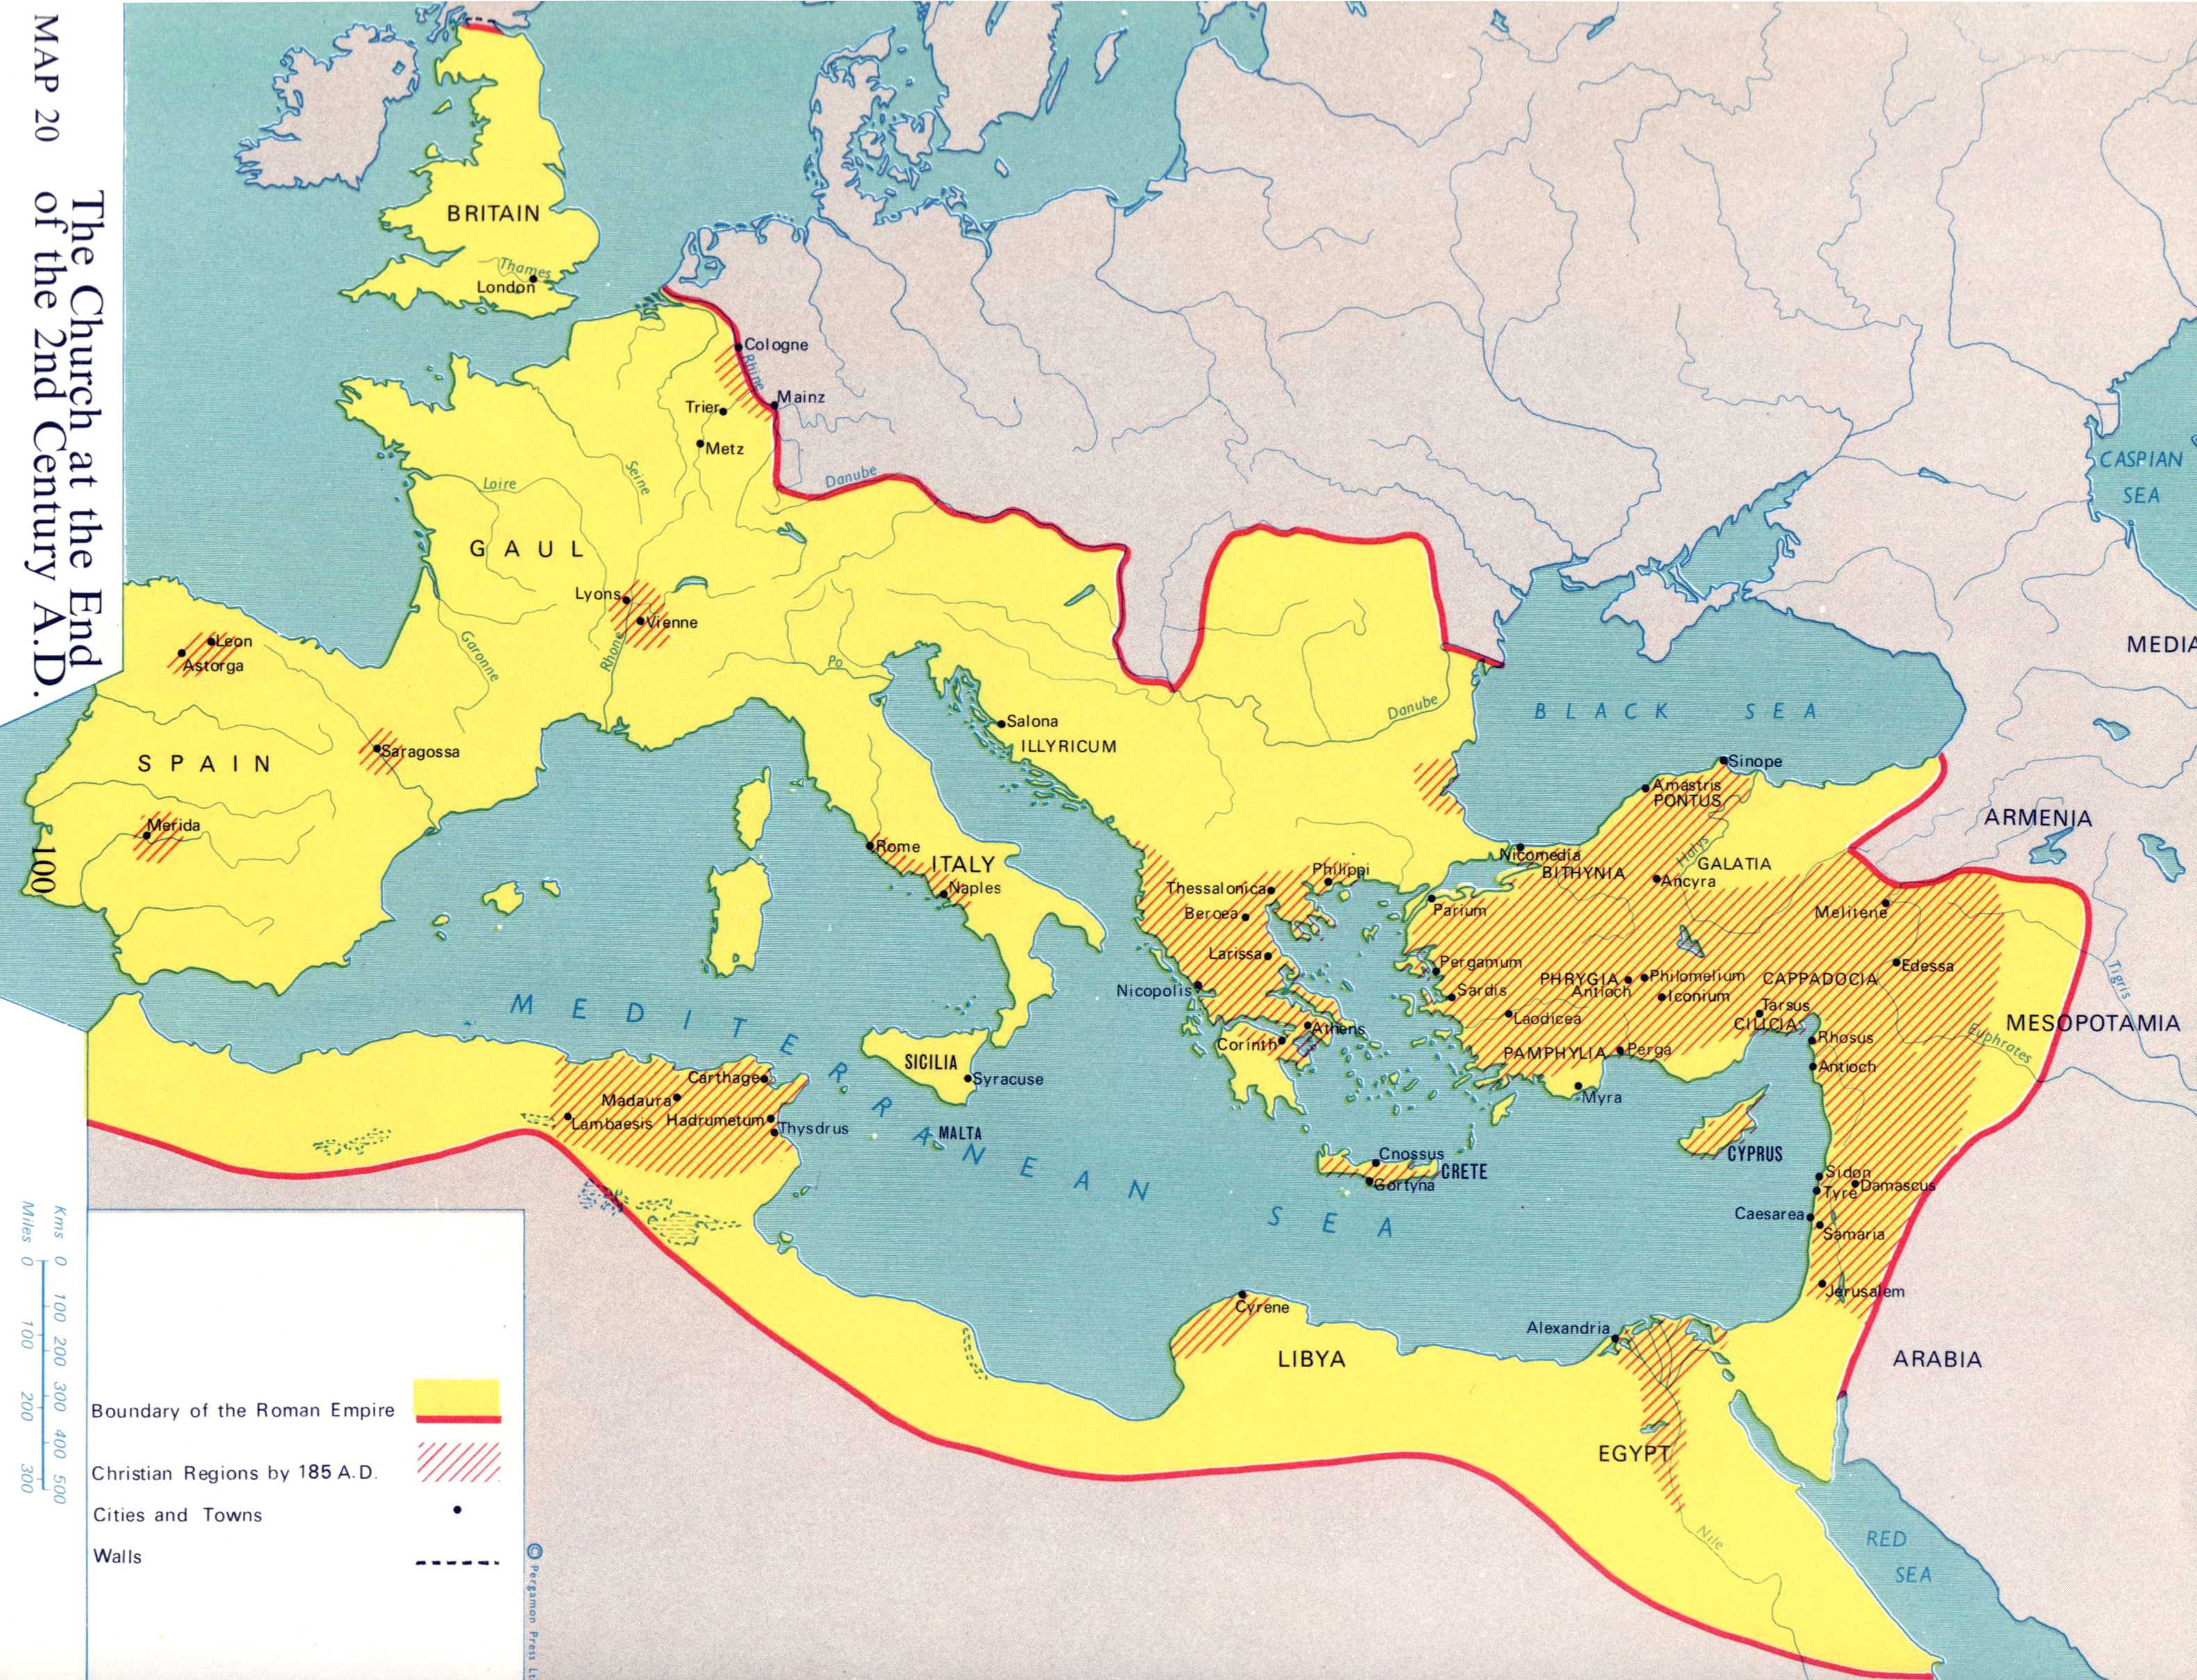
The Church at the End of the 2nd Century A.D

Caption

The Church at the End of the 2nd Century A.D.

Summary

Map shows the extent of the Roman empire, Christian territories, and major cities, towns, and walls by 185 A.D.
This is a copyrighted work. Its use on QED is under the “Fair Use” rule..

Source

Atlas of Man and Religion (p. 100)

By Gordon K. Hawes, The Religious Education Press, a member of the Pergamon Group, Oxford, 1970. Layout and maps by Stanley Knight R. R. G. S.

Copyright

© 1970 Gordon K. Hawes & Stanley Knight

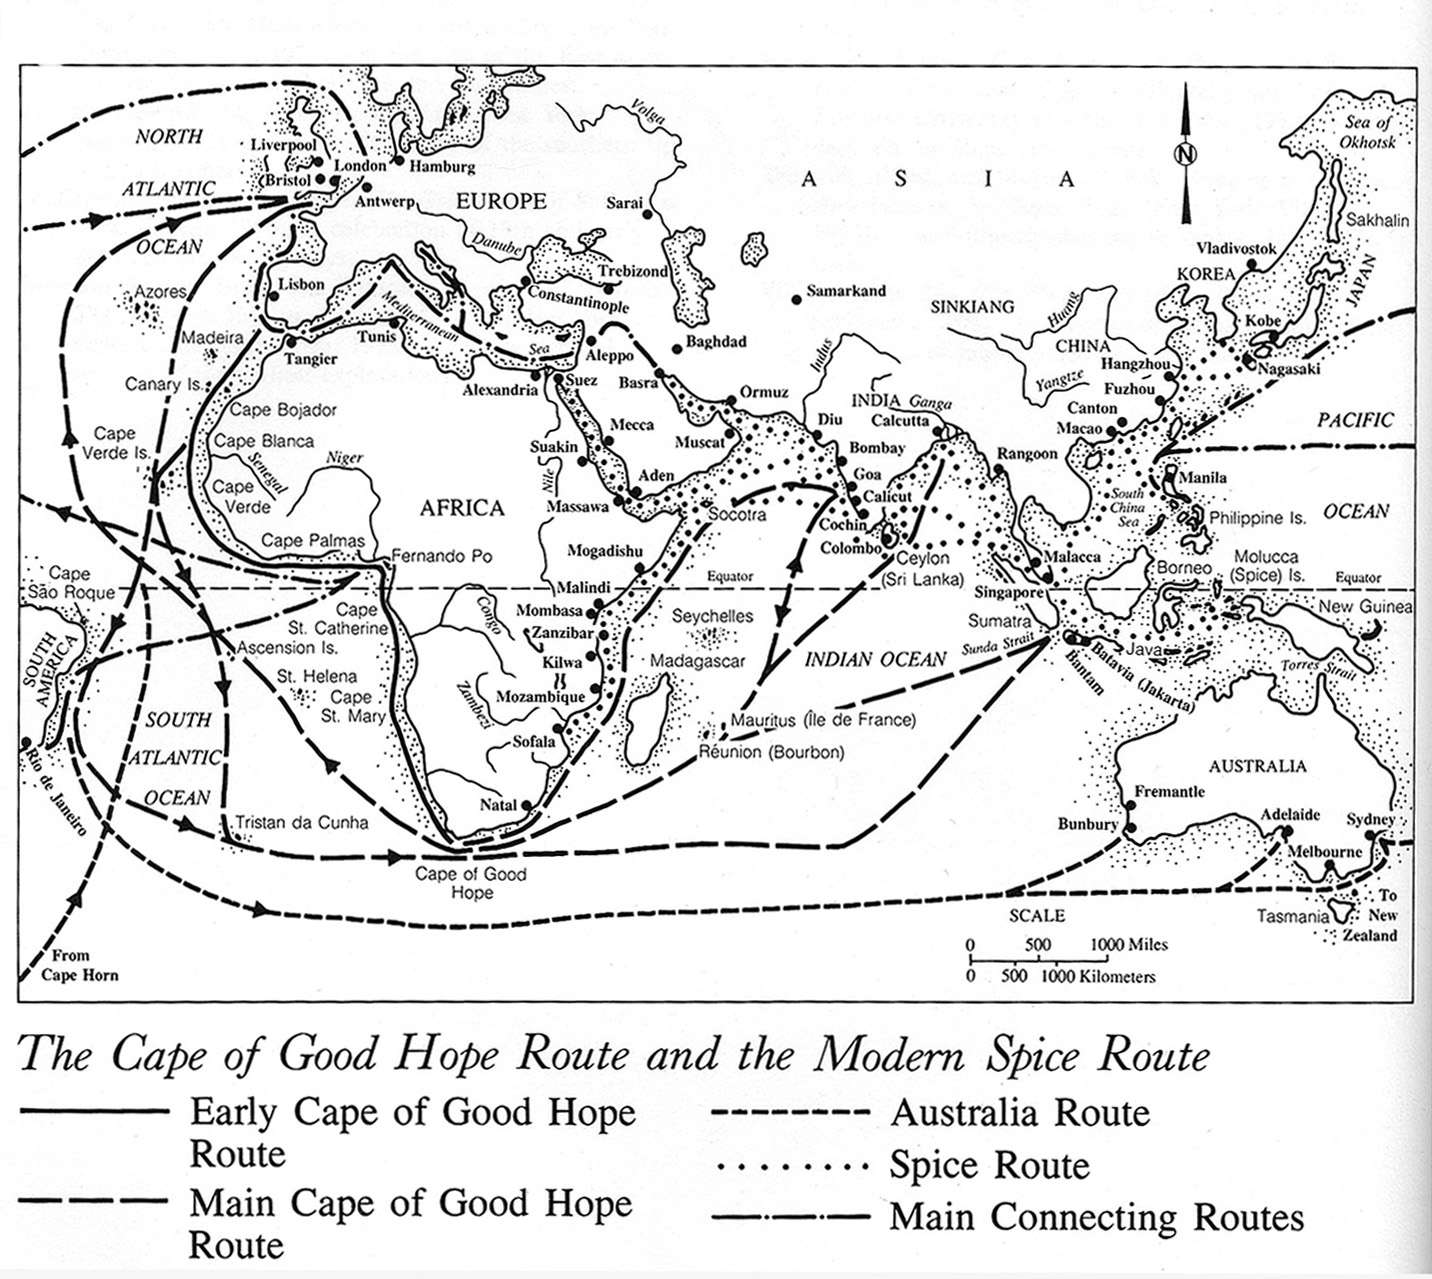
The Cape of Good Hope Route and the Modern Spice Route

Caption

The Cape of Good Hope Route and the Modern Spice Route

Summary

Map shows the Early and Late Cape of Good Hope Routes and the Spice Route. It also indicates the Australia Route and the Main Connecting Routes.

Source

To the Ends of the Earth: The Great Travel and Trade Routes of Human History (p. 76)

Facts on File Publications, New York and Oxford, 1984.

Copyright

Irene M. Franck and David M. Brownstone.

This is a copyrighted work. Its use on QED is under the “Fair Use” rule.

The Chinese in the World Today

Caption

The Chinese in the World Today

Summary

Map shows main regions of contemporary Chinese immigration, and their main communities.

Source

The Penguin Atlas of Diasporas. By Gerard Chaliand and Jean-Pierre Rageau. Maps by Catherine Petit. Penguin Books U.S.A. Inc., 1995. (p. 143)

Copyright

Gerard Chaliand and Jean-Pierre Rageau

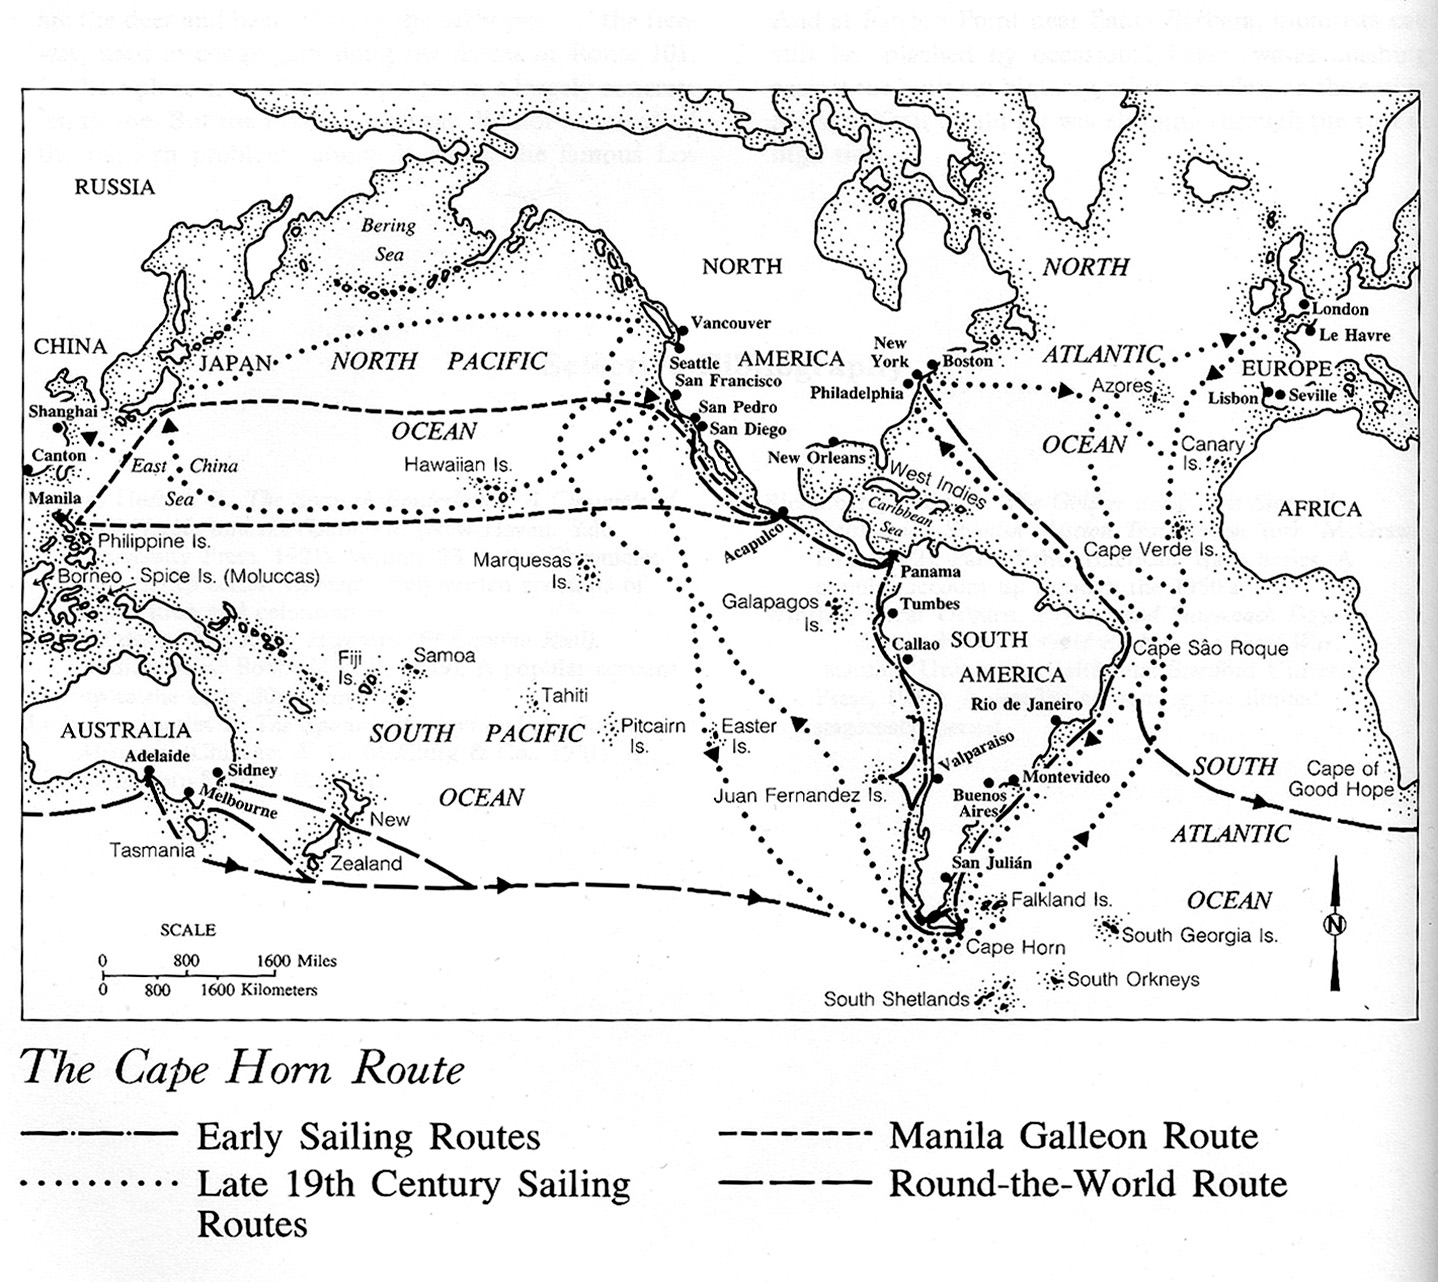
The Cape Horn Route

Caption

The Cape Horn Route

Summary

Map shows the Cape Horn Route in the Early Sailing Routes and the Late 19th Century Sailing Routes. It additionally shows the Manila Galleon and the Round-the-World Routes.

Source

To the Ends of the Earth: The Great Travel and Trade Routes of Human History (p. 62)

Facts on File Publications, New York and Oxford, 1984.

Copyright

Irene M. Franck and David M. Brownstone.

This is a copyrighted work. Its use on QED is under the “Fair Use” rule.

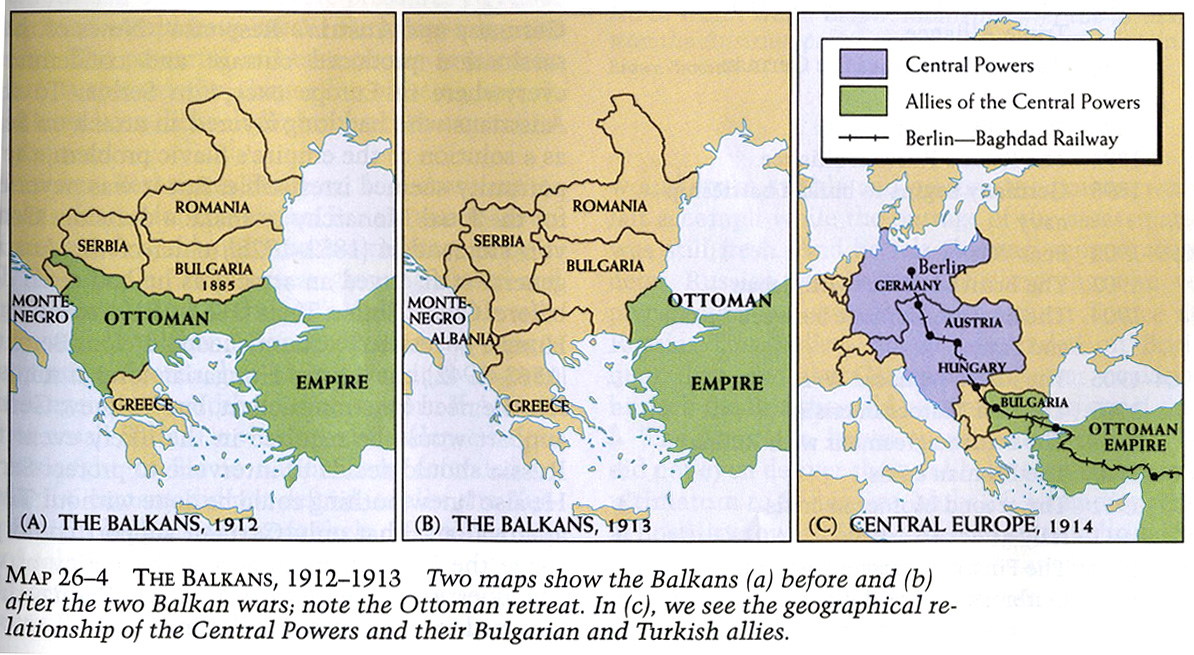
The Balkans 1912 – 1913

Caption

The Balkans, 1912 – 1913

Summary

“Two maps show the Balkans (a) before and (b) after the two Balkan wars; note the Ottoman retreat. In (c), we see the geographical relationship of the Central Powers and their Bulgarian and Turkish allies.” [book] Series of three time-changing maps of the Balkans.

Source

Donald Kagan et al. The Western Heritage Since 1300. (p. 899)

Prentice Hall [Pearson]

Copyright

© 2004 Prentice Hall [Pearson]

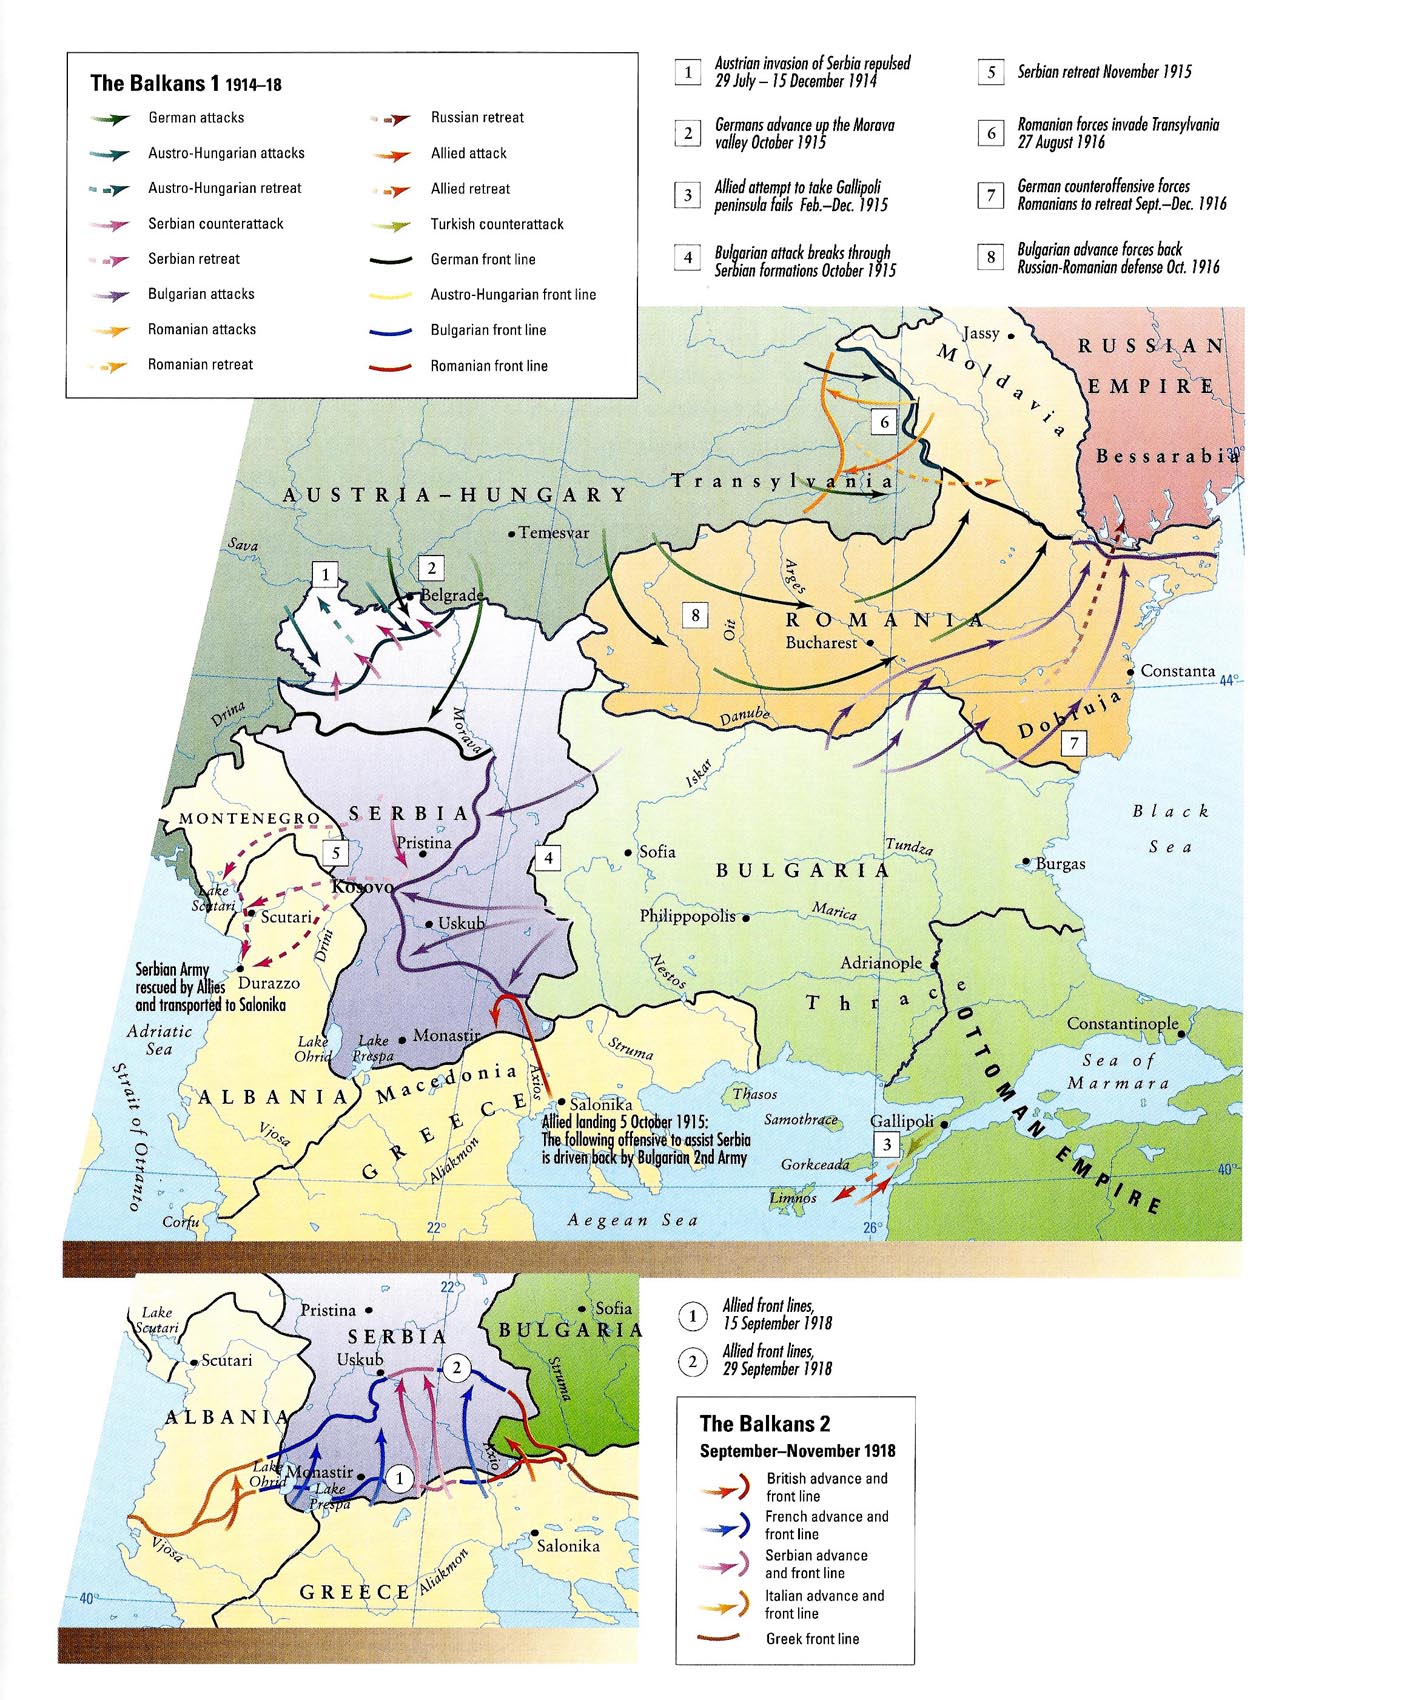
The Balkans 1914-1918

Caption

The Balkans 1914-1918

Summary

These two maps show military activity in the Balkans during World War One.

The maps depict attacks, counterattacks, retreats, advances, and the location of front lines. They also indicate the dates of the most important military events.

The second map focuses on the period from September to November 1918.

Source

Historical Atlas of the Islamic World (p. 113)

Copyright

Copyright © Oxford University Press, 2004

License

This map is used on this website by permission of Oxford University Press.

The license only allows it to be used in connection with SOC284 and WWS572B at Princeton University during the 2008-9 academic year.

The map appears in Malise Ruthven and Azim Nanji, Historical Atlas of the Islamic World (Oxford University Press, 2004).

The Atlantic Ocean – Maritime Shipping Routes

Caption

The Atlantic Ocean – Maritime Shipping Routes

Summary

Map shows Principal Shipping Routes in the Pacific Ocean with distances in nautical miles. Also indicates direction of currents. Map shape is Oval. Projection: Mollweide’s Homolographic.

Source

World Atlas of Shipping (pp. 94-95)

Copyright

George Philip & Son Ltd.

This is a copyrighted work. Its use on QED is under the “Fair Use” rule.

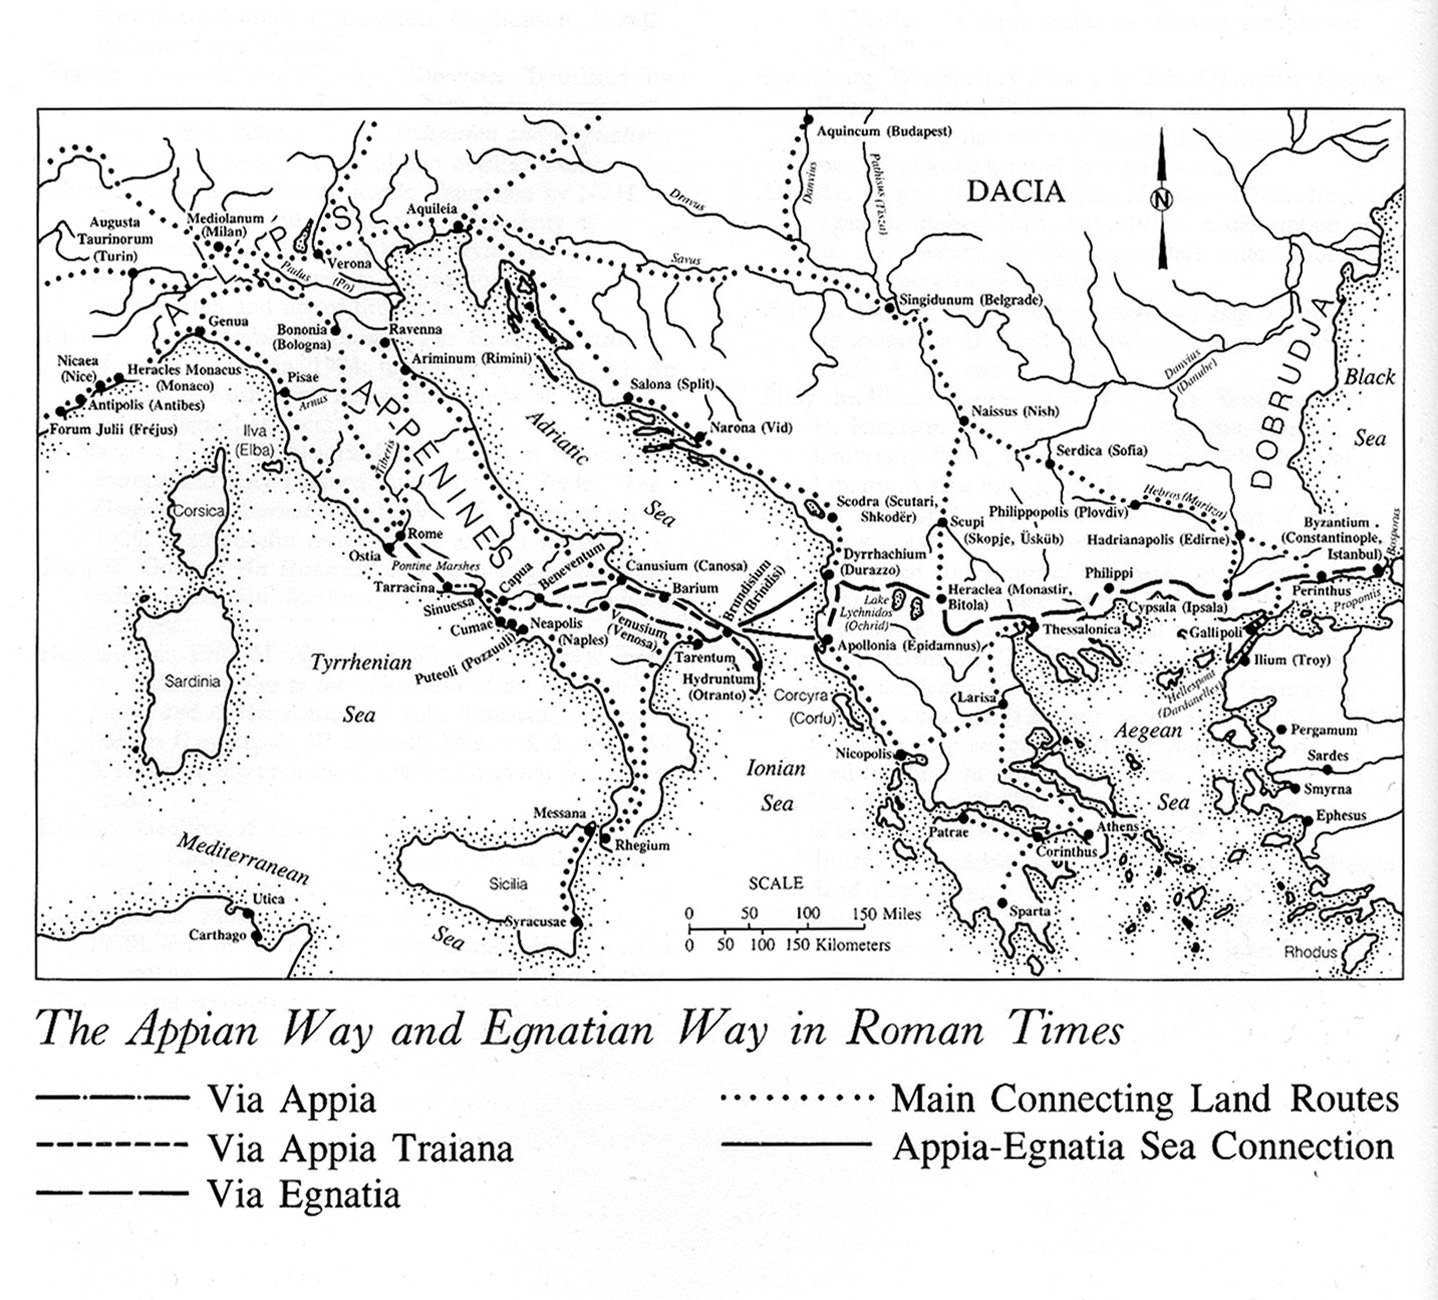
The Appian Way and the Egnatian Way in Roman Times

Caption

The Appian Way and the Egnatian Way in Roman Times

Summary

Map shows the Appian Way and Egnatian Way, their Sea connection, and the Main Connecting Land Routes in Roman Times.

Source

To the Ends of the Earth: The Great Travel and Trade Routes of Human History (p. 33)

Facts on File Publications, New York and Oxford, 1984.

Copyright

Irene M. Franck and David M. Brownstone.

This is a copyrighted work. Its use on QED is under the “Fair Use” rule.

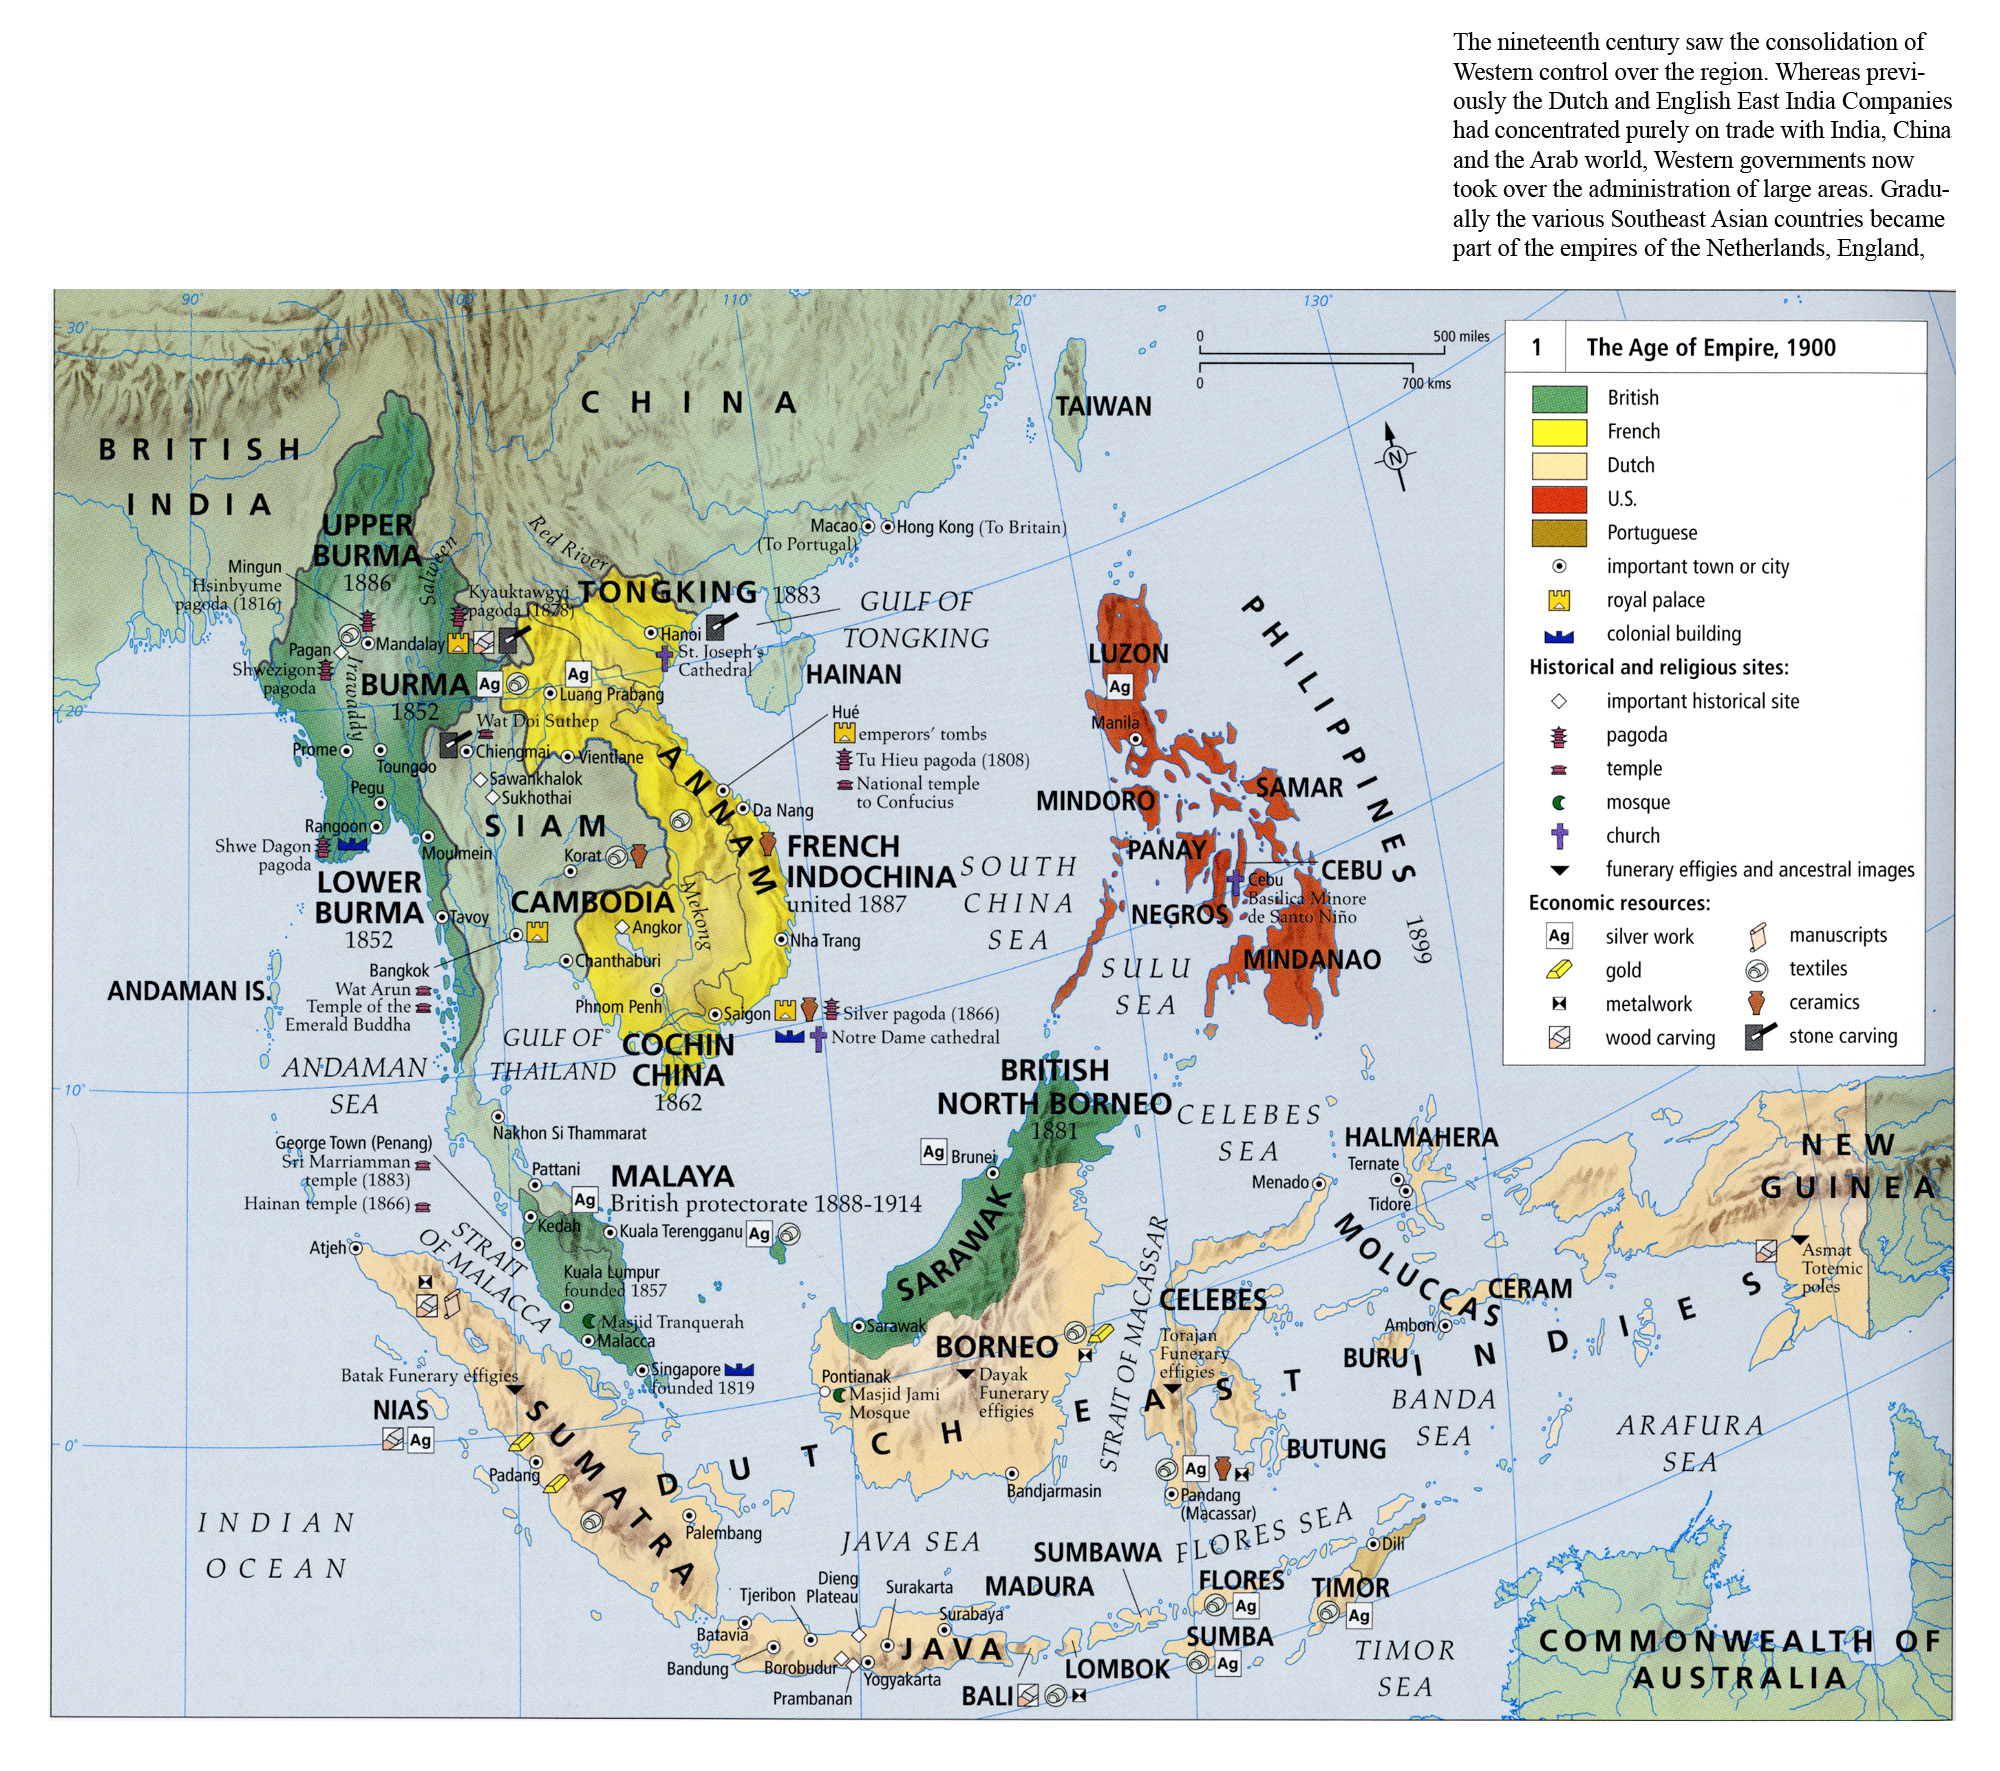
The Age of Empire in Southeast Asia, 1900

Caption

The Age of Empire in Southeast Asia, 1900

Summary

This map shows the extent of imperialism in Southeast Asia by 1900. The European powers took interest in this area for its economic resources, such as gold and ceramics.
Additionally noted on the map are locations of religious sites, such as temples and mosques, historical sites and royal palaces. Examples of European influence can be found in the changes in architecture instituted soon after European arrival. .

Source

Atlas of World Art (p. 254)
Oxford University Press

Copyright

© 2004 Laurance King Publishing

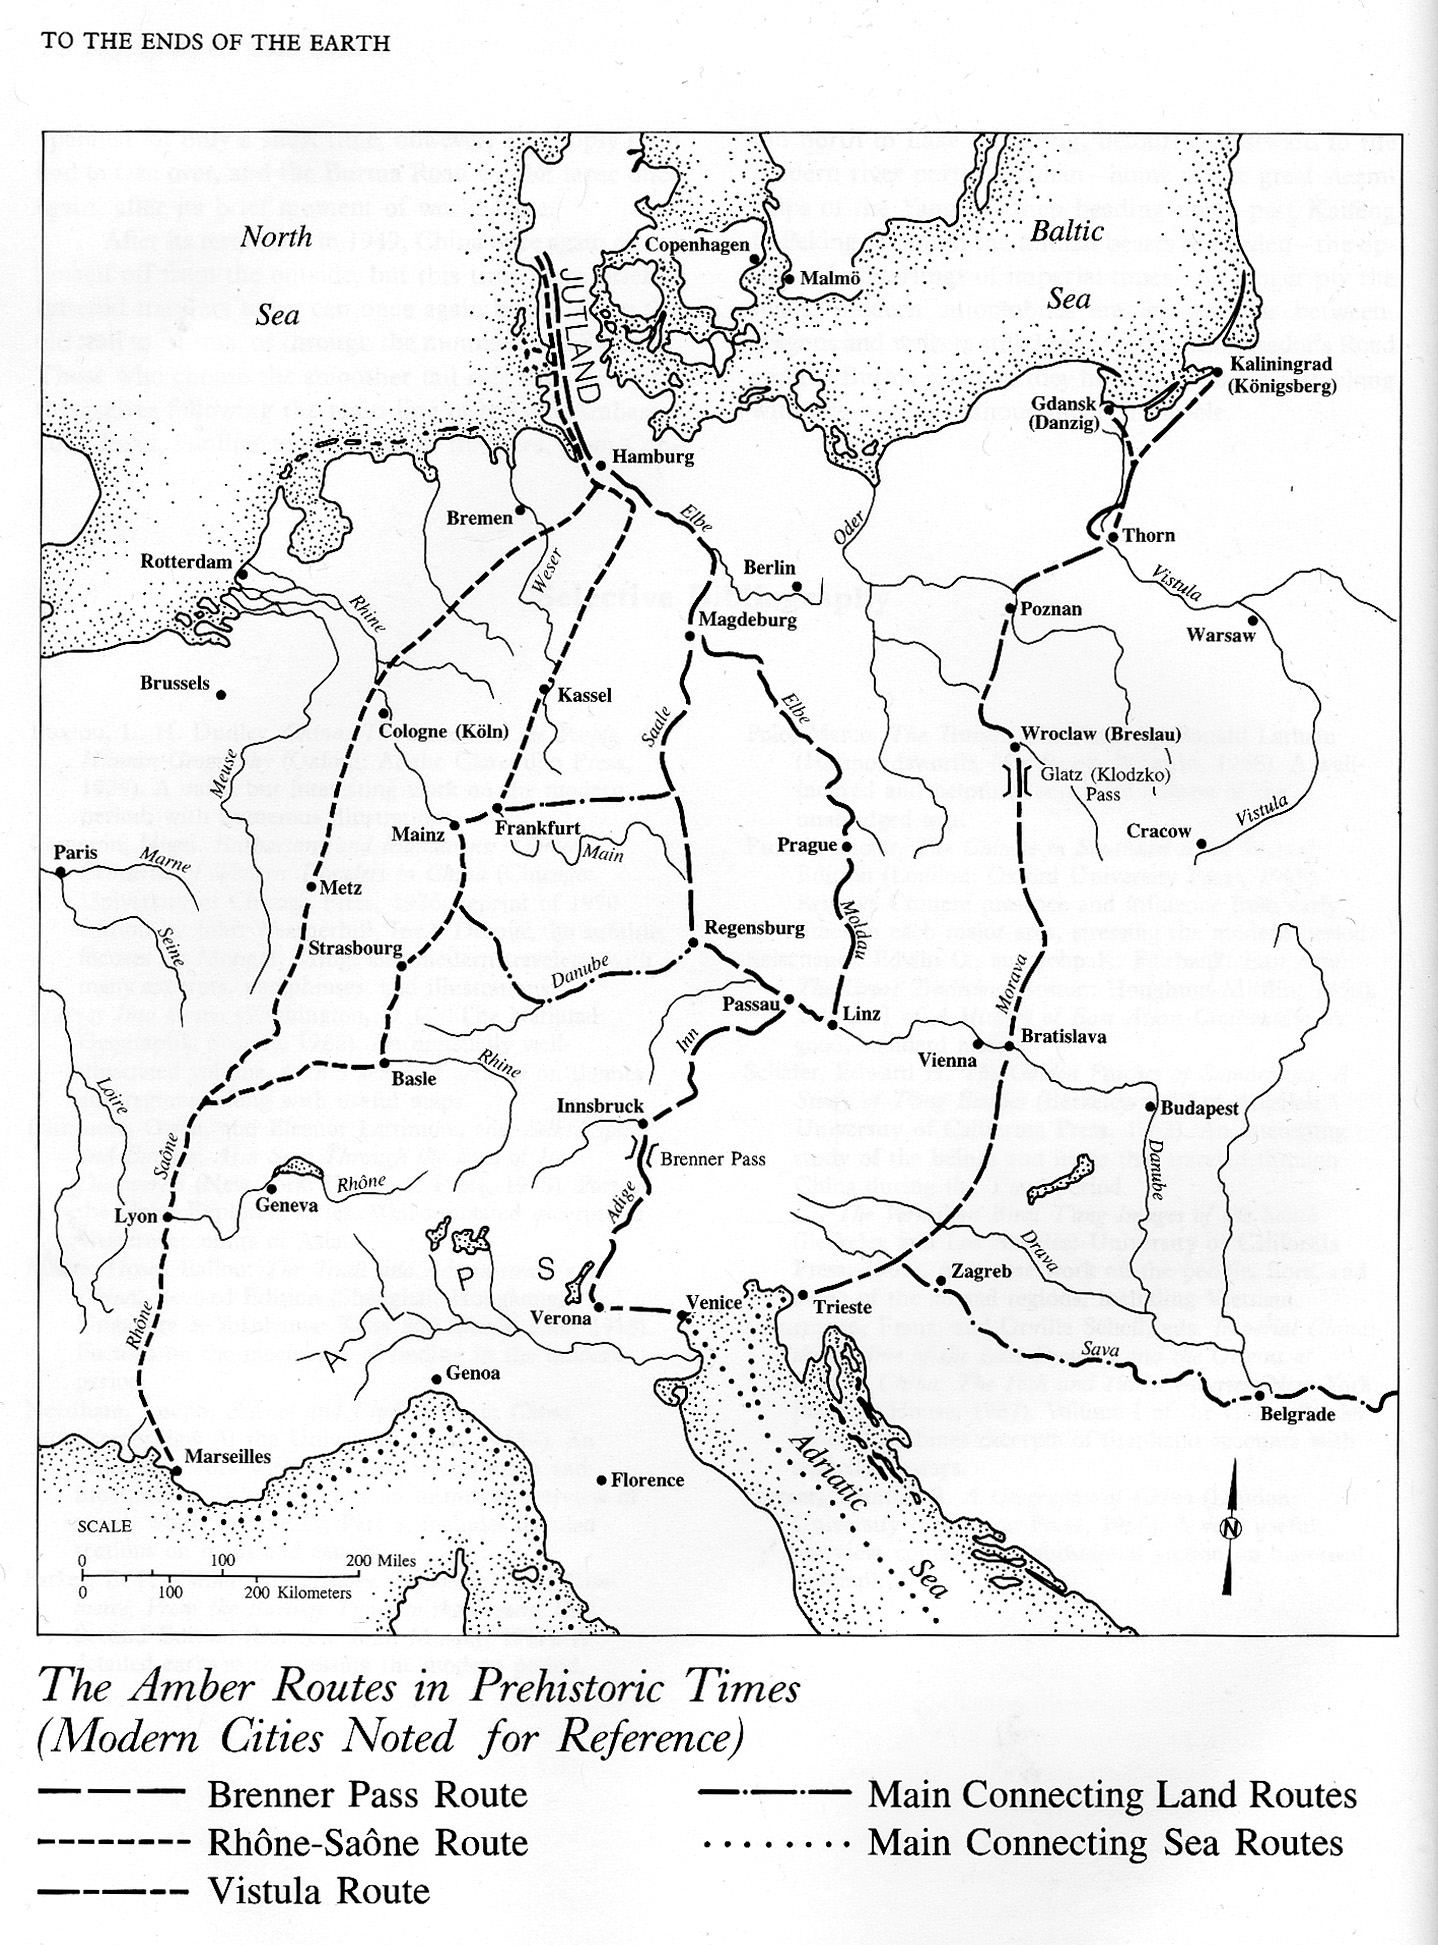
The Amber Routes in Prehistoric Times

Caption

The Amber Routes in Prehistoric Times

Summary

Map shows main land and sea amber routes in prehistoric times: the Brenner Pass route, the Rhône-Saône route, and the Vistula route.

Source

To the Ends of the Earth: The Great Travel and Trade Routes of Human History (p. 16)

Facts on File Publications, New York and Oxford, 1984.

Copyright

Irene M. Franck and David M. Brownstone.

This is a copyrighted work. Its use on QED is under the “Fair Use” rule.

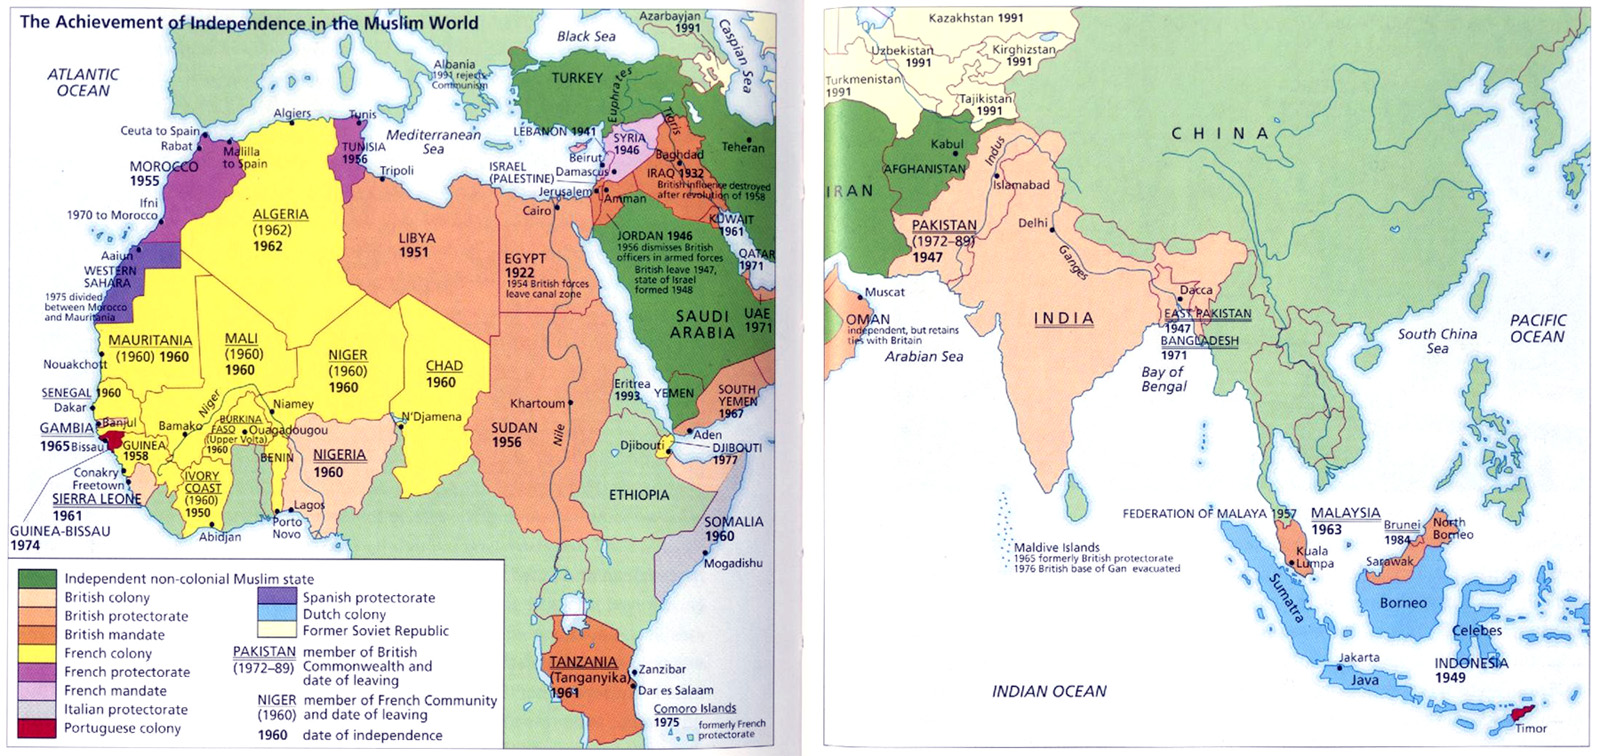
The Achievement of Independence in the Muslim World 1922-1984

Caption

The Achievement of Independence in the Muslim World

Summary

Color-coded map shows colonies achieving independence among predominantly Muslim countries.
This is a copyrighted work. Its use on QED is under the “Fair Use” rule..

Source

The Cambridge Illustrated History of the Islamic World (pp. 114-115)

F. Robinson, Atlas of the Islamic World since 1500, Oxford

Copyright

© 1982 F. Robinson, Atlas of the Islamic World since 1500, Oxford (pp. 158-159)

Terrorism, 1995-2003

Caption

Terrorist Attacks and Casualties by Region 1995-2003, and International Terrorist Incidents, 2003

Summary

World map with color-coding of countries by number of “International terrorist incidents”. Number of “Terrorist attacks and casualties by region”, and “Selected major terrorist incidents” are also included.

Inset legends narrate how and when attacks occurred for each region.

Source

National Geographic Atlas of the World, 8th Edition, 2004, page 17.
Published by the National Geographic Society.

Copyright

© 2005 National Geographic Society

Series

This map is one in a series:


Territorial Changes After World War II

Caption

Territorial Changes After World War II

Summary

“The map shows the shifts in territory following the defeat of the Axis. No treaty of peace formally ended the war with Germany.” [book] Maps depict post World War II boundaries and territorial changes.

Source

Donald Kagan et al. The Western Heritage Since 1300. (p. 1039)

Prentice Hall [Pearson]

Copyright

© 2004 Prentice Hall [Pearson]

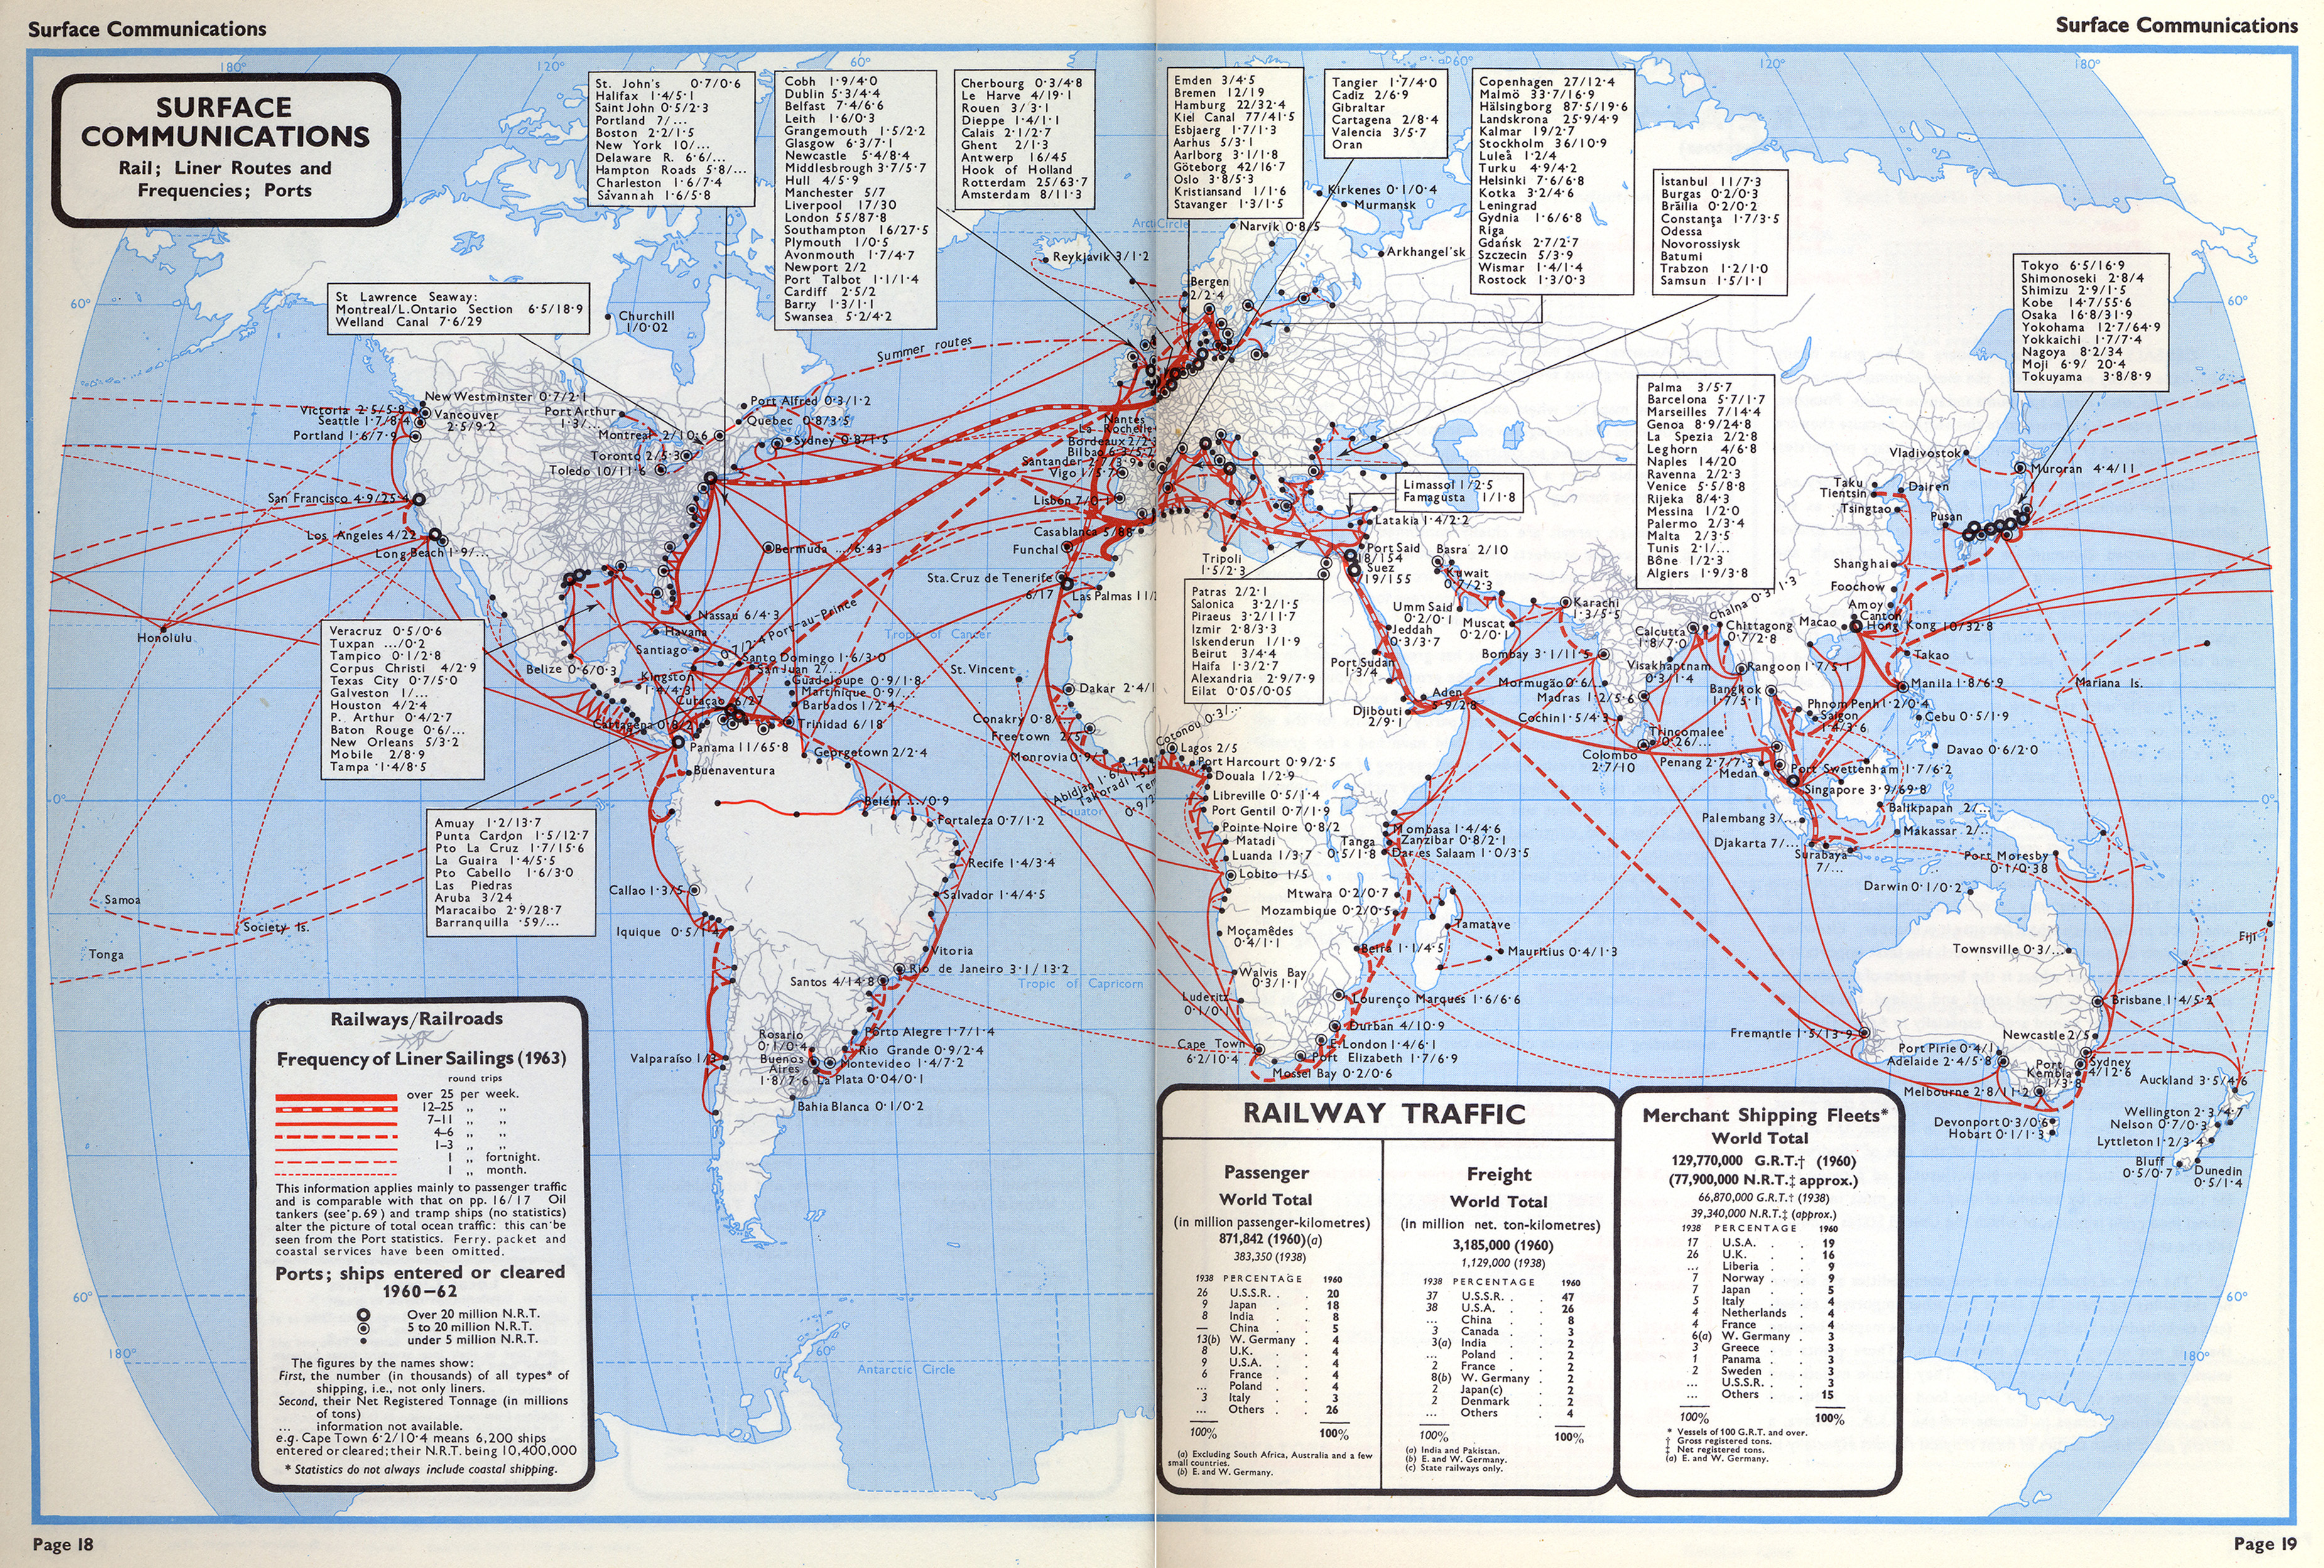
Surface Communications 2

Caption

Surface Communications – Rail, Liner Routes and Frequencies, Ports 2

Summary

World map shows Railway Routes, Frequencies of Liner Sailings (1963), and Ports/Ships cleared (1960-62). Map additionally provides a table with Passenger and Freight Railway Traffic (1960), and Total Merchant Shipping Fleets worldwide (1960).

See also MG©Surface Communications 1.jpg.

Source

Oxford Economic Atlas of the World (p. 18)

Prepared by the Economist Intelligence Unit and the Cartographic Department of the Clarendon Press, Third Edition, 1965.

Copyright

Oxford University Press.

This is a copyrighted work. Its use on QED is under the “Fair Use” rule.

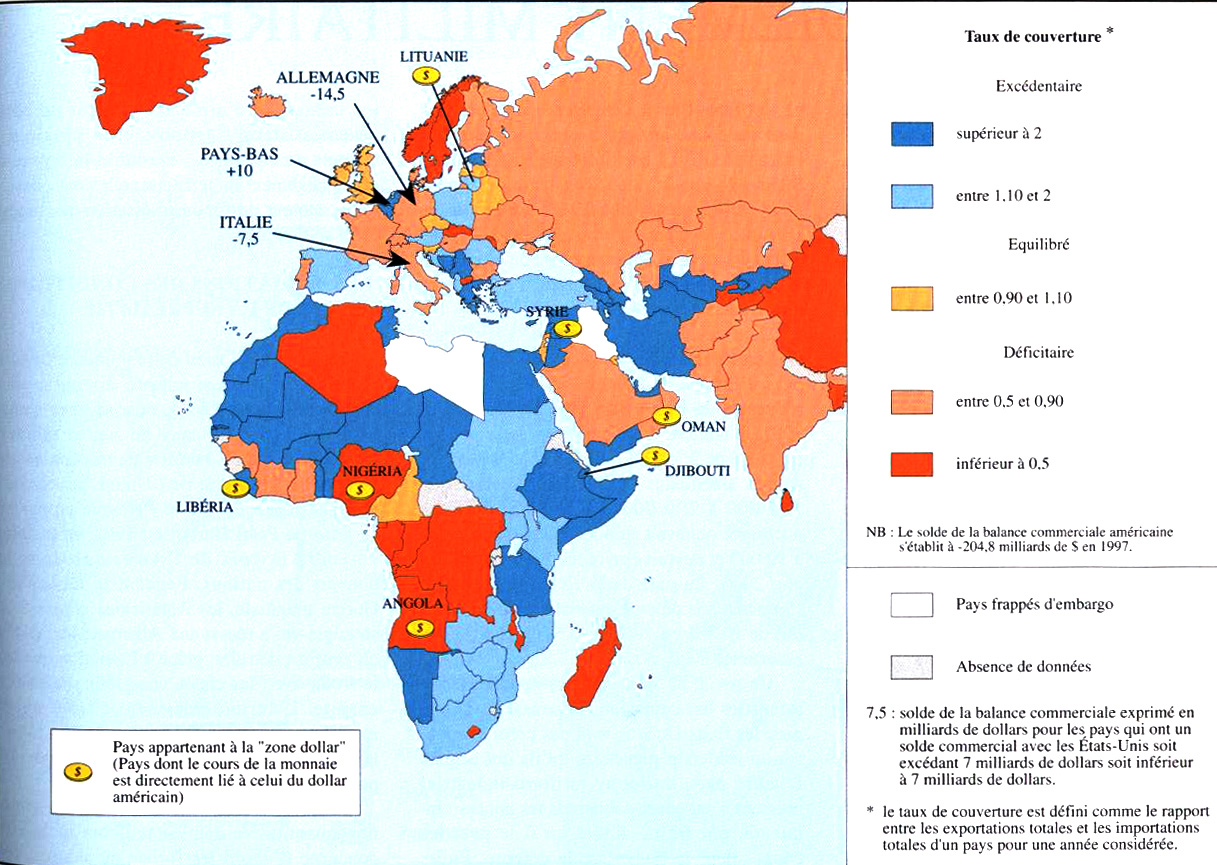
Taux de couverture

Caption

Taux de couverture
(Rate of Coverage)

Summary

Color-coded map shows rate of U.S. commercial coverage in countries in Europe, Middle East, Central and South Asia, and Africa in the late 1990s. It also indicates countris that belong to the “dollar zone.”

This is a copyrighted work. Its use on QED is under the “Fair Use” rule.

Source

Atlas Des ɉtats-Unis – Les paradoxes de la puissance. By Philippe Lemarchand, ed Atlande et complexes, Bruxelles, 1997. (p. 183)

Copyright

© 1997 Philippe Lemarchand

Surface Communications 1

Caption

Surface Communications – Rail, Liner Routes and Frequencies, Ports 1

Summary

World map shows Railway Routes, Frequencies of Liner Sailings (1953), and Ports/Ships cleared (1952). Map additionally provides a table with Passenger and Freight Railway Traffic (1956), and Total Merchant Shipping Fleets worldwide (1956). Modified Gall Projection.

See also MG©Surface Communications 2.jpg.

Source

Oxford Economic Atlas of the World (pp. 102-103)

Prepared by the Economist Intelligence Unit and the Cartographic Department of the Clarendon Press, Second Edition, 1959.

Copyright

Oxford University Press.

This is a copyrighted work. Its use on QED is under the “Fair Use” rule.

Submarine Cable Map, 2007

Caption

Submarine Cable Map 2007

Summary

This map shows major submarine cable systems around the world. The numbers in parentheses show lit capacity in gigabits per second (Gbps) by the end of 2006.

The map shows international and U.S. domestic cables with a full capacity of 5 Gbps. Cable routes are stylized and do not reflect exact physical cable location. Inset tables indicate local smaller cable systems originating in specific points, such as Honolulu.

Other elements of the map are as follows.

Submarine Cable System Timeline (between 1995-2006)

“Submarine cables shown in this timeline include all the systems depicted in the main projection of the map. Some regional systemas may be omitted. Column height reflects capacity when the system began operation. For systems configured as self-healing or collapsed rings, initial capacity is presented as the sum of both halves of the ring.”

  • Legend indicates:
    • Saffron: Trans-Atlantic
    • Pomegranate: Trans-Pacific
    • Venetian Red: Intra-Asia
    • Pear: Europe-Asia
    • Olive Crab: Latin America and Caribbean
    • Gray: Other regional systems

The longest submarine cable systems

“SeaMeWe-3 is the longest submarine cable built to date. The system spans 39,000 kilometers from Norden in Germany to Keoje in South Korea. Its 39 landing points connect 32 different countries. The shortest system depicted on this map is only 60 kilometers long. Germany-Denmark 2 is a point-to-point system connecting two points: Ribnitz, Germany and Gedser, Denmark.”

  • Legend indicates:
    • SeaMeWe-3 (39,000 kms)
    • Southern Cross (30,500 kms)
    • China-U.S. (30,476 kms)
    • FLAG Europe-Asia (28,000 kms)
    • South America-1 (25,000 kms)

Join the Club

“Of the 151 countries with shorelines, the United States surpasses any other country with over 60 international fiber-optic submarine cable systems landing on its shore. Other countries, such as the following eight nations, will be connected by an international fiber-optic submarine cable system for the first time by 2008.”

  • Legend indicates:
    • Eritrea: East African Submarine Cable System
    • Haiti: Trans-Caribbean Cable Network; Bahamas Domestic Submarine Cable Network
    • Kenya: East African Marine System; FLAG Falcon’s Yemen-Kenya Extension; East African Submarine Cable System
    • Madagascar: East African Submarine Cable System
    • Maldives: Wataniya Fiber Optic Submarine Cable; Dhiraagu’s Maldives-Sri Lanka Cable System
    • Mozambique: East African Submarine Cable System
    • Somalia: East African Submarine Cable System
    • Tanzania: East African Submarine Cable System


Components of a submarine

Cross-section layers of submarine cables.


Price trends for several routes

  • Lit submarine cable capacity for trans-Atlantinc, trans-Pacific, intra-Asia, U.S.-Latin America, and Europe-Asia routes
  • Global lit submarine cable capacity

Source

Produced and designed by TeleGeography Research.

Sponsored by Pacific Crossing

ISBN: 1-886142-76-9

Produced and designed by Markus Krisetya, Eric Schoonover and Roxanna Tran.

“This work is based upon sources believed to be reliable, but the publisher does not warrant the accuracy or completeness of any information for any purpose and is not responsible for any errors or omissions. The political boundaries in this map are taken from authoritative sources and are believed to be accurate at the date of publication of this map.”

This map is in the collection of copyrighted maps of the Geosciences and Map Library, Fine Hall (B level), Princeton University.

Call number: MC G3201.P93.2007.T4

Copyright

© 2006 TeleGeography. All rights reserved.

Series

This map is one in a series:


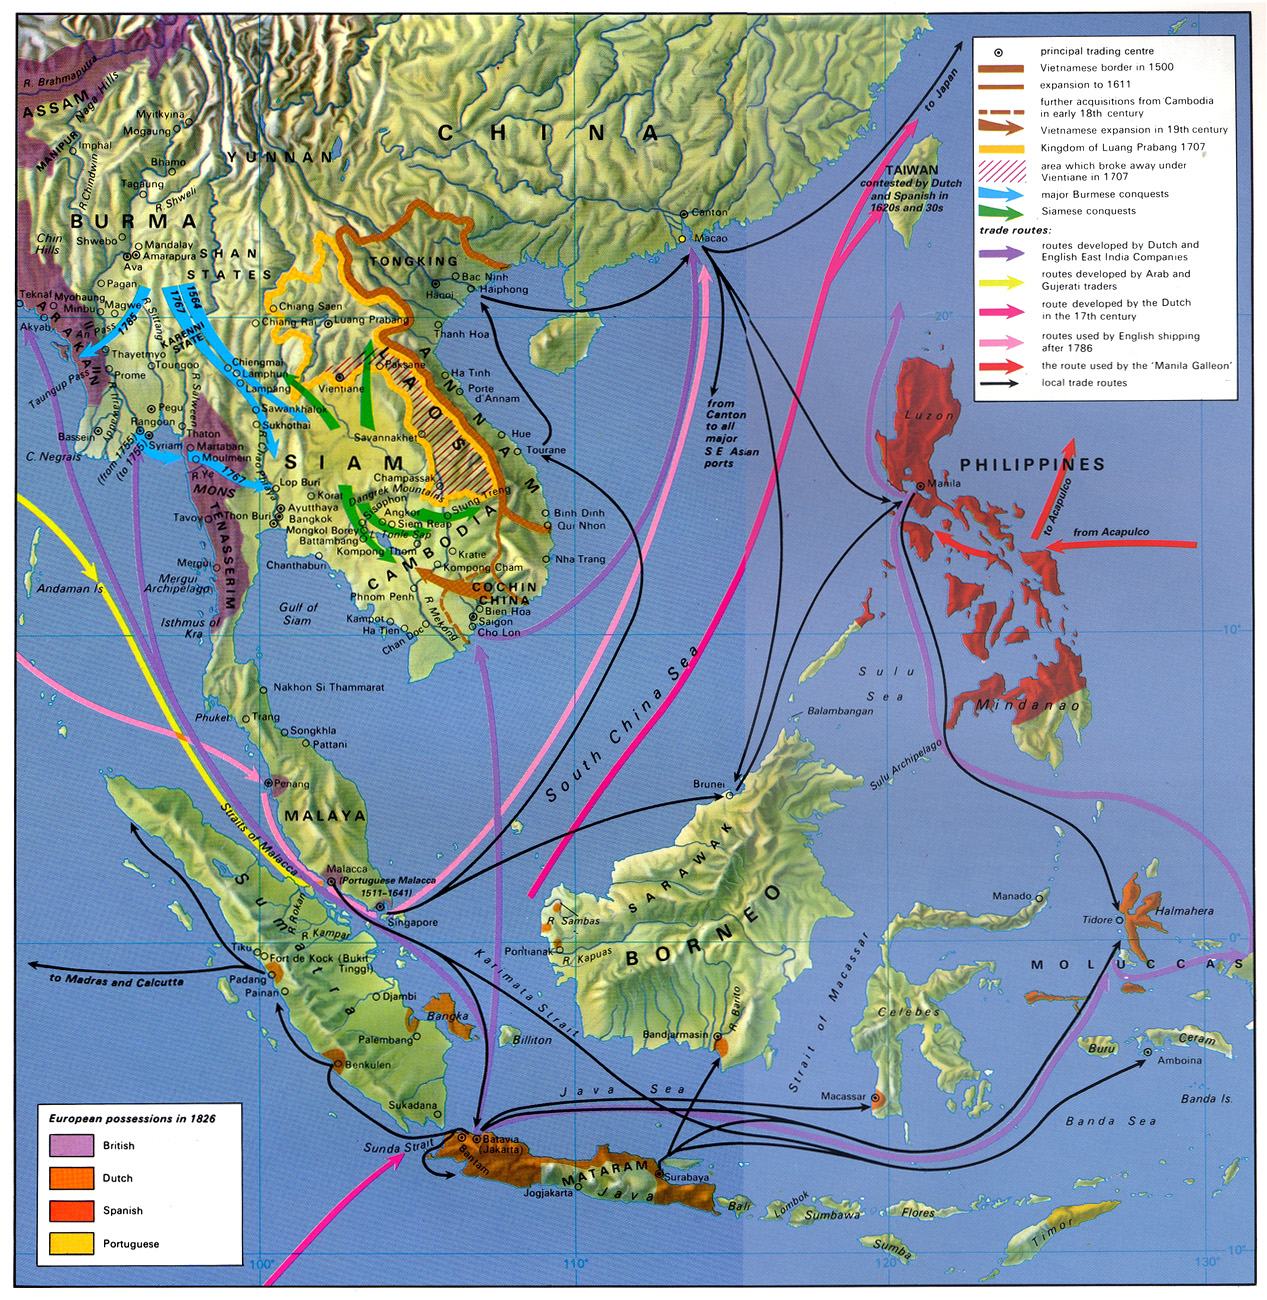
Southeast Asian Trade Routes 17th – 19th century

Caption

Southeast Asian Trade Routes, 17th – 19th Century

Summary

The map shows conquests and local and foreign trade routes in South Asia from the early 1600s to the 1800s.

Source

Geoffrey Barraclough. Times Atlas of World History (p. 173).

Times Books Division of Harper Collins Publishers, London. 4th edition, 1993.

GIS Library. Scanned at 400dpi, digitized at 300dpi.

Copyright

Geoffrey Barraclough.

This is a copyrighted work. Its use on QED is under the “Fair Use” rule.