Skip to main content
Mapping Globalization
Menu
Skip to content
Data and Analysis
NetMap Studies of World Trade
Network Analysis
Maps
Narratives
Empires
Alexander the Great
Byzantine Empire
Invasion of the Goths
Migration
Asia
Eurasia
Europe
The Genetics of Prehistoric Migration
Indoeuropeans
Out of Africa
Menu
Skip to content
Contact
Tag:
Statistics
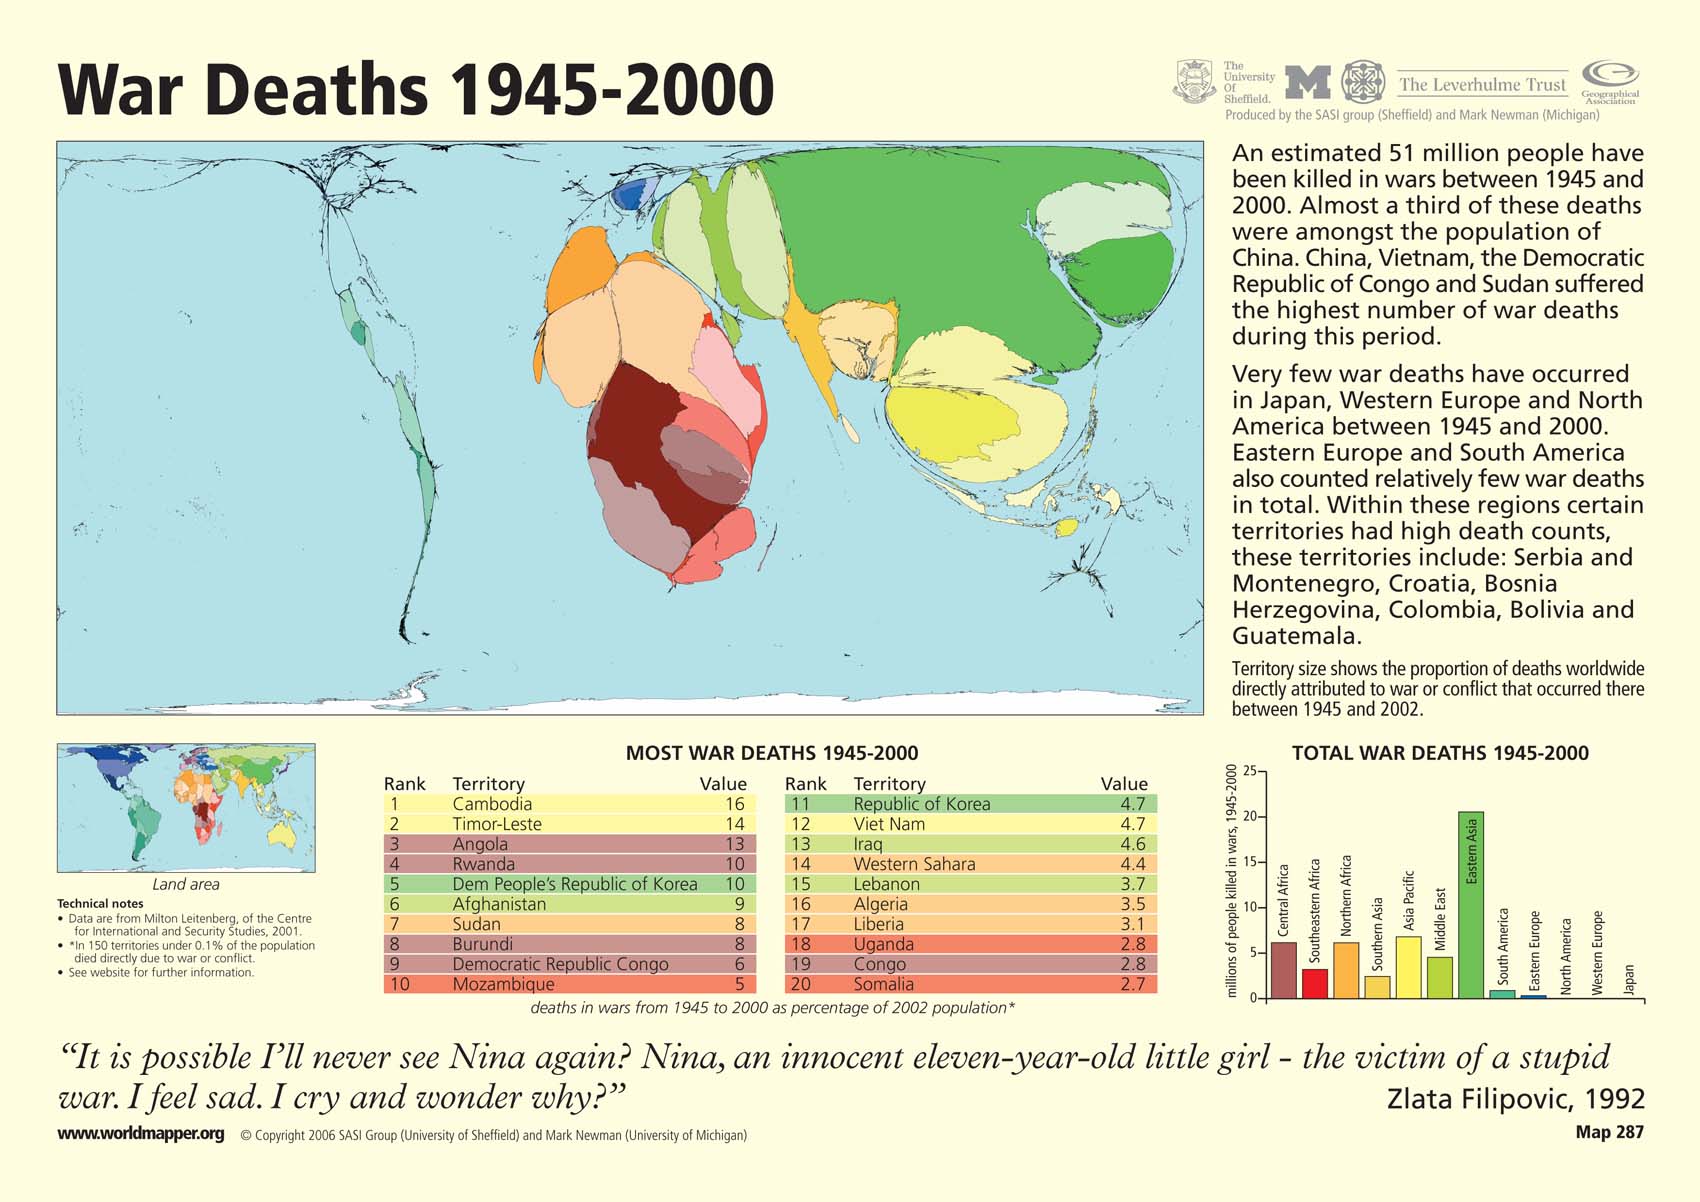
War Deaths 1945 – 2000
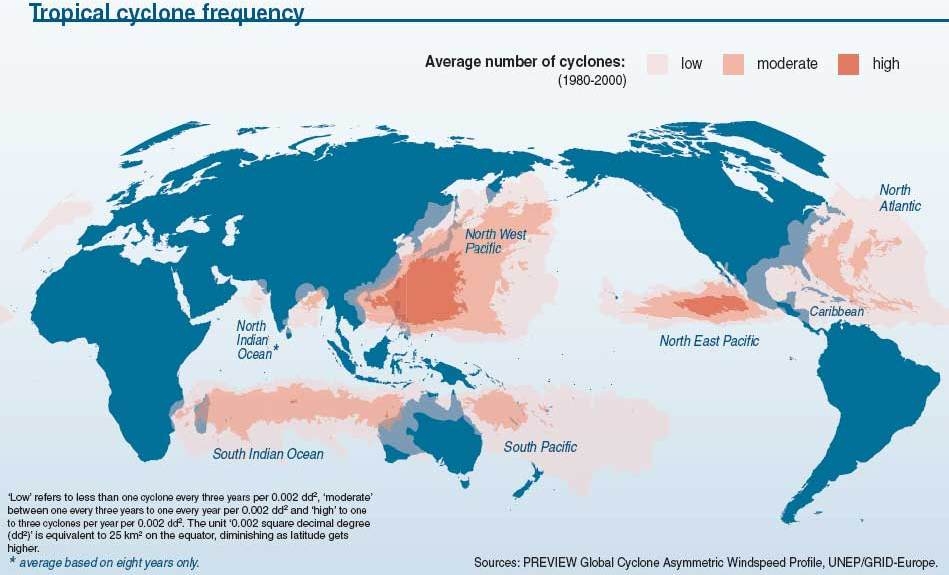
Tropical Cyclone Frequency, 1980 to 2000
The Wretched Dollar (up to $1 a day), 2004
The State of World’s Fisheries Inland and Marine Capture Fishery Trends, 1984 to 1998
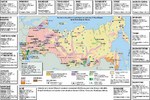
The Russian Kaleidoscope, 1995
The Rising Tide of Refugees, 1999
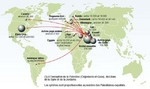
The Palestinian Diaspora, 1997
The Effect of The Depression in North America and Europe, 1928 to 1934
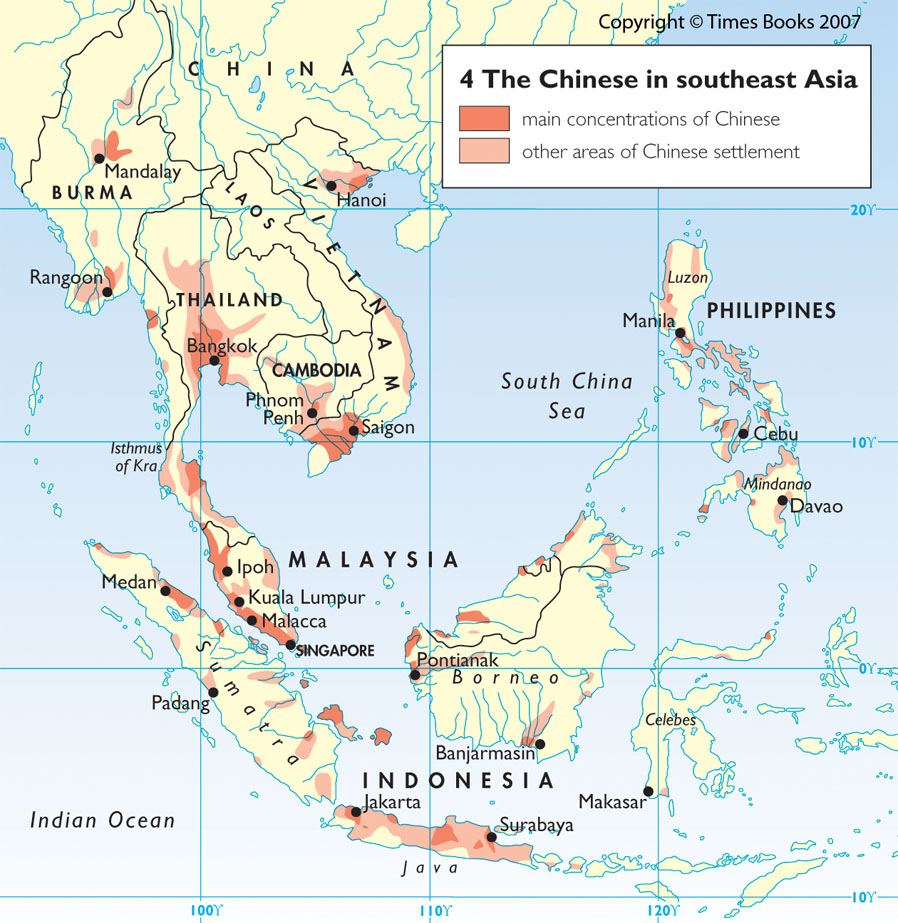
The Chinese in southeast Asia c. 1980
Teubners Weltwirtschaftskarten III 3
Teubners Weltwirtschaftskarten I 3
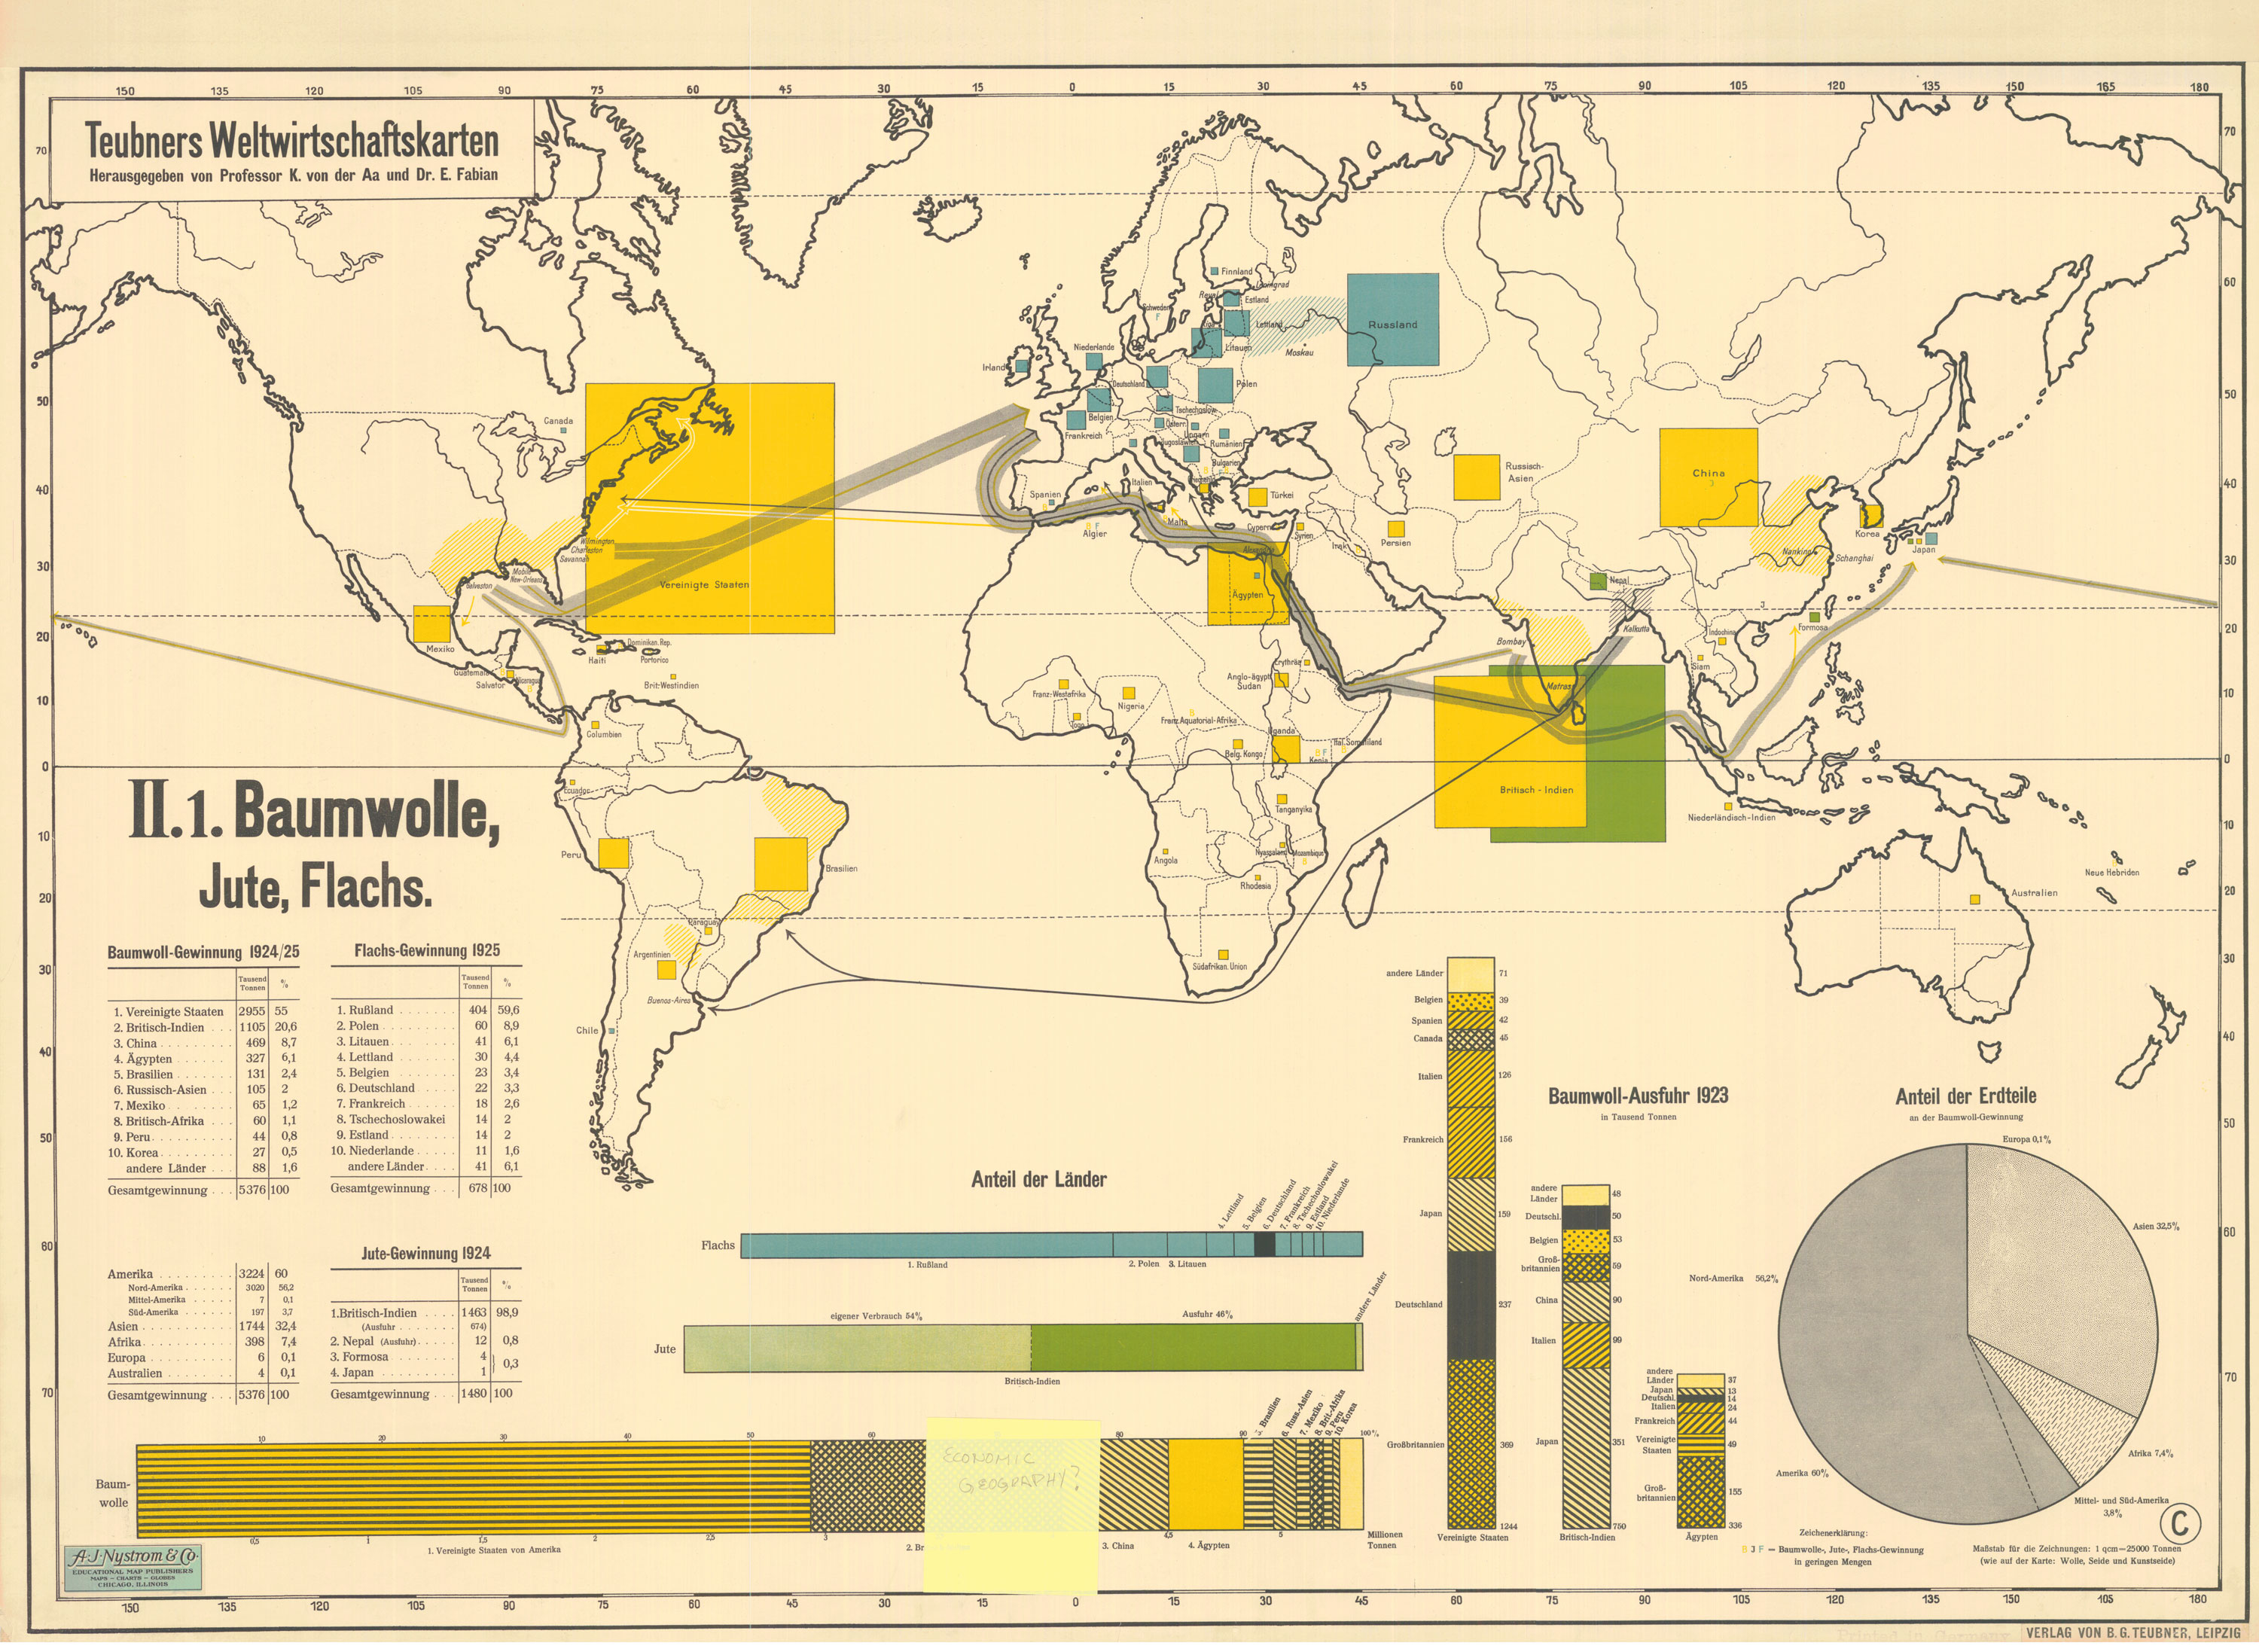
Teubners Weltwirtschaftskarten II 1
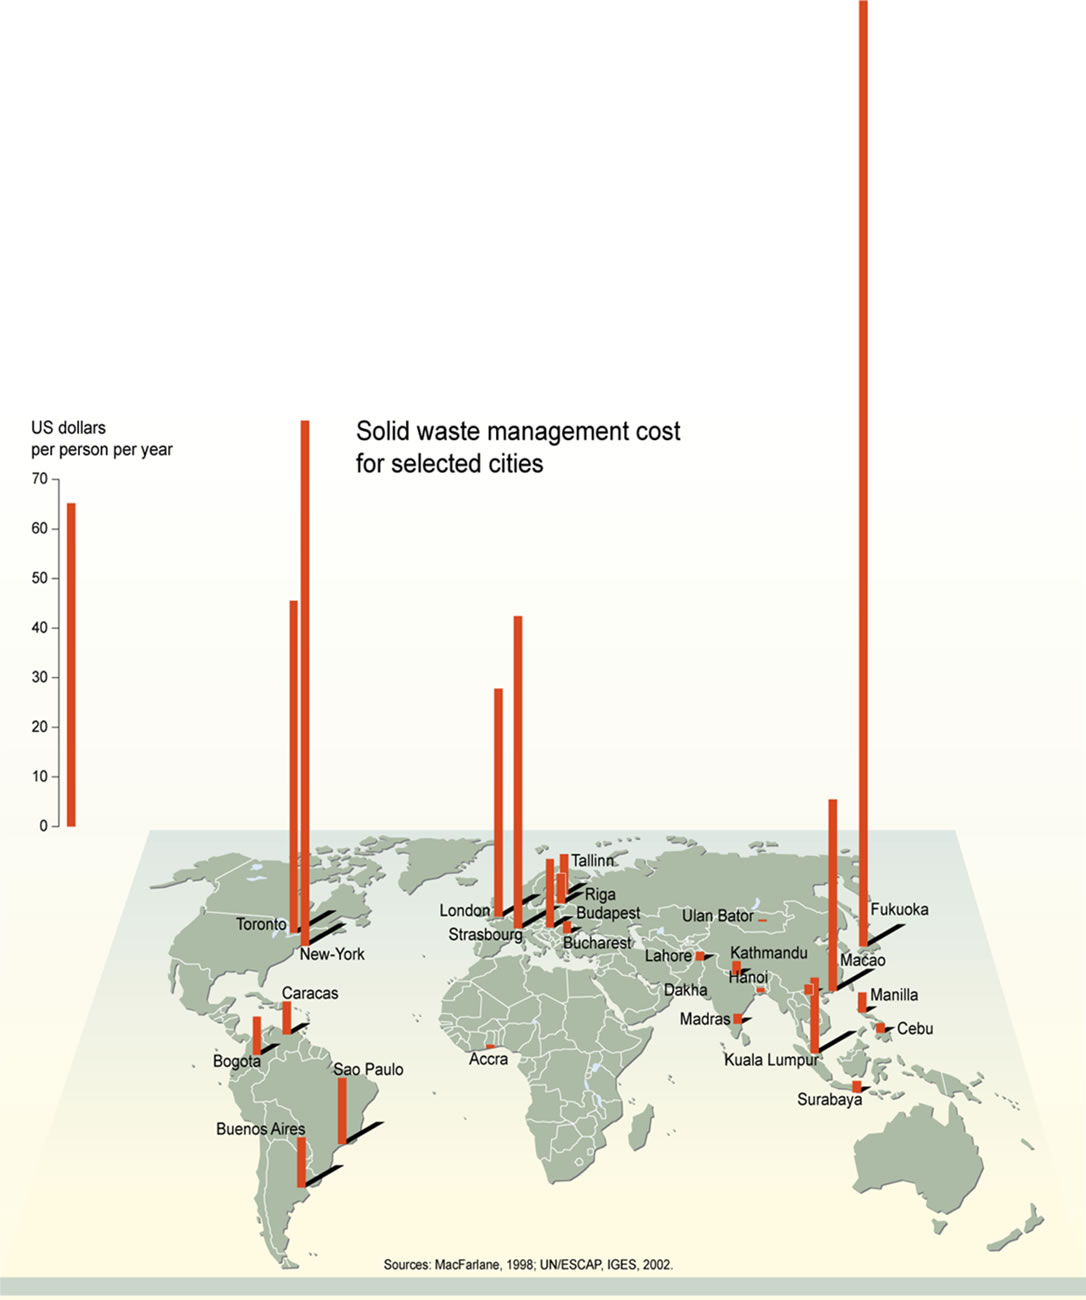
Solid Waste Management Cost for Selected Cities, 2002
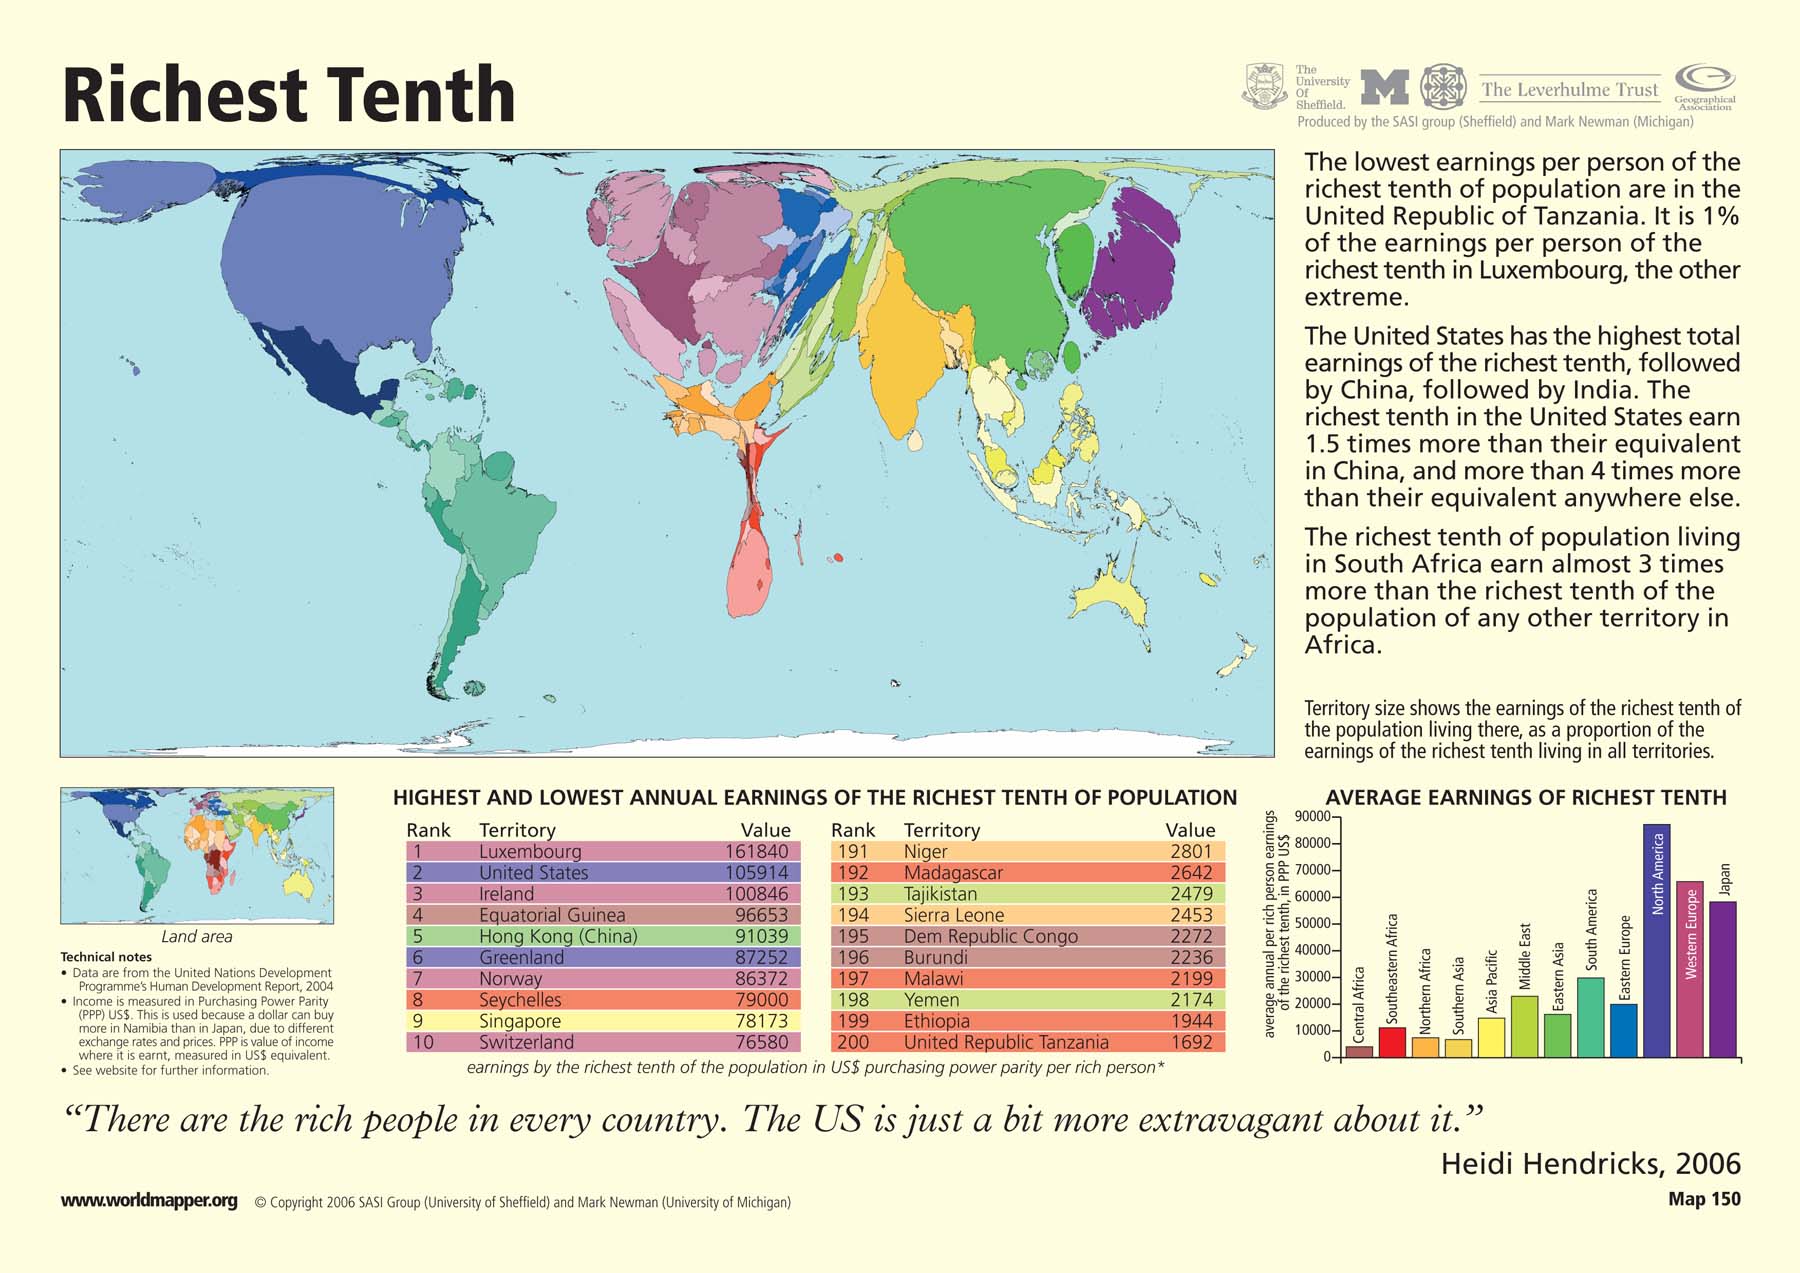
Richest Tenth, 2004
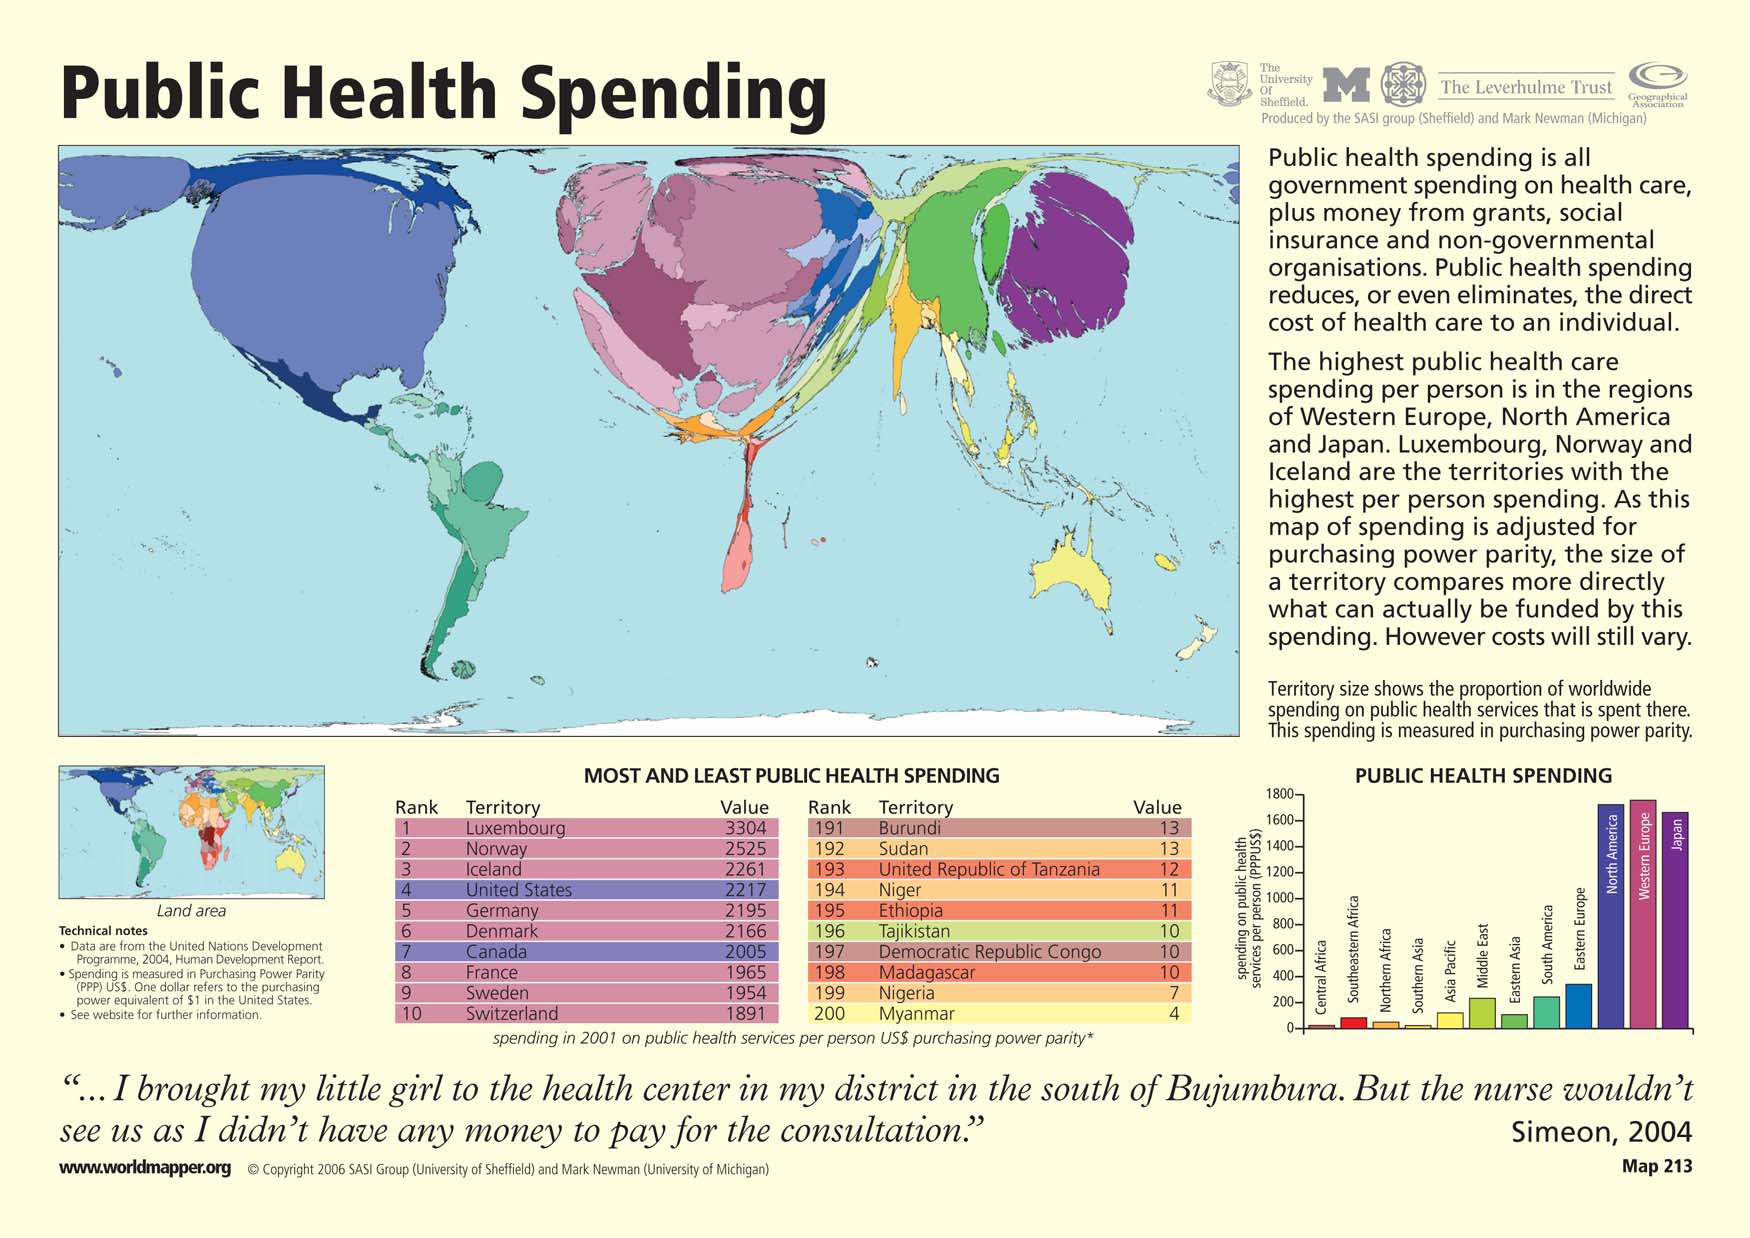
Public Health Spending, 2001-2004
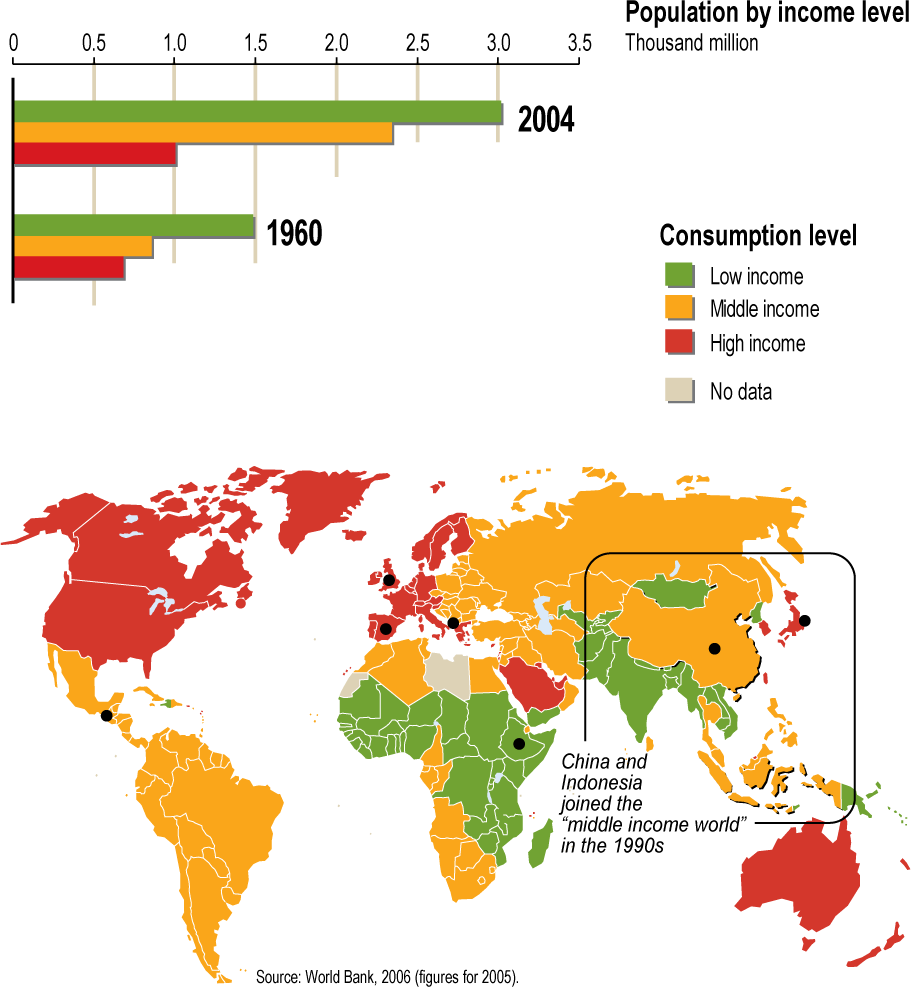
Population by Income Level, 2005
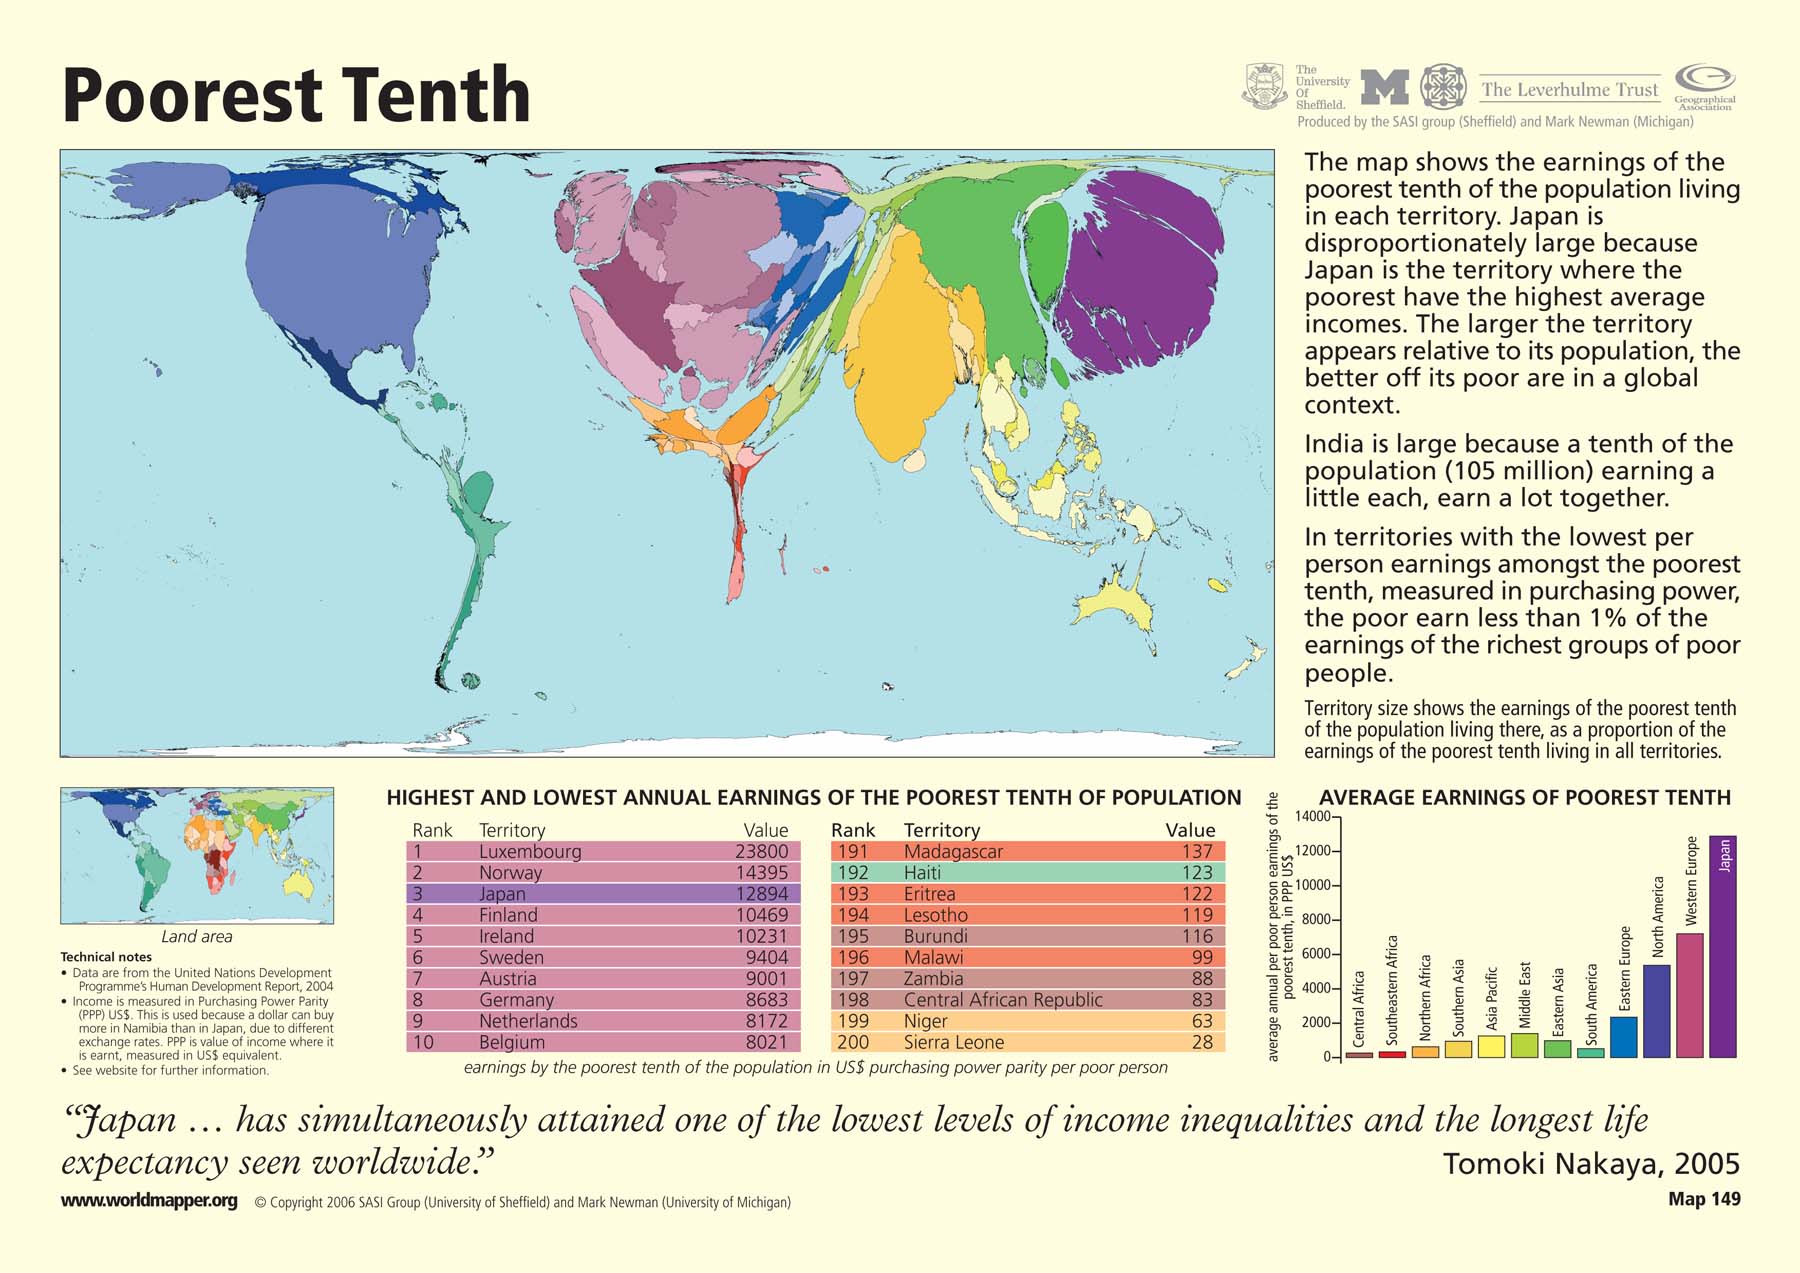
Poorest Tenth, 2004
Physicians Working, 2004-2006
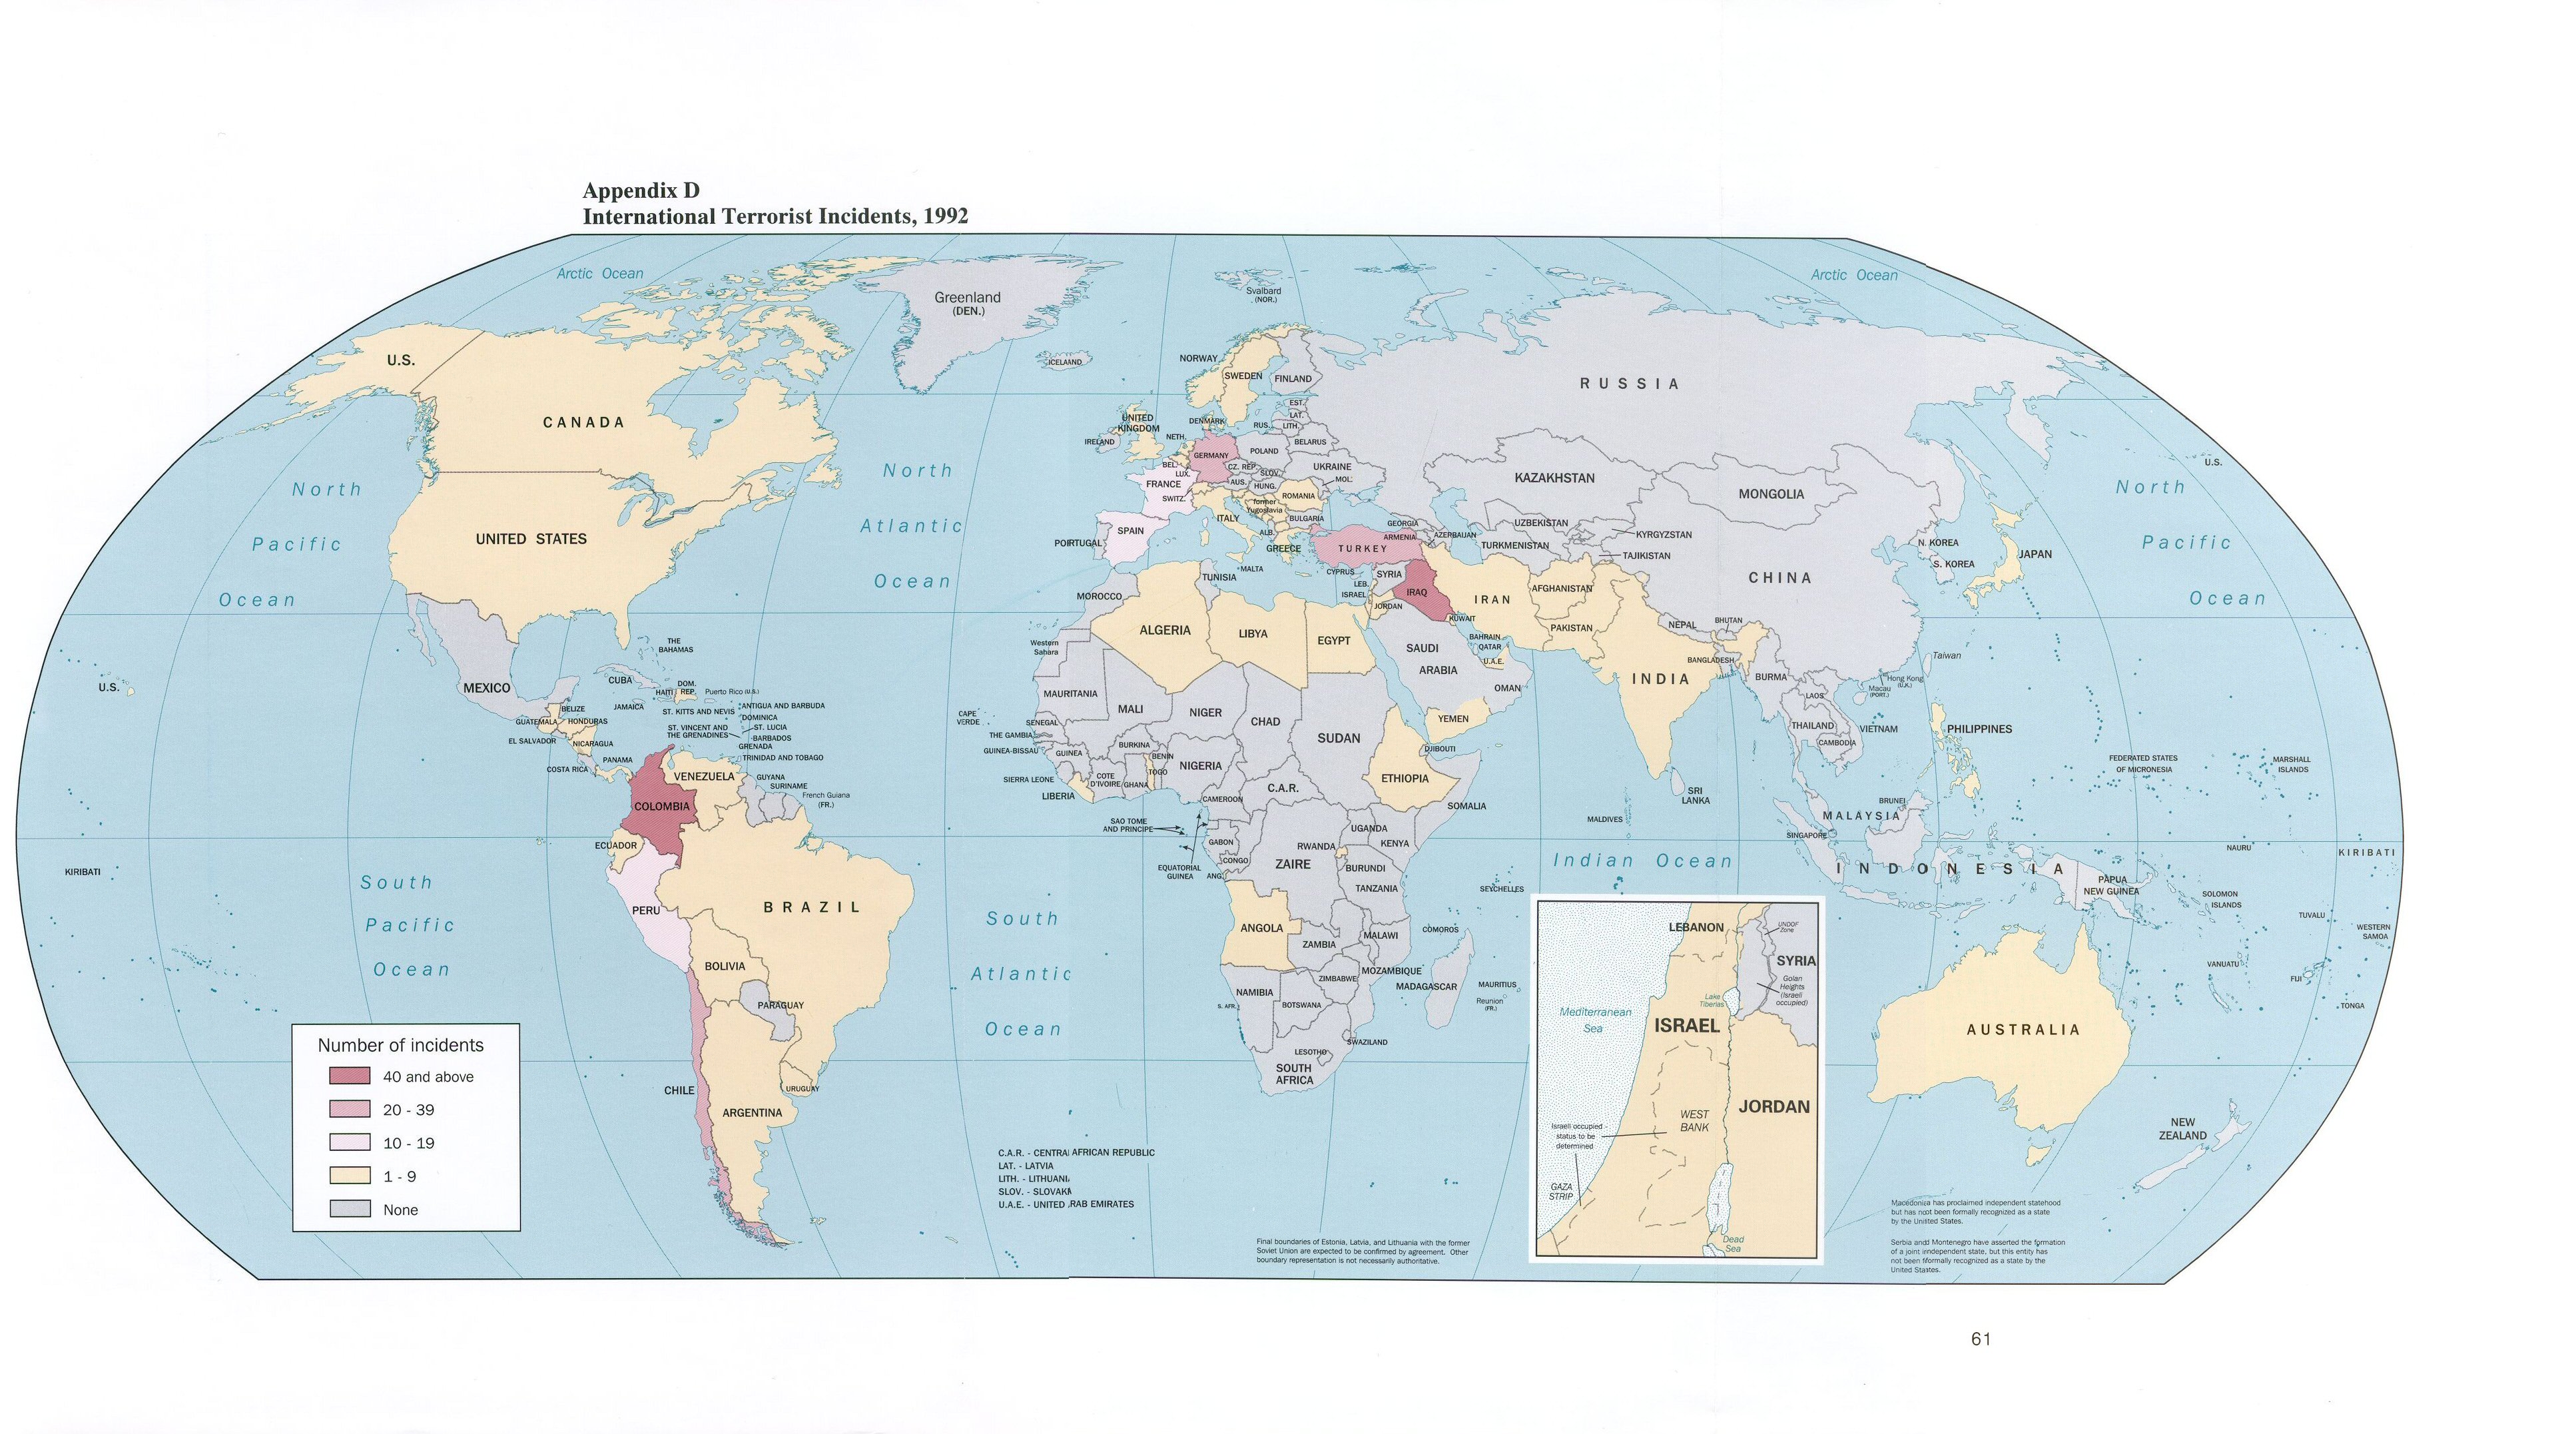
Patterns of Global Terrorism 1992
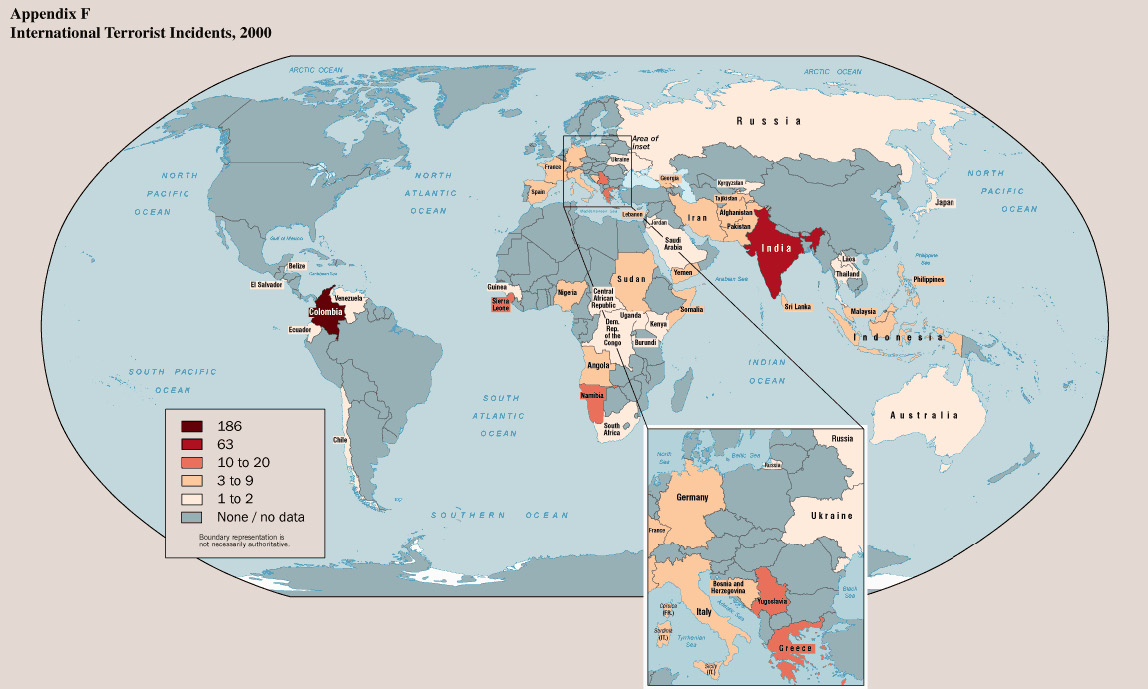
Patterns of Global Terrorism 2000
Passenger kilometers (miles) flown 1994
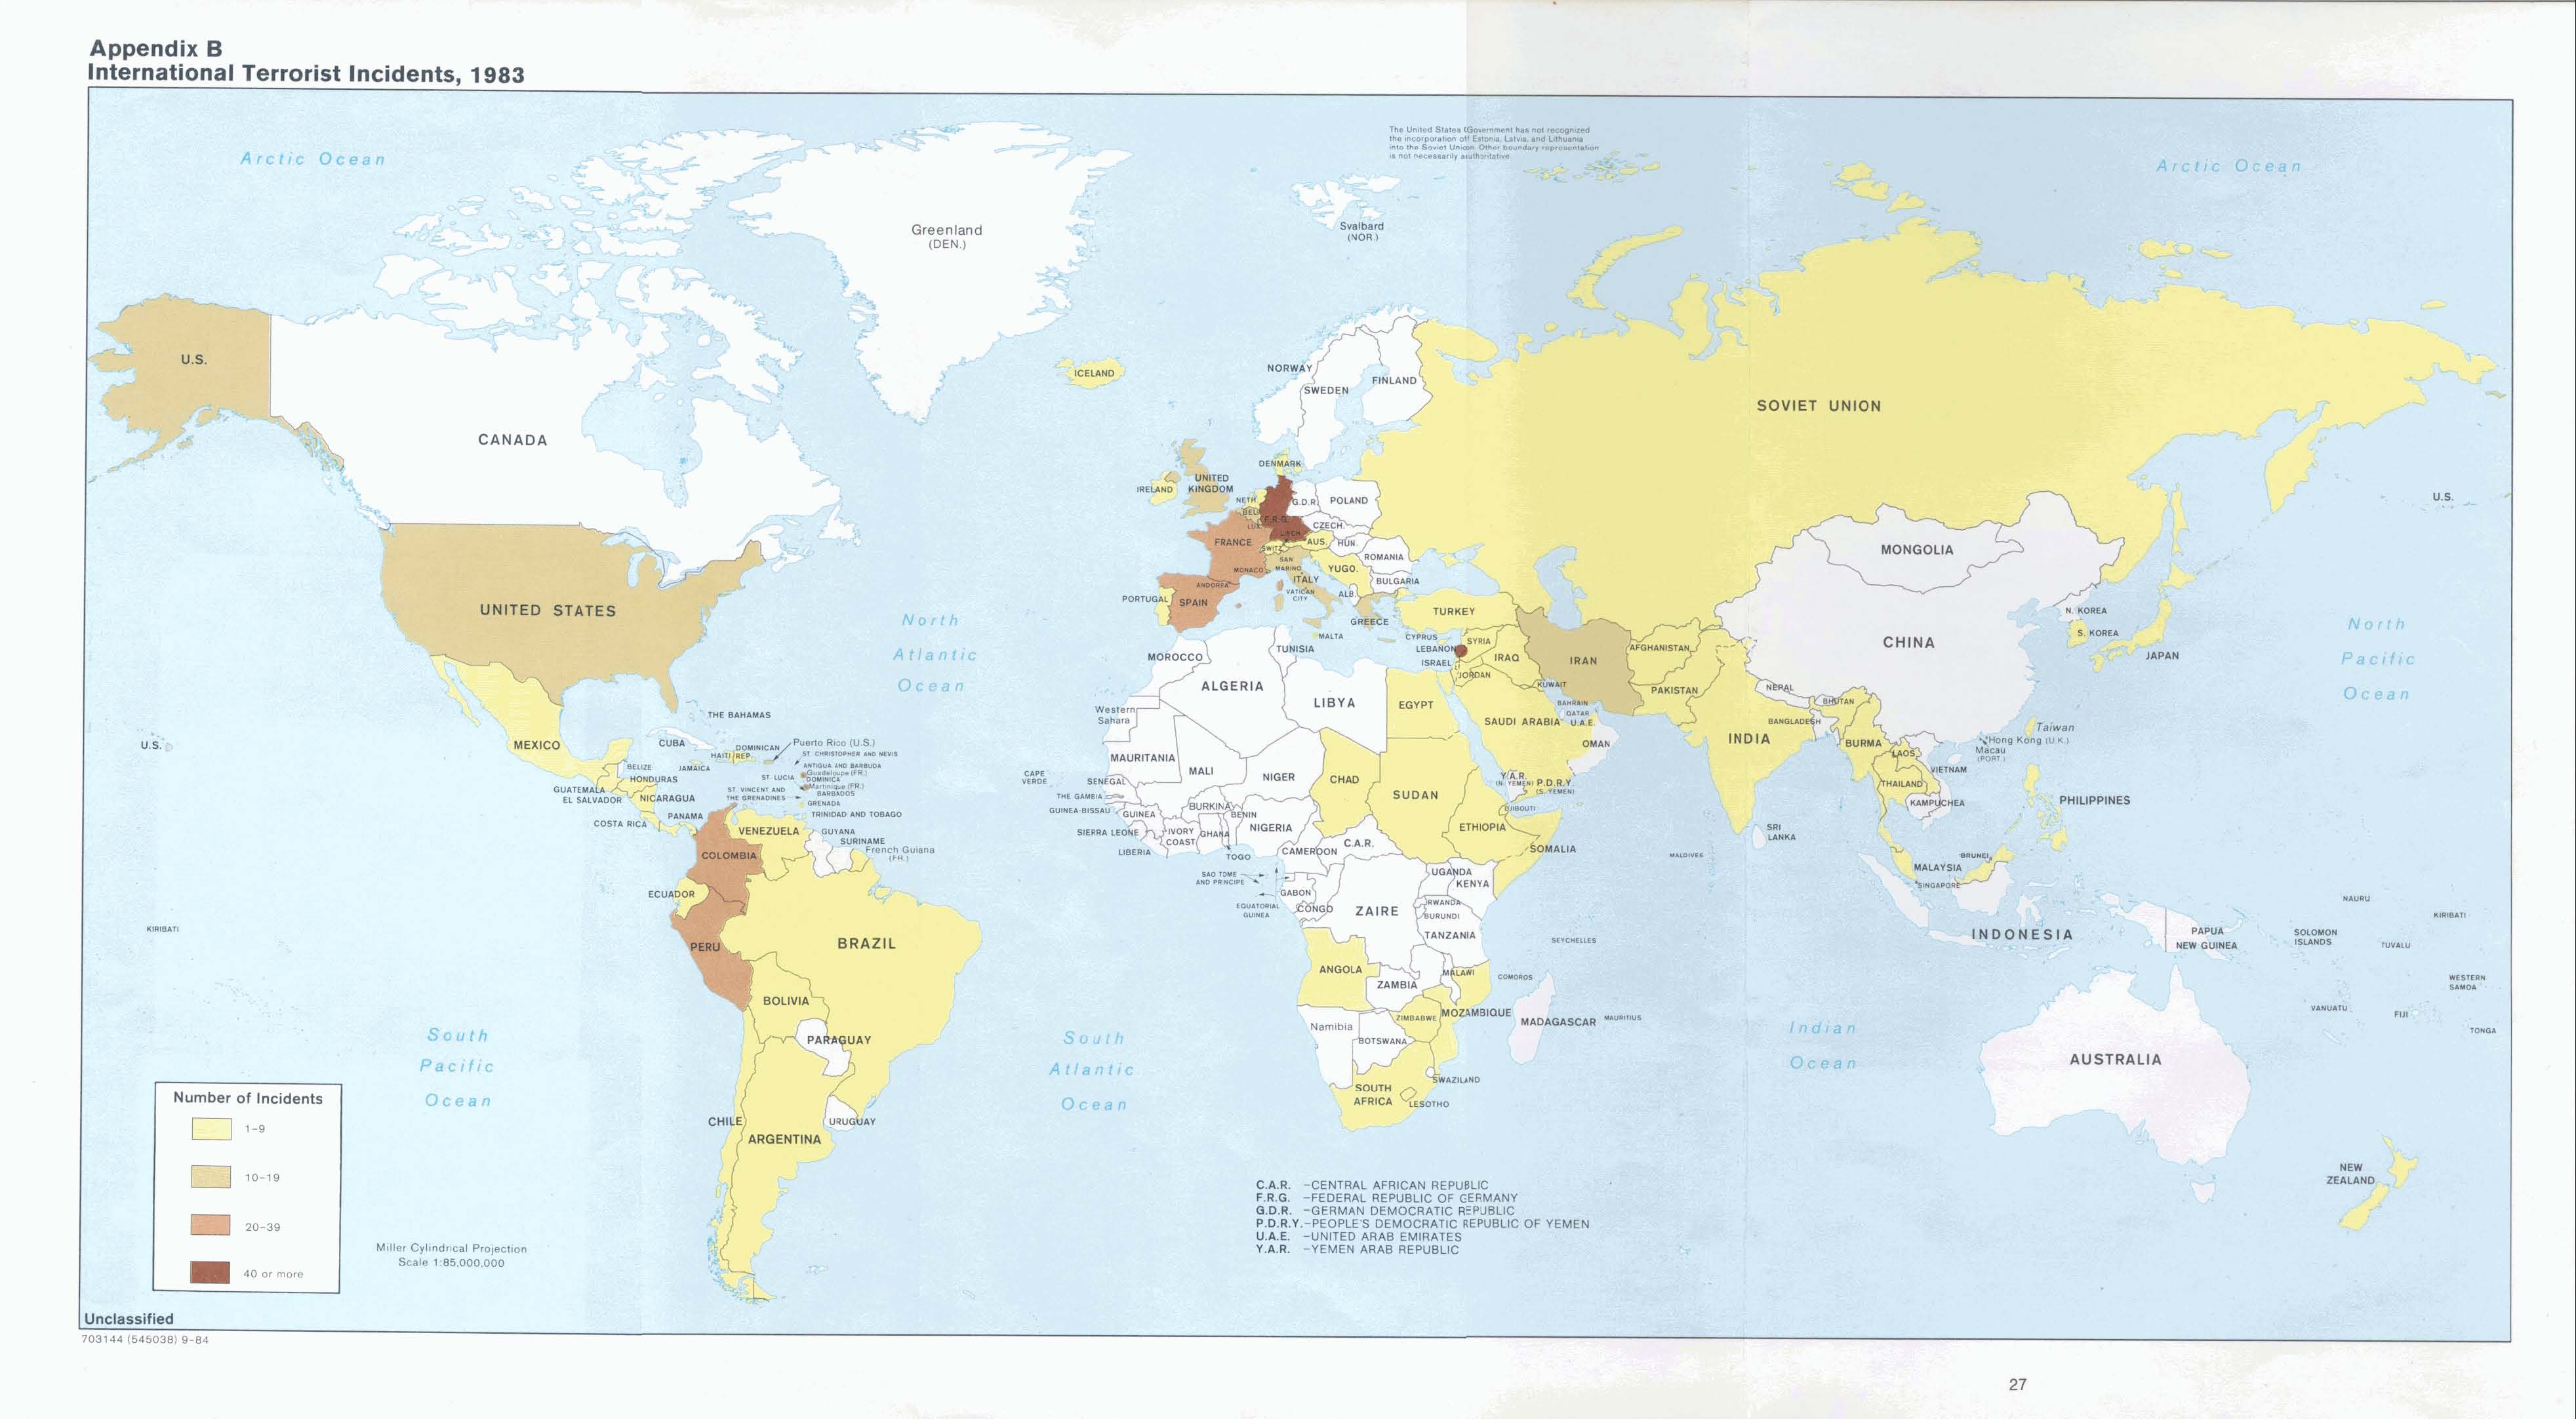
Patterns of Global Terrorism 1983
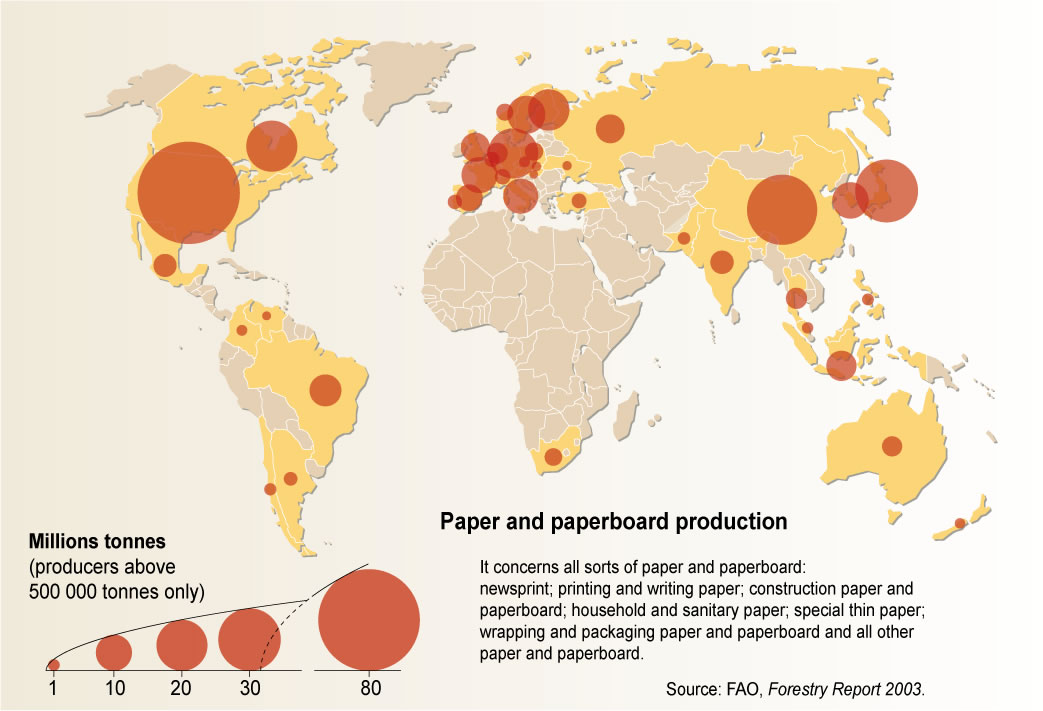
Paper and Paperboard Production in 2003
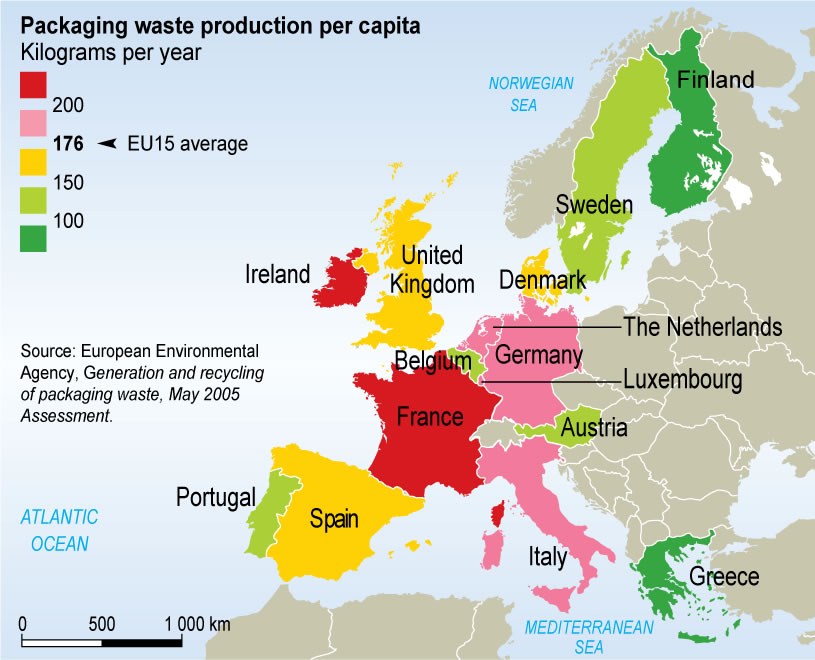
Packaging Waste Production per Capita in Europe in 2005
No Shelter, 2003
Municipal Solid Waste Generation for Selected Large Cities in Asia, 1995-2025
Modern China-Traffic and Communications, 20th Century
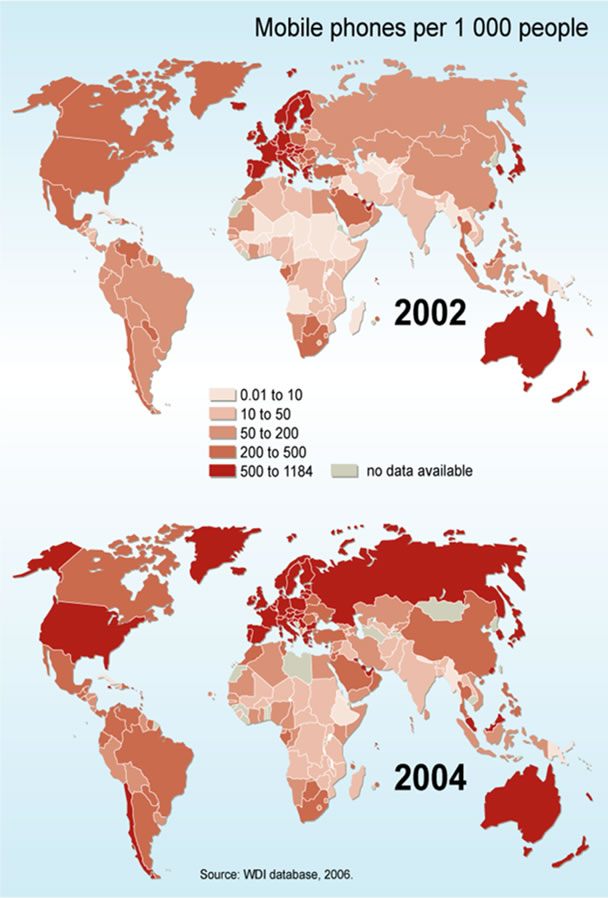
Mobile Phone Subscribers in 2002 and 2004
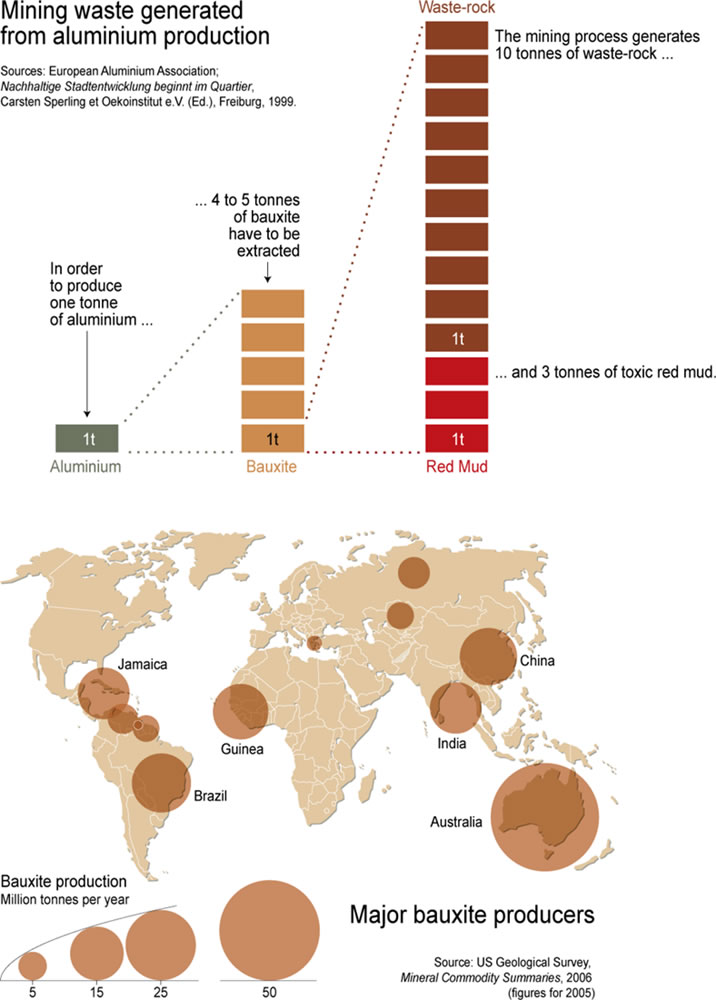
Mining Waste Generated From Aluminium Production and Major Bauxite Producers, 2005
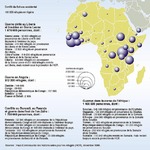
Millions of Refugees in Africa, 1999
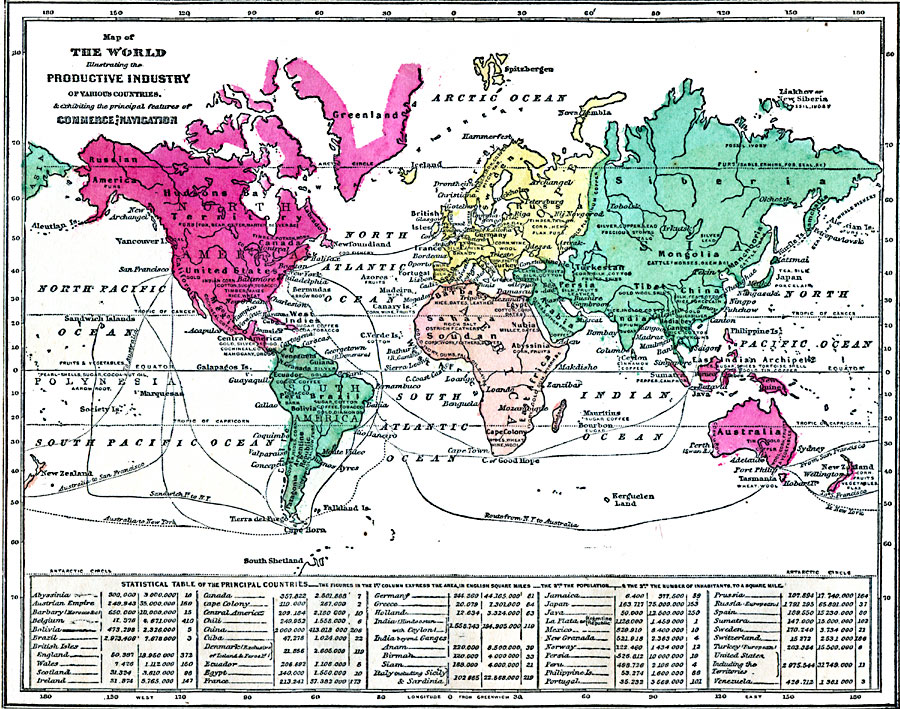
Map of the World illustrating the Productive Industry of Various Countries, 1868
Major Waste Exporters Major Waste Receivers in 2003
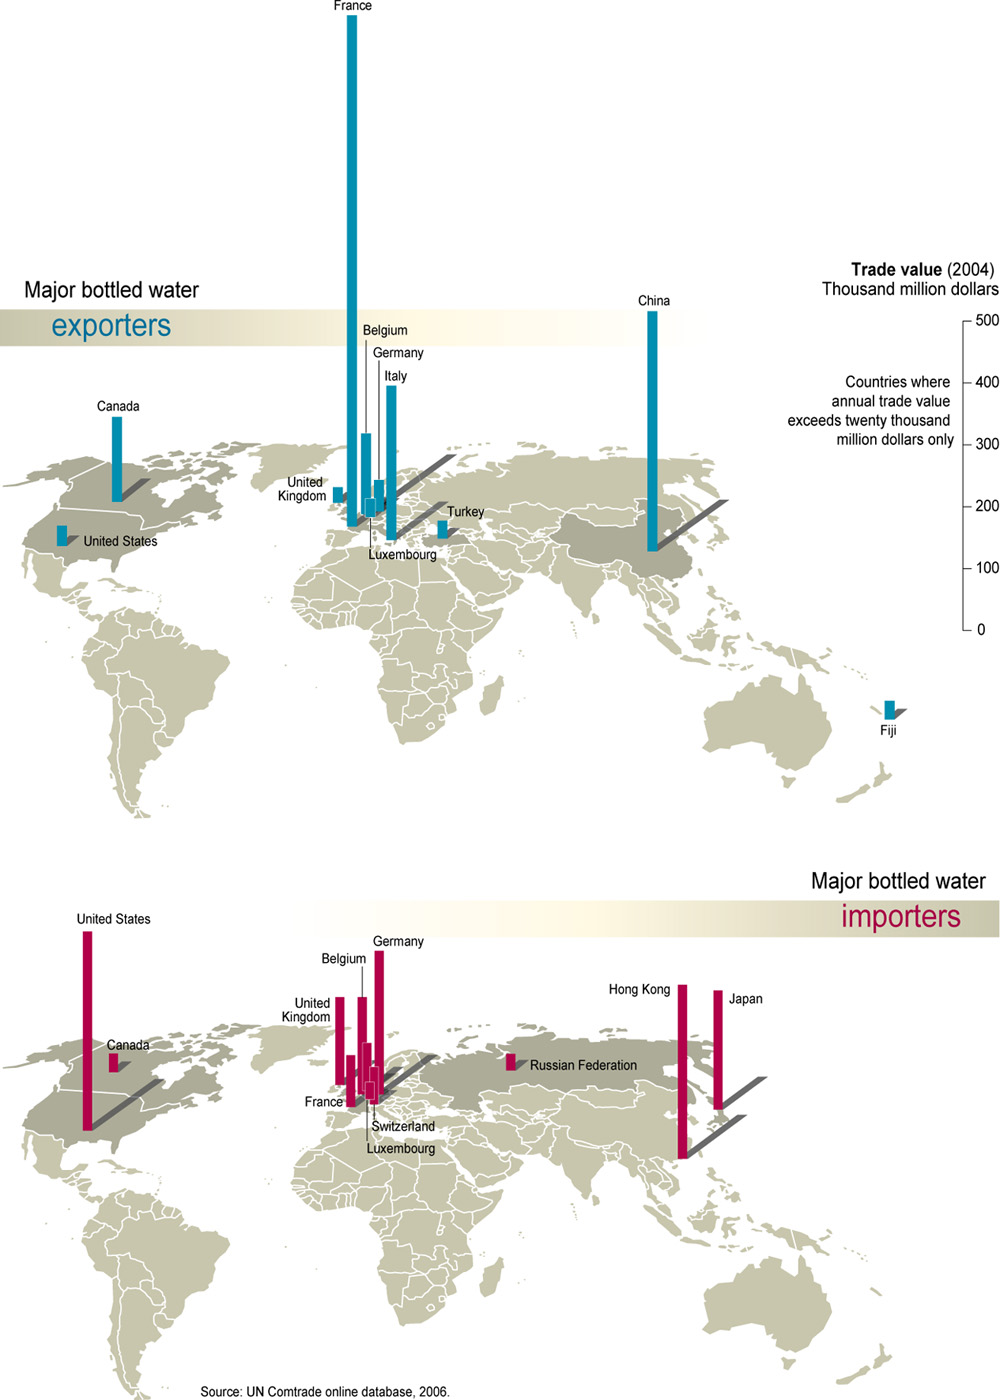
Major Bottled Water Exporters and Importers, 2006
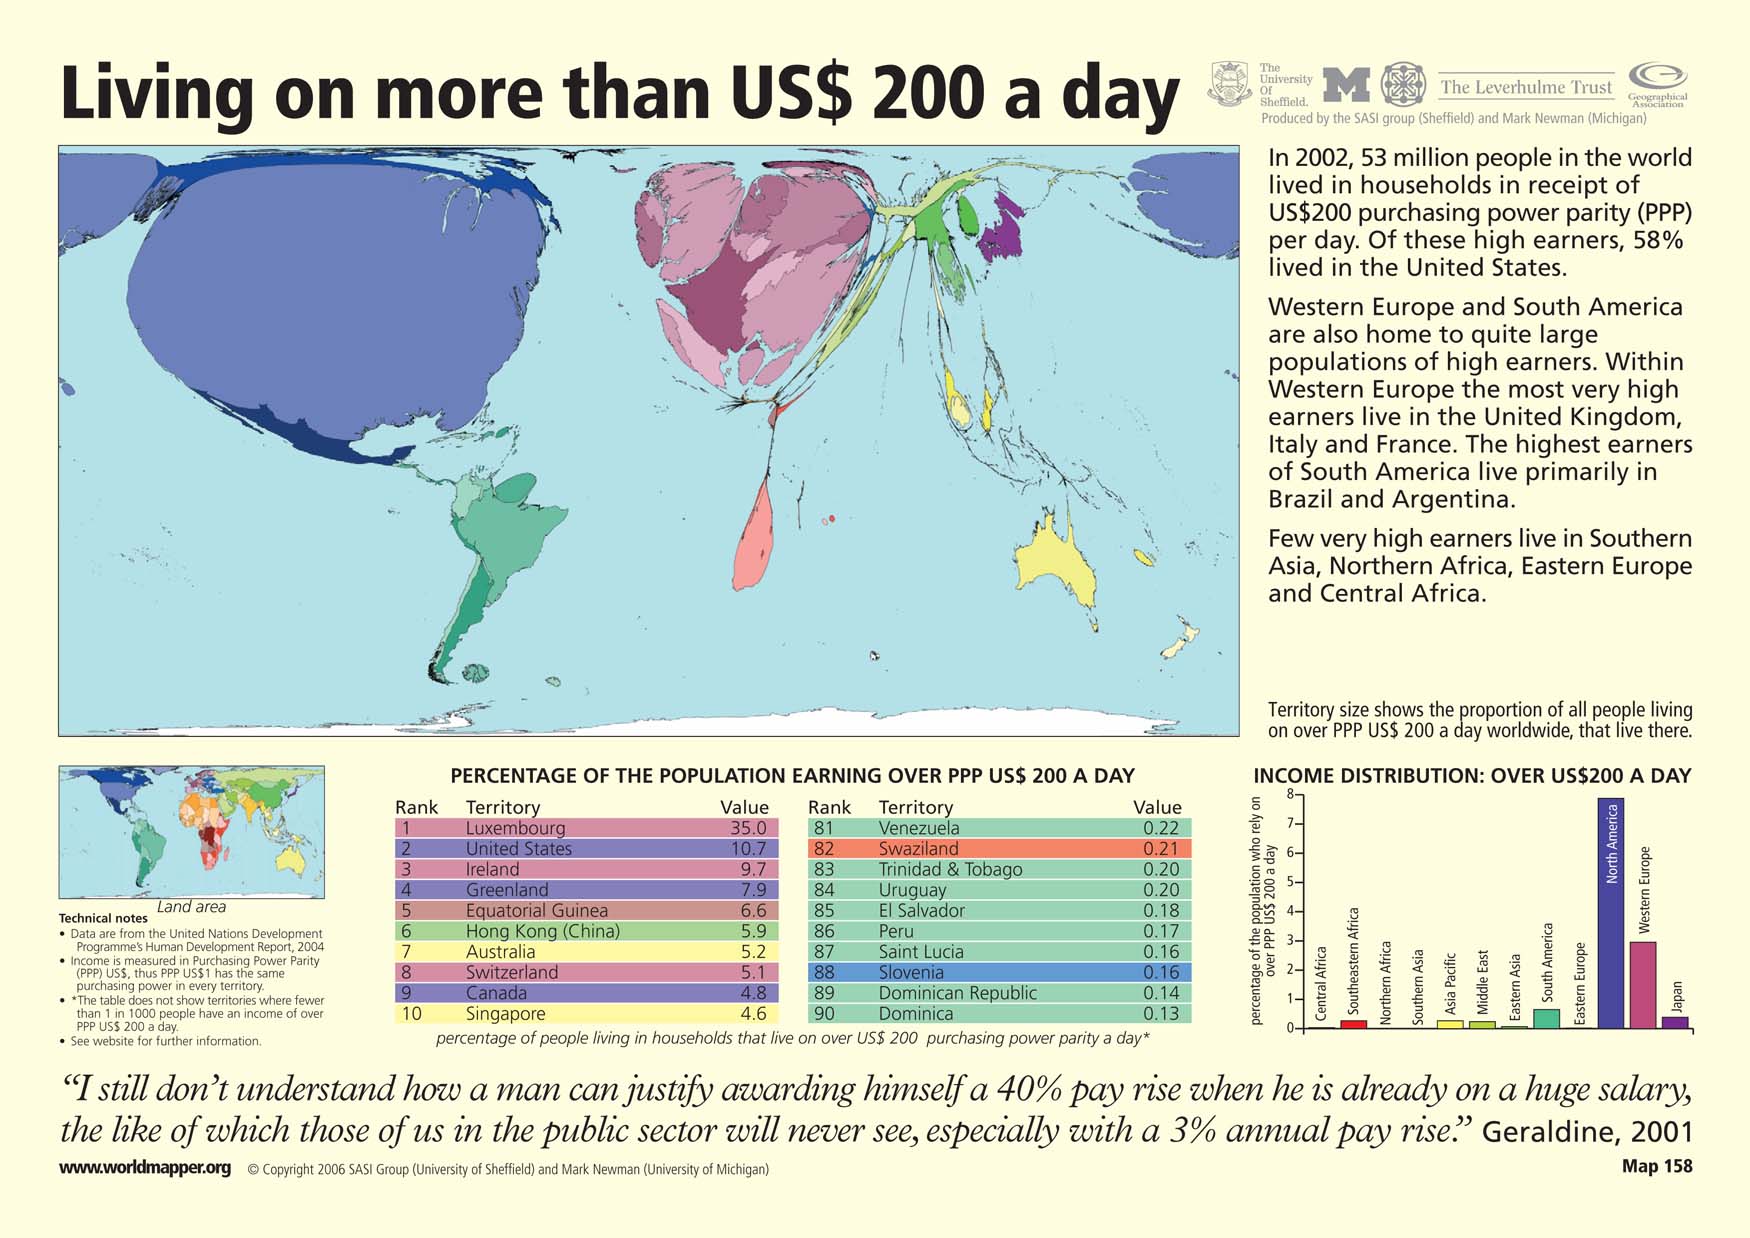
Living on over $200, 2004
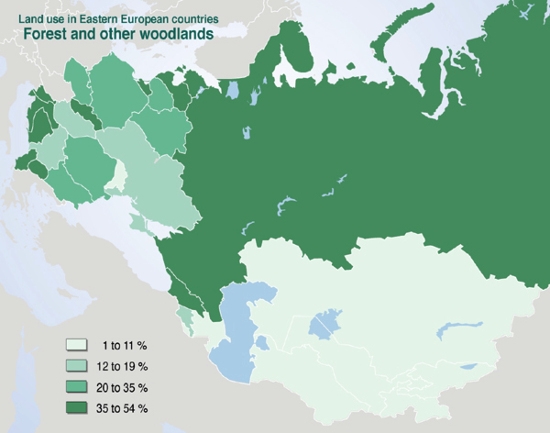
Land Use in Eastern European Countries, Forest and other Woodlands, 2000
Post navigation
Previous
1
2
3
Next

,_2004.jpg)


_flown_1994.jpg)