
Caption
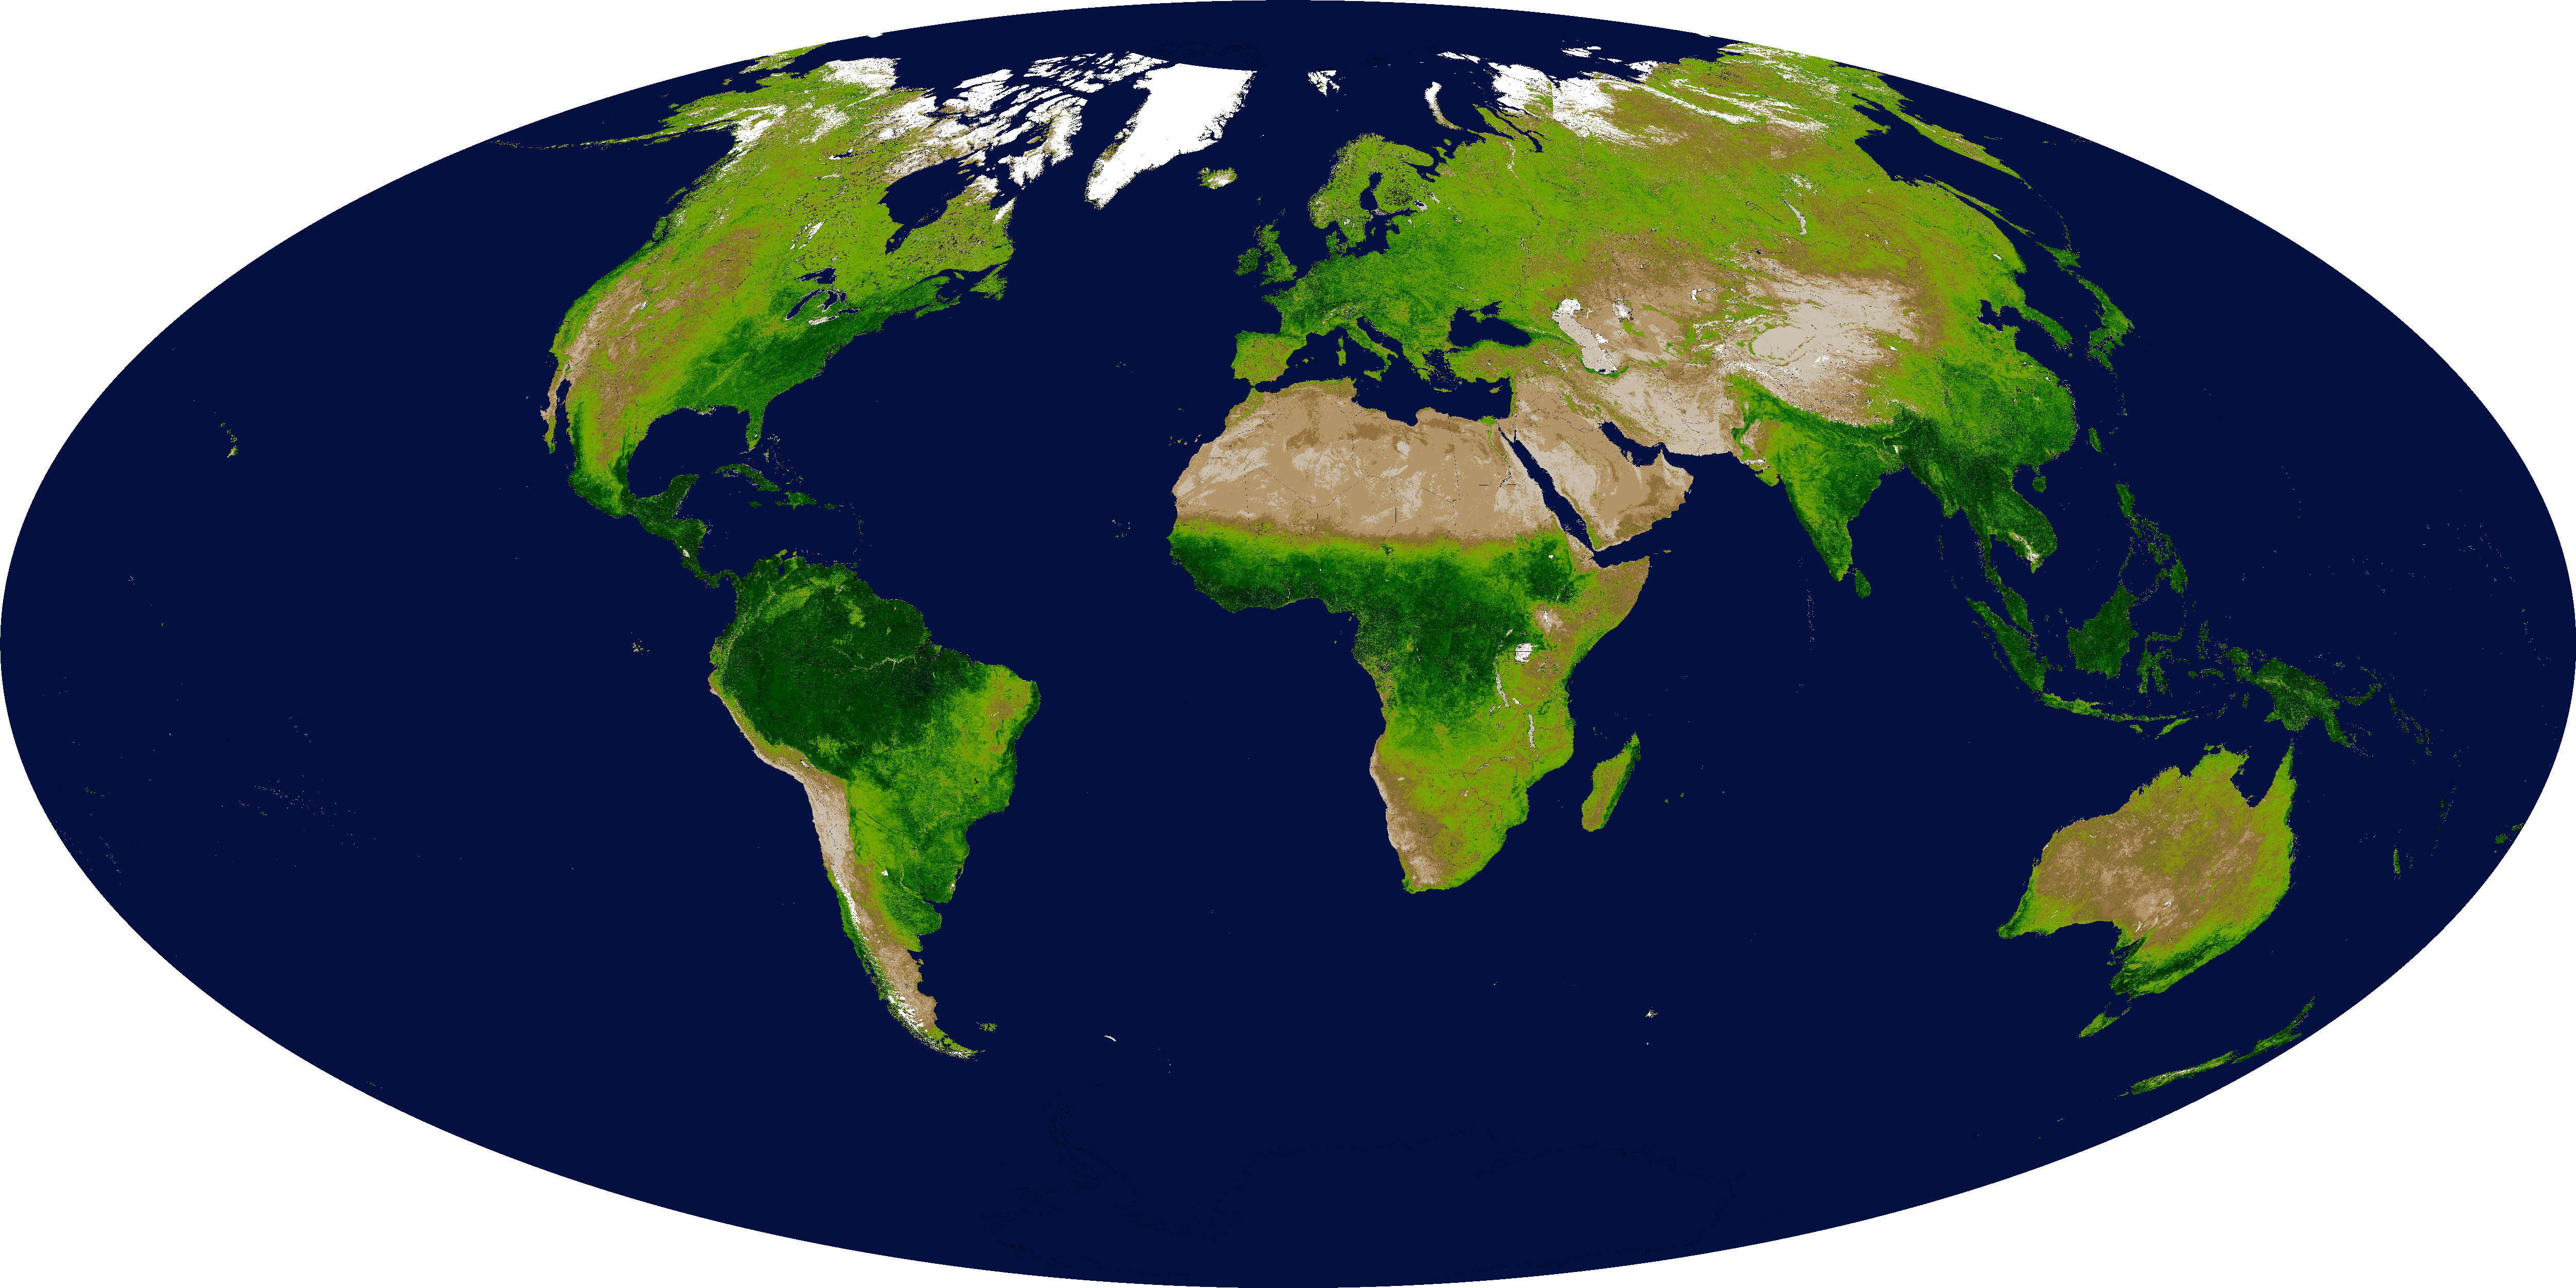
Global Enhanced Vegetation Index
Summary
This map shows the
distribution of plant growth over the entire globe
in October 2001. The colors have the following significance:

- white and brown — barren areas of rock, sand, or snow
- light greens — shrub and grassland
- dark greens — temperate and tropical rainforests
The coloring is based on measurements of the wavelengths and intensity
of visible and near-infrared light reflected by the land surface into
space as captured by the Moderate-resolution Imaging Spectroradiometer
(MODIS) on NASA’s Terra satellite.
Click on the thumbnail to the right for a pair of similar satellite maps that show variation by season.
Source
Image 2183[2] from Visible Earth: A catalog of NASA images and animations of our home planet.
![[2]](http://veimages.gsfc.nasa.gov/2183/modis_EVI_2000_fall_lrg.jpg)
Image courtesy MODIS Land Group/Vegetation Indices, Alfredo Huete,
Principal Investigator, and Kamel Didan, University of Arizona.
Terms of Use
For all non-private uses, NASA’s Terms Of Use are as follows:[3]
- The imagery is free of licensing fees
- NASA requires that they be provided a credit as the owners of the imagery
The Visible Earth team requests, but does not require:
- The Visible Earth be provided a credit as the location that the imagery was found at
- A URL be provided, either to the Visible Earth (http://visibleearth.nasa.gov/) or to the page providing the link to the used image.