
Caption
Enjoying the Sun Safely
Summary
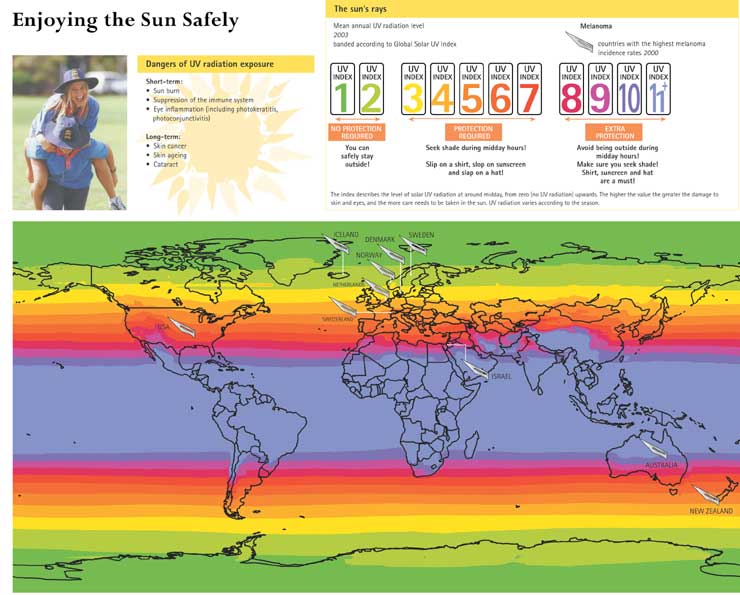
This infographic includes a color-coded map of the world that shows the mean annual UV radiation level in 2003 (banded according to Global Solar UV Index). It also shows countries with the highest melanoma incidence rates in 2000.
Legend:
- UV Index 1-2: No protection required
- UV Index 3-4-5-6-7: Protection required (“Slip on a shirt, slop on sunscreen and slap a hat!”)
- UV Index 8-9-10-11+: Extra protection required (“Avoid being outside during mid-day hours! Make sure you seek shade!. Shirt, sunscreen and hat are a must!”)
A more detailed version of this infographic [1] makes these observations:
- “The discovery of a hole in the ozone layer over the Antarctic in 1985 sounded the alarm. Chlorofluorocarbons (CFCs), and other industrial chemicals released into the atmosphere, were destroying the stratospheric ozone, which shields the Earth from harmful ultraviolet (UV) radiation from the sun.”
- “Children are most at risk, as exposure to the sun during childhood appears to set the stage for the development of skin cancer later in life.”
Source
Inheriting the World: The Atlas of Children’s Health and the Environment, Part Three: A look to the future. By Bruce Gordon, Richard Mackay and Eva Rehfuess, World Health Organization, 2004.
ISBN 92 4 159156 0.
Copyright
© WHO 2004. All rights reserved.
Series
This map is one in a series:
- Malaria, 2004
- Passive Smoking: Children Protest, 1999-2003
- Traditional Hazards, New Risks, c. 2002
- Two Worlds: Rich and Poor, 2004
- Water for All: Making it Happen, c. 2002
- The World’s Forgotten Children, 1970-2000
- Lead: IQ Alert, c. 2002
- Child Labor: Growing Up Too Quickly, c. 2004
- Indoor Smoke: Breaking Down Respiratory Defences, c. 2000
- Healthy Schools: Empowering Children, 2001-2003
- Climate Change, 1970-2050
- Enjoying the Sun Safely, c. 2000