
Caption
Caribbean Casualties due to Hurricanes, 2004
Summary
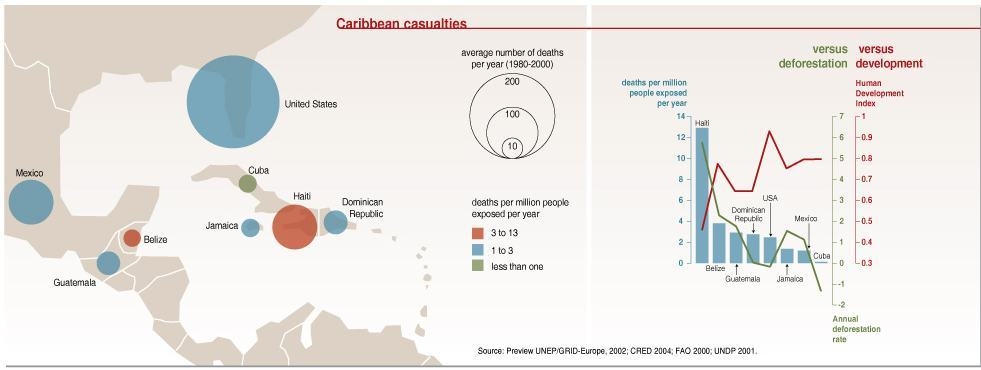
This map shows the number of casualties in the Caribbean and Florida caused by hurricanes and tropical storms. The circles indicate the average number of deaths per year between 1980 and 2000, and the color of the circles shows the number of deaths per million people exposed per year.
Graphs comparing the affected deforestation rates and the human development rates are additionally provided.
Due to the disaster caused by the hurricane season, the tourist industry, one of the primary revenues of income in the Caribbean, was negatively affected.
Source
United Nations Environment Programme / GRID-Arendal[1]
Cartographer/Designer: Emmanuelle Bournay, UNEP/GRID-Arendal
Primary Source:
- Preview UNEP/GRID-Europe, 2002
- CRED 2004
- FAO 2000
- UNDP 2001
Copyright
© 2006 UNEP / GRID-Arendal
Licensing
For use constraints, see [2].
Series
This map is one in a series For a listing with flyovers, see Series:UNEP / GRID-Arendal.