Caption
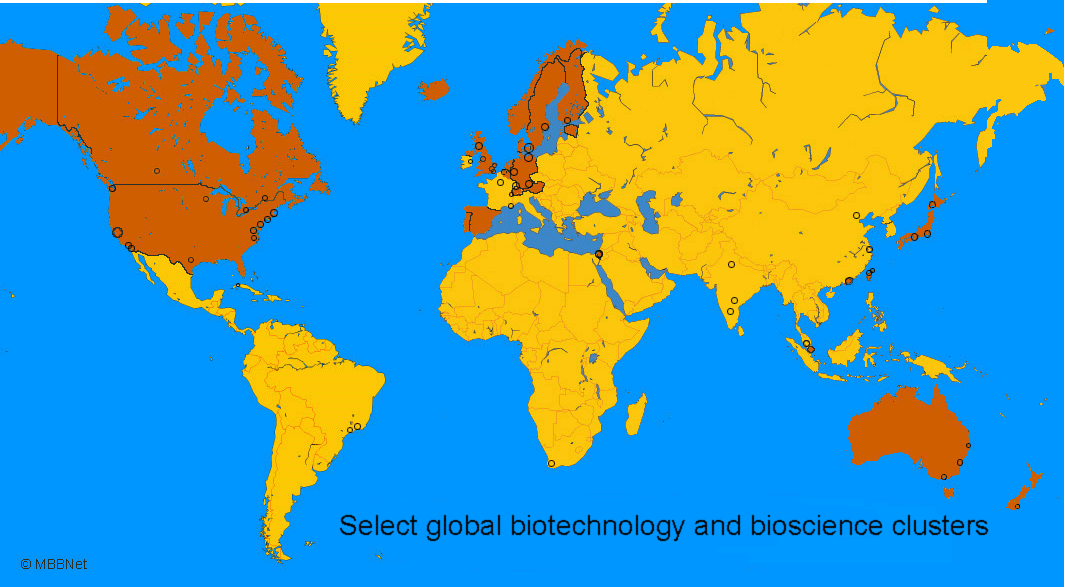
Select global biotechnology and bioscience clusters.
Summary
Countries colored in brown rank highly in the Growth Competitiveness Index 2004 – 2005,
World Economic Forum. Black circles represent select biotechnology and life sciences clusters.
See [1] for further details and
references.
The map uses a Mercator projection that exaggerates the size of areas far from the equator.
A variant of this map appears in
Analysis,
EMBO reports, Vol 7, No. 2, 2006.
(EMBO is the European Molecular Biology Organization.)
Source
http://www.mbbnet.umn.edu/scmap/biotechmap.html
Copyright
Copyright MBBNet, University of Minnesota Medical School.
Disclaimer
“This work is a communications project of William Hoffman, a
non-faculty employee of the University of Minnesota, and not the
University of Minnesota. It is meant to help inform public discussion
of stem cell research and human development.”

