
Caption
World Forecast, 2015
Summary
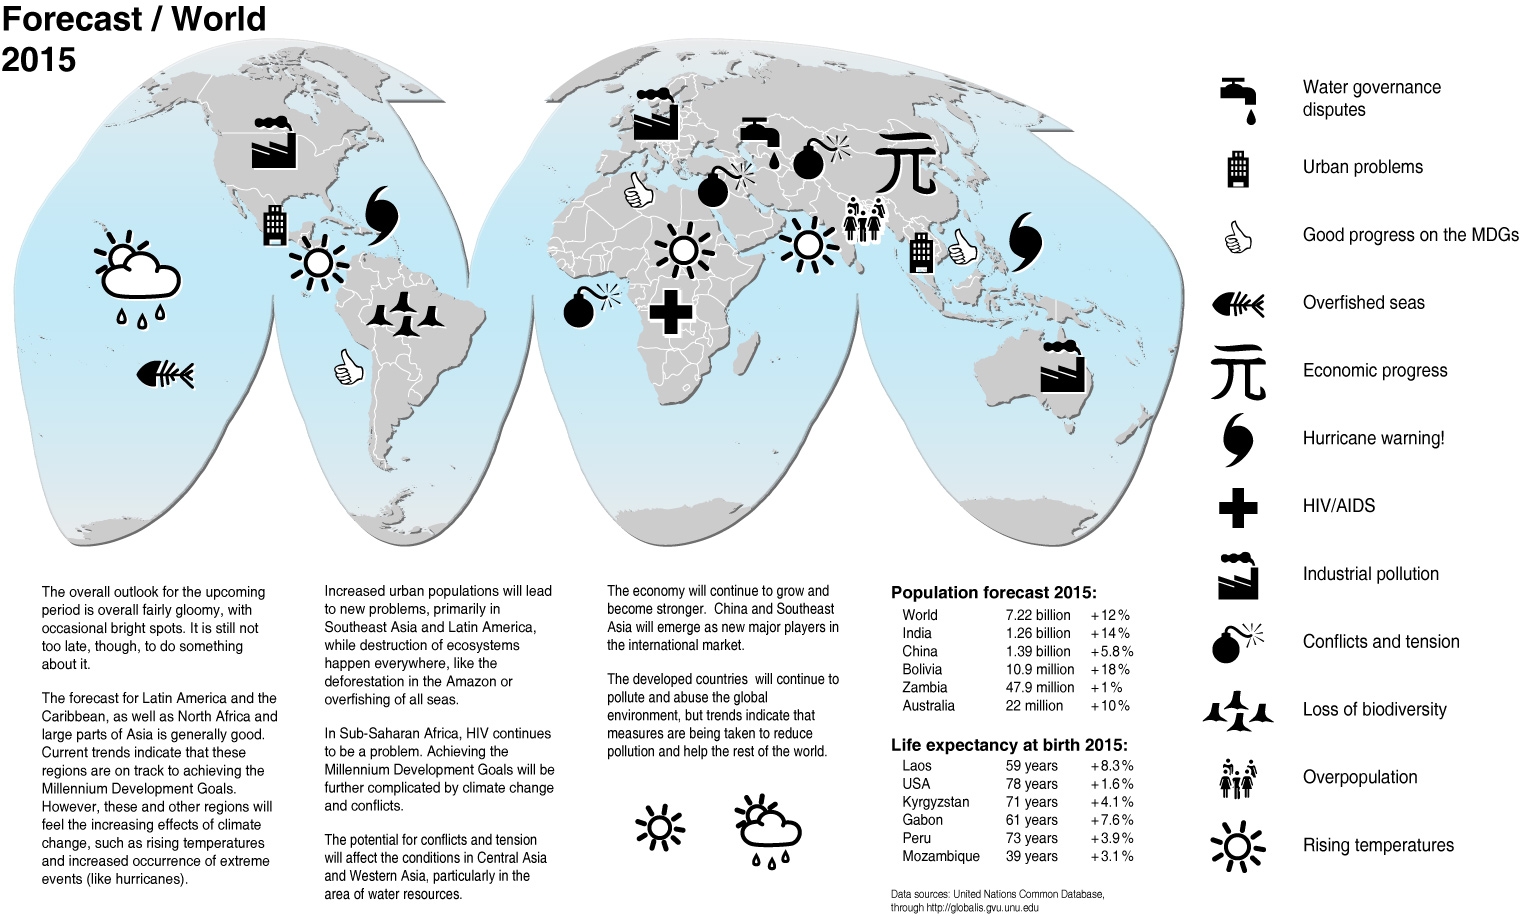
This infographic presents a forecast for the state of the world in 2015 in a format that mimics a weather forecast. Icons for locating the following “hot-spots”” are defined:
- water governance disputes
- urban problems
- progress on the MDGs (Millennium Development Goals)
- overfished seas
- economic progress
- hurricanes
- HIV/AIDS
- industrial pollution
- conflicts and tension
- loss of biodiversity
- overpopulation
- rising temperatures
Inset tables provide forecasts of population and life expectancy at birth in 2015 for the world and a handful of countries. The accompanying narrative includes regional forecasts.
Source
United Nations Environment Programme / GRID-Arendal[1]
Cartographer/Designer: Hugo Ahlenius, UNEP/GRID-Arendal
Copyright
© 2006 UNEP / GRID-Arendal
Licensing
Used with permission.
For use constraints, see [2].
Series
This map is one in a series For a listing with flyovers, see Series:UNEP / GRID-Arendal.