
Caption
Population and Resources, 1998
Summary
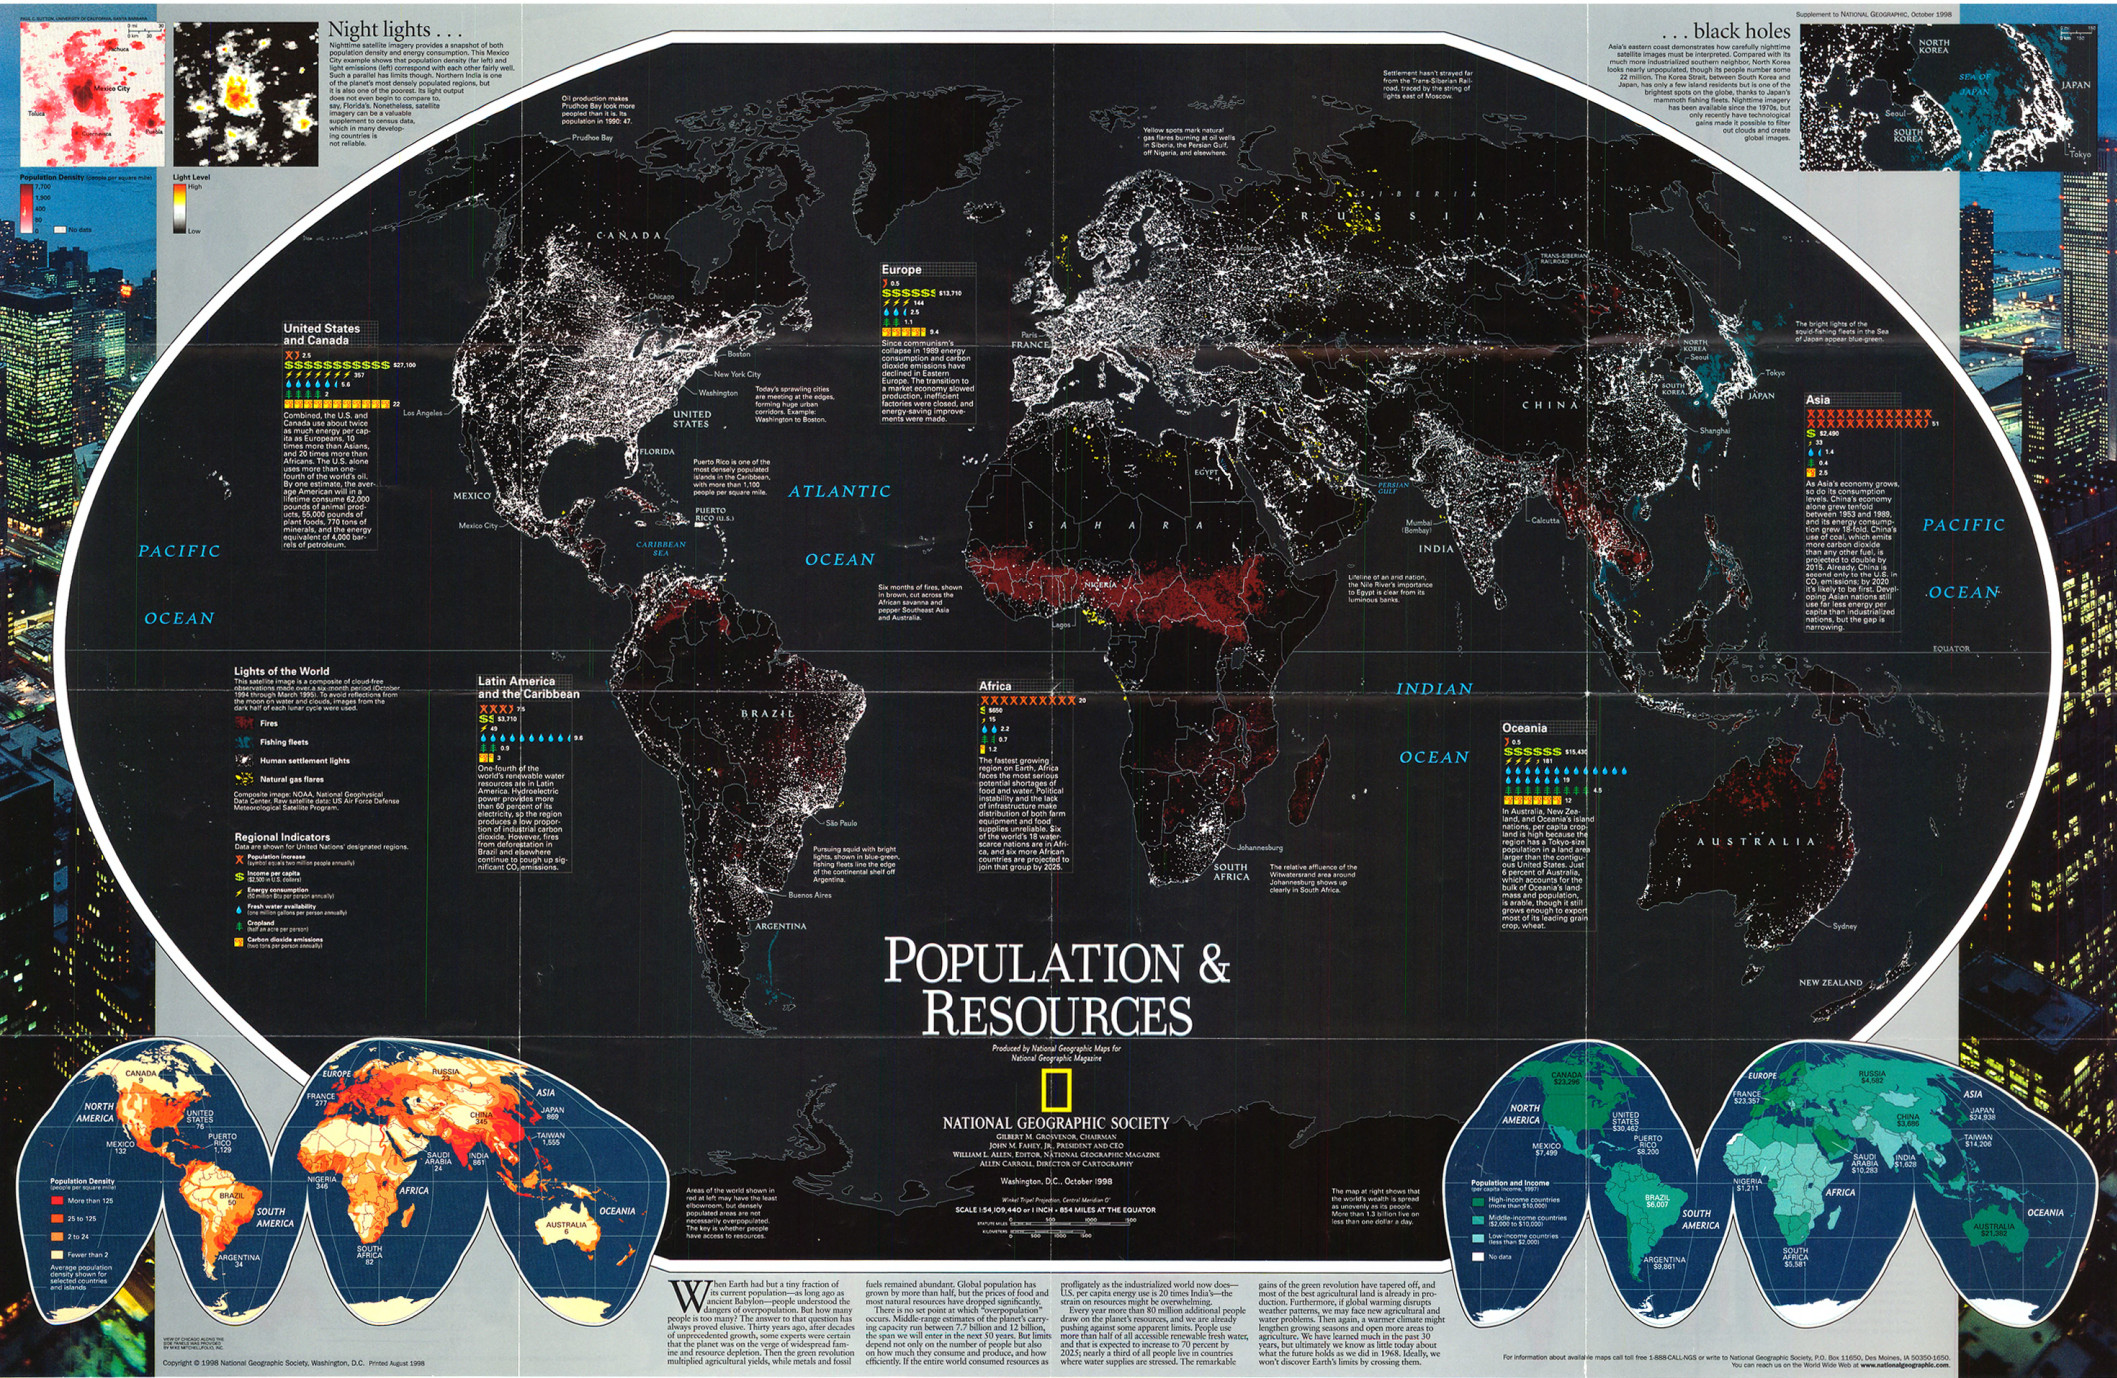
The main map on this poster is based on a satellite image showing the view of the world at night.
The map is colored to distinguish between fires, fishing fleets, human settlement lights,
and natural gas flares.
Two additional maps show:
- “Population Density” (bottom left) showing people per square mile.
- “Population and Income” (bottom right) showing per capita income in 1997.
Regional indicators for Africa, Asia, Europe, Latin America and the Caribbean, Oceania, and United States and Canada show:
- Population increase (symbol equals two million people annually)
- Income per capita (2,500 in U.S. dollars)
- Energy consumption (50 million cal. per person annually)
- Fresh water availability (one million gallons per person annually)
- Cropland (half an acre per person)
- Carbon dioxide emissions (two tons per person annually)
Source
Produced by National Geographic Maps for National Geographic Magazine, Millennium in Maps: Population, Washington, D.C., 1998.
This map is in the collection of copyrighted maps of the Geosciences and Map Library, Fine Hall (B level), Princeton University.
Call number: G3201.E29.1998.N3 (b)
Copyright
© 1998 National Geographic Society, Washington, D.C.
Series
This map is one in a series: