
Caption

Note: Google Earth Version 4 is required.
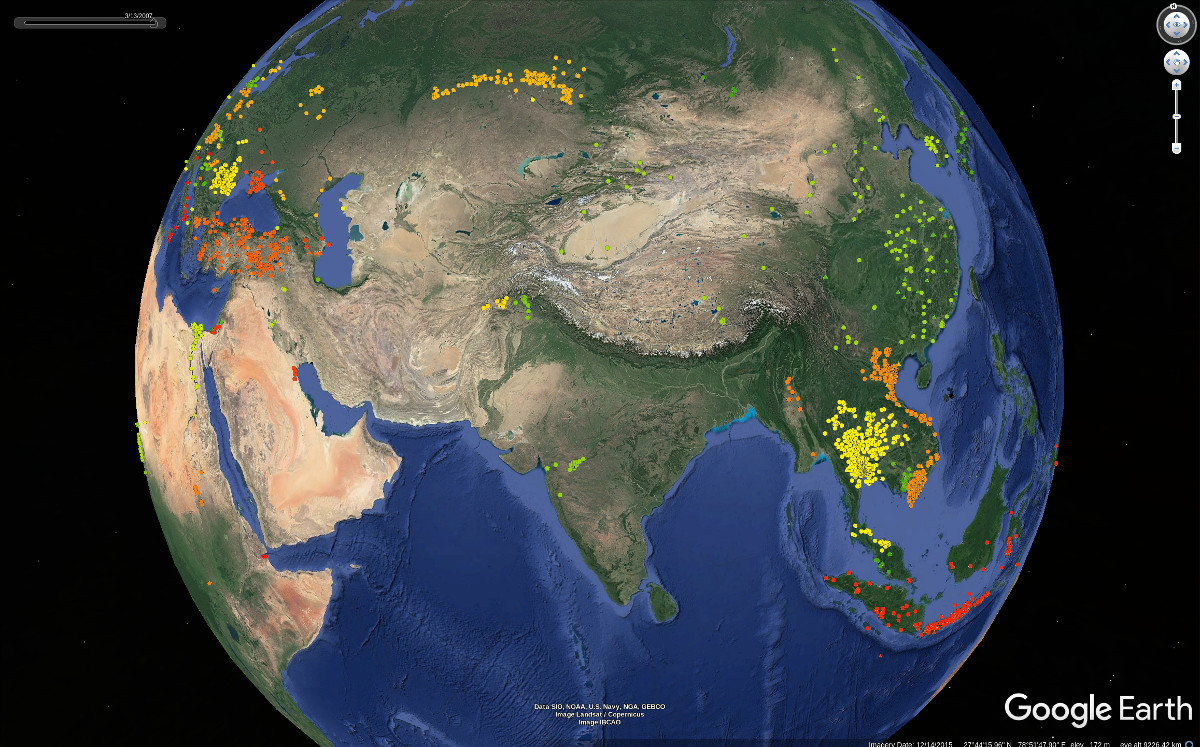
Summary
This map uses Google Earth’s time series animation feature to show outbreaks of avian flu.
One may select outbreaks in humans and/or birds. Human and poultry population density layers are
also provided.
Instructions
Once the data file has been opened in Google Earth, you can start the animation by clicking on the “Play” button (the right arrow to the right of the timeline at the top of the main window in Google Earth).
Source
Data sources: