
Caption
Annual Energy Consumption and Major Coal, Natural Gas, and Oil Deposits
Summary
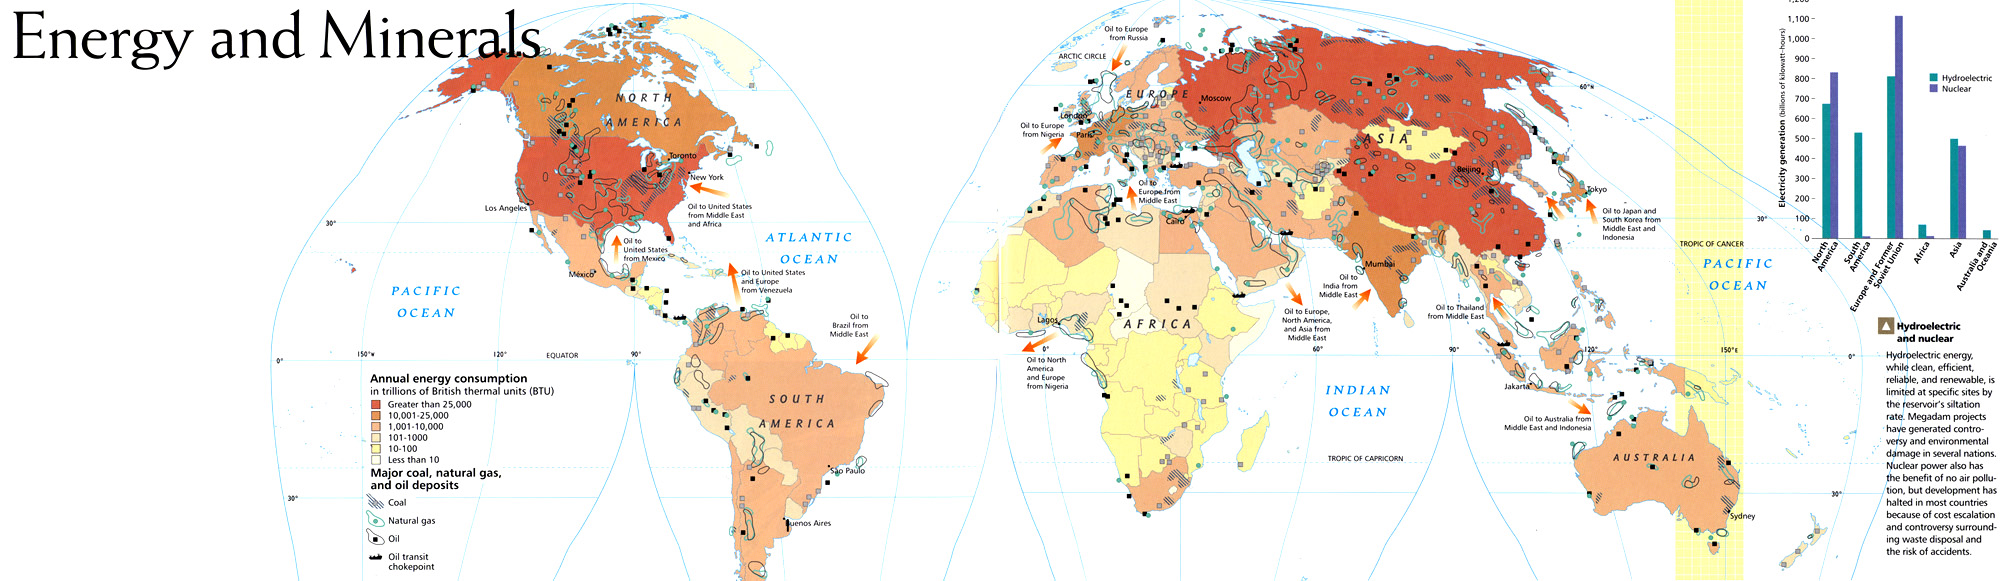
This color-coded map of the world shows annual energy consumption.
Legend:
- Pomegranate: Greater than 25,000 trillion BTUs
- Tangerine: 10,000-25,000
- Peach-orange: 1,000-10,000
- Peach: 101-1,000
- Cream: 10-100
- Beige: Less than 10
Most important coal, natural gas, oil and oil transit chokepoints are also indicated.
In addition, a graph and an explanation of regional hydroelectric and nuclear energy are provided.
Source
National Geographic Atlas of the World, Eigth Edition. Published by the National Geographic Society. Prepared by National Geographic Maps for The Book Division, 2005.
Copyright
© 2005 National Geographic Society. All rights reserved.
Series
This map is one in a series:
- Image:Language Tapestry c. 2004.jpg
- Image:MG©Energy and Minerals, 2005.jpg
- Image:MG©Regional Trade Agreements, 2005.jpg
- Image:MG©Flow of Oil in the World, 2005.jpg
- Image:MG©World Grains, 2005.jpg
- Image:MG©World Debt, 2005.jpg
- Image:MG©World Forests, 2005.jpg
- Image:MG©Inter-Region Agricultural Trade, 2005.jpg
- Image:MG©Tourist Arrivals Worldwide, 2005.jpg
- Image:MG©The Internet Explosion, 2003.jpg
- Image:MG©Average daily per capita calorie consumption, 2005.jpg
- Image:MG©Connecting the Planet – Cables and Satellites, 2004.jpg
- Image:MG©Gross Domestic Product, 2005.jpg
- Image:MG©Labor Migration, 2005.jpg
- Image:MG©Chemical, Biological and Nuclear Weapons, 2005.jpg
- Image:MG©Political regimes, 2005.jpg
- Image:MG©Human Trafficking, 2005.jpg
- Image:MG©Peacebuilding, 2005.jpg
- Image:MG©International Migration, 2004.jpg
- Image:MG©Terrorism, 1995-2003.jpg