
Caption
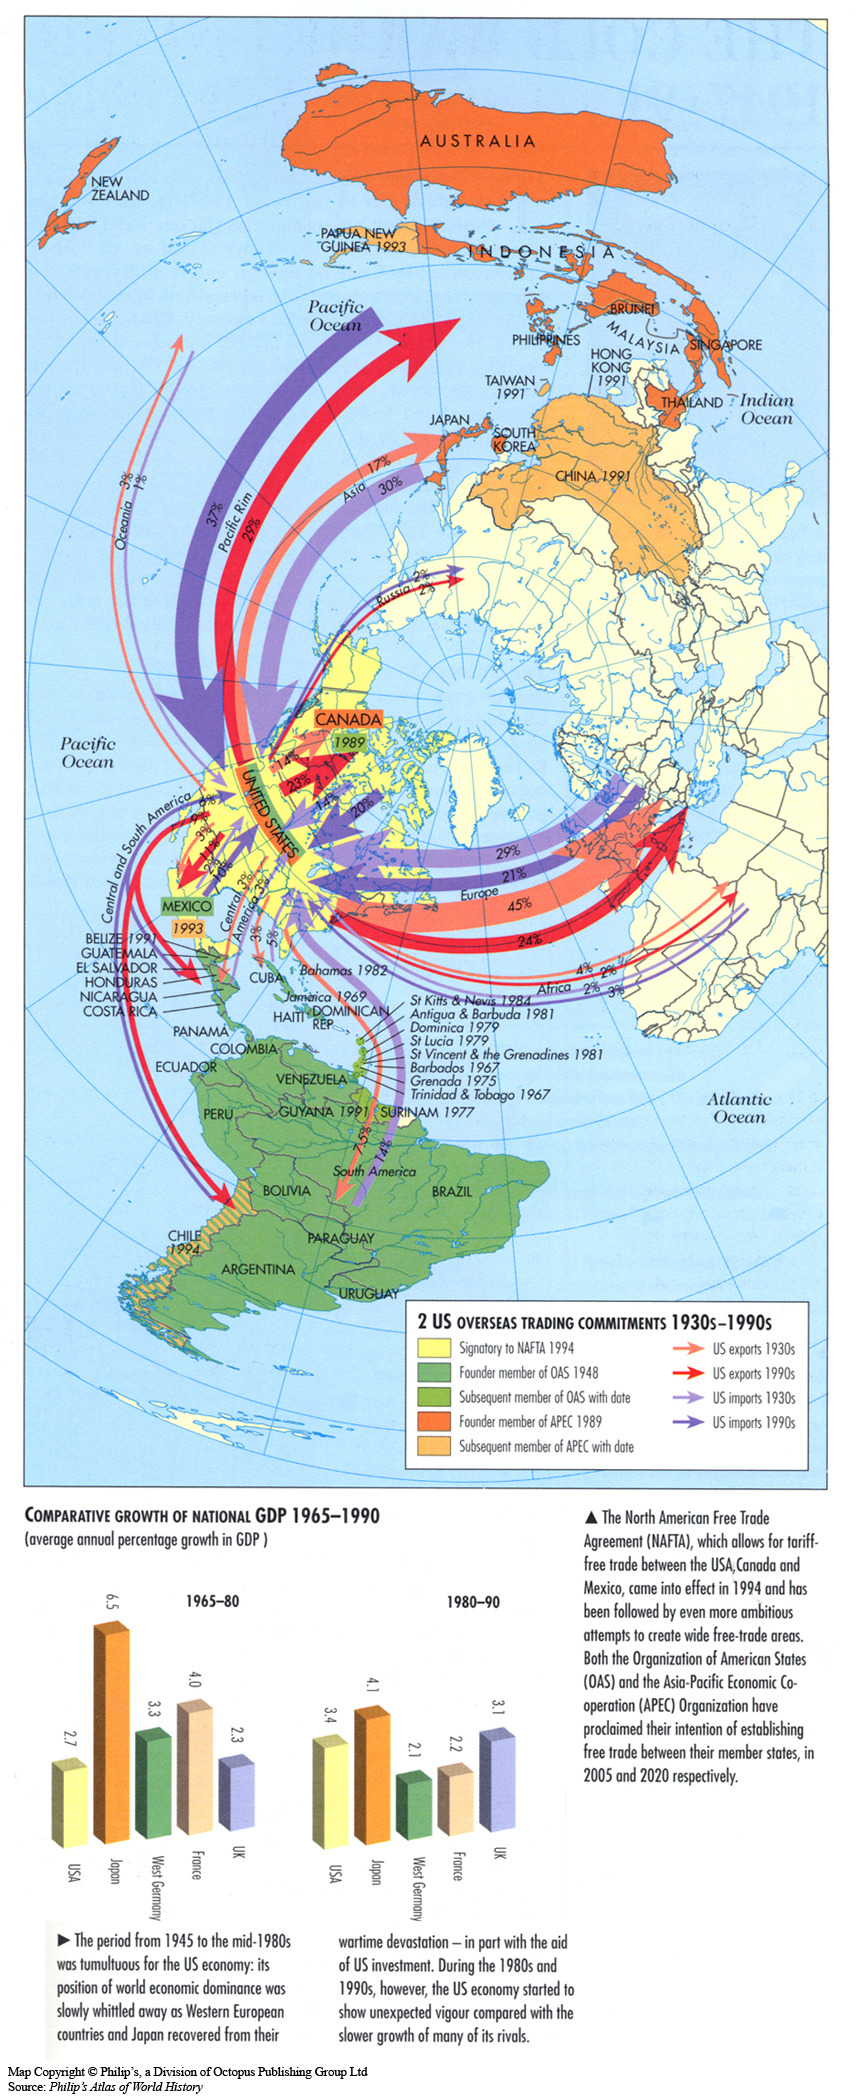
US Overseas Trading Commitments 1930s-1990s
Summary
This globe shows trade agreements with the US from the 1930s to the 1990s.
US routes of exports and imports from the two decades, the 1930s and the 1990s, are also indicated.
===Inset===
Caption: Comparative Growth of National GDP 1965-1990
This bar graph shows the National GDP growth from 1965 to 1990.
Source
Oxford Atlas of World History, Oxford University Press, 1999. General Editor Patrick K. O’Brien. (p. 243)
Copyright
Map copyright © Philip’s, a division of Octopus Publishing Group Ltd.
Source: Philip’s Atlas of World History
Used under license from Octopus Publishing Group.
Series
This map is one in a series of maps selected from the Oxford Atlas of World History.
A gallery using flyover images like this