
Caption
Urban Population Growth, 1950-2000
Summary
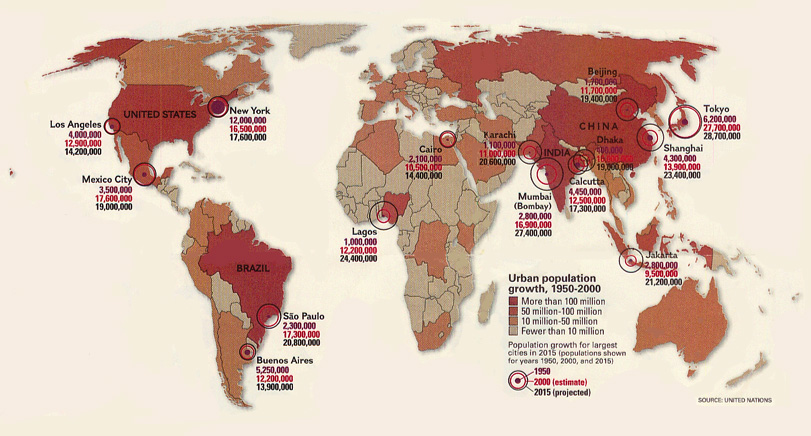
This map shows the trend of urban population growth in the world. Countries are colored according to the absolute growth in their urban populations. The population growth is also indicated for the largest cities in 1950, 2000, and 2015 (projected).
Legend indicates:
- Falu red: More than 100 million
- Carmine: 50 million-100 million
- Copper: 10 million-50 million
- Khaki: Fewer than 10 million
This map is part of a larger map: Image:MG©Cultures, 1999.djvu
Copyright status
©1999 National Geographic Society, Washington D.C. All rights reserved
Source
Millennium in Maps: Cultures, National Geographic Supplement, 1999.
Data source: United Nations