
Caption
Energy Map of the World – Petroleum Economist Energy Maps in association with CHASE
Summary
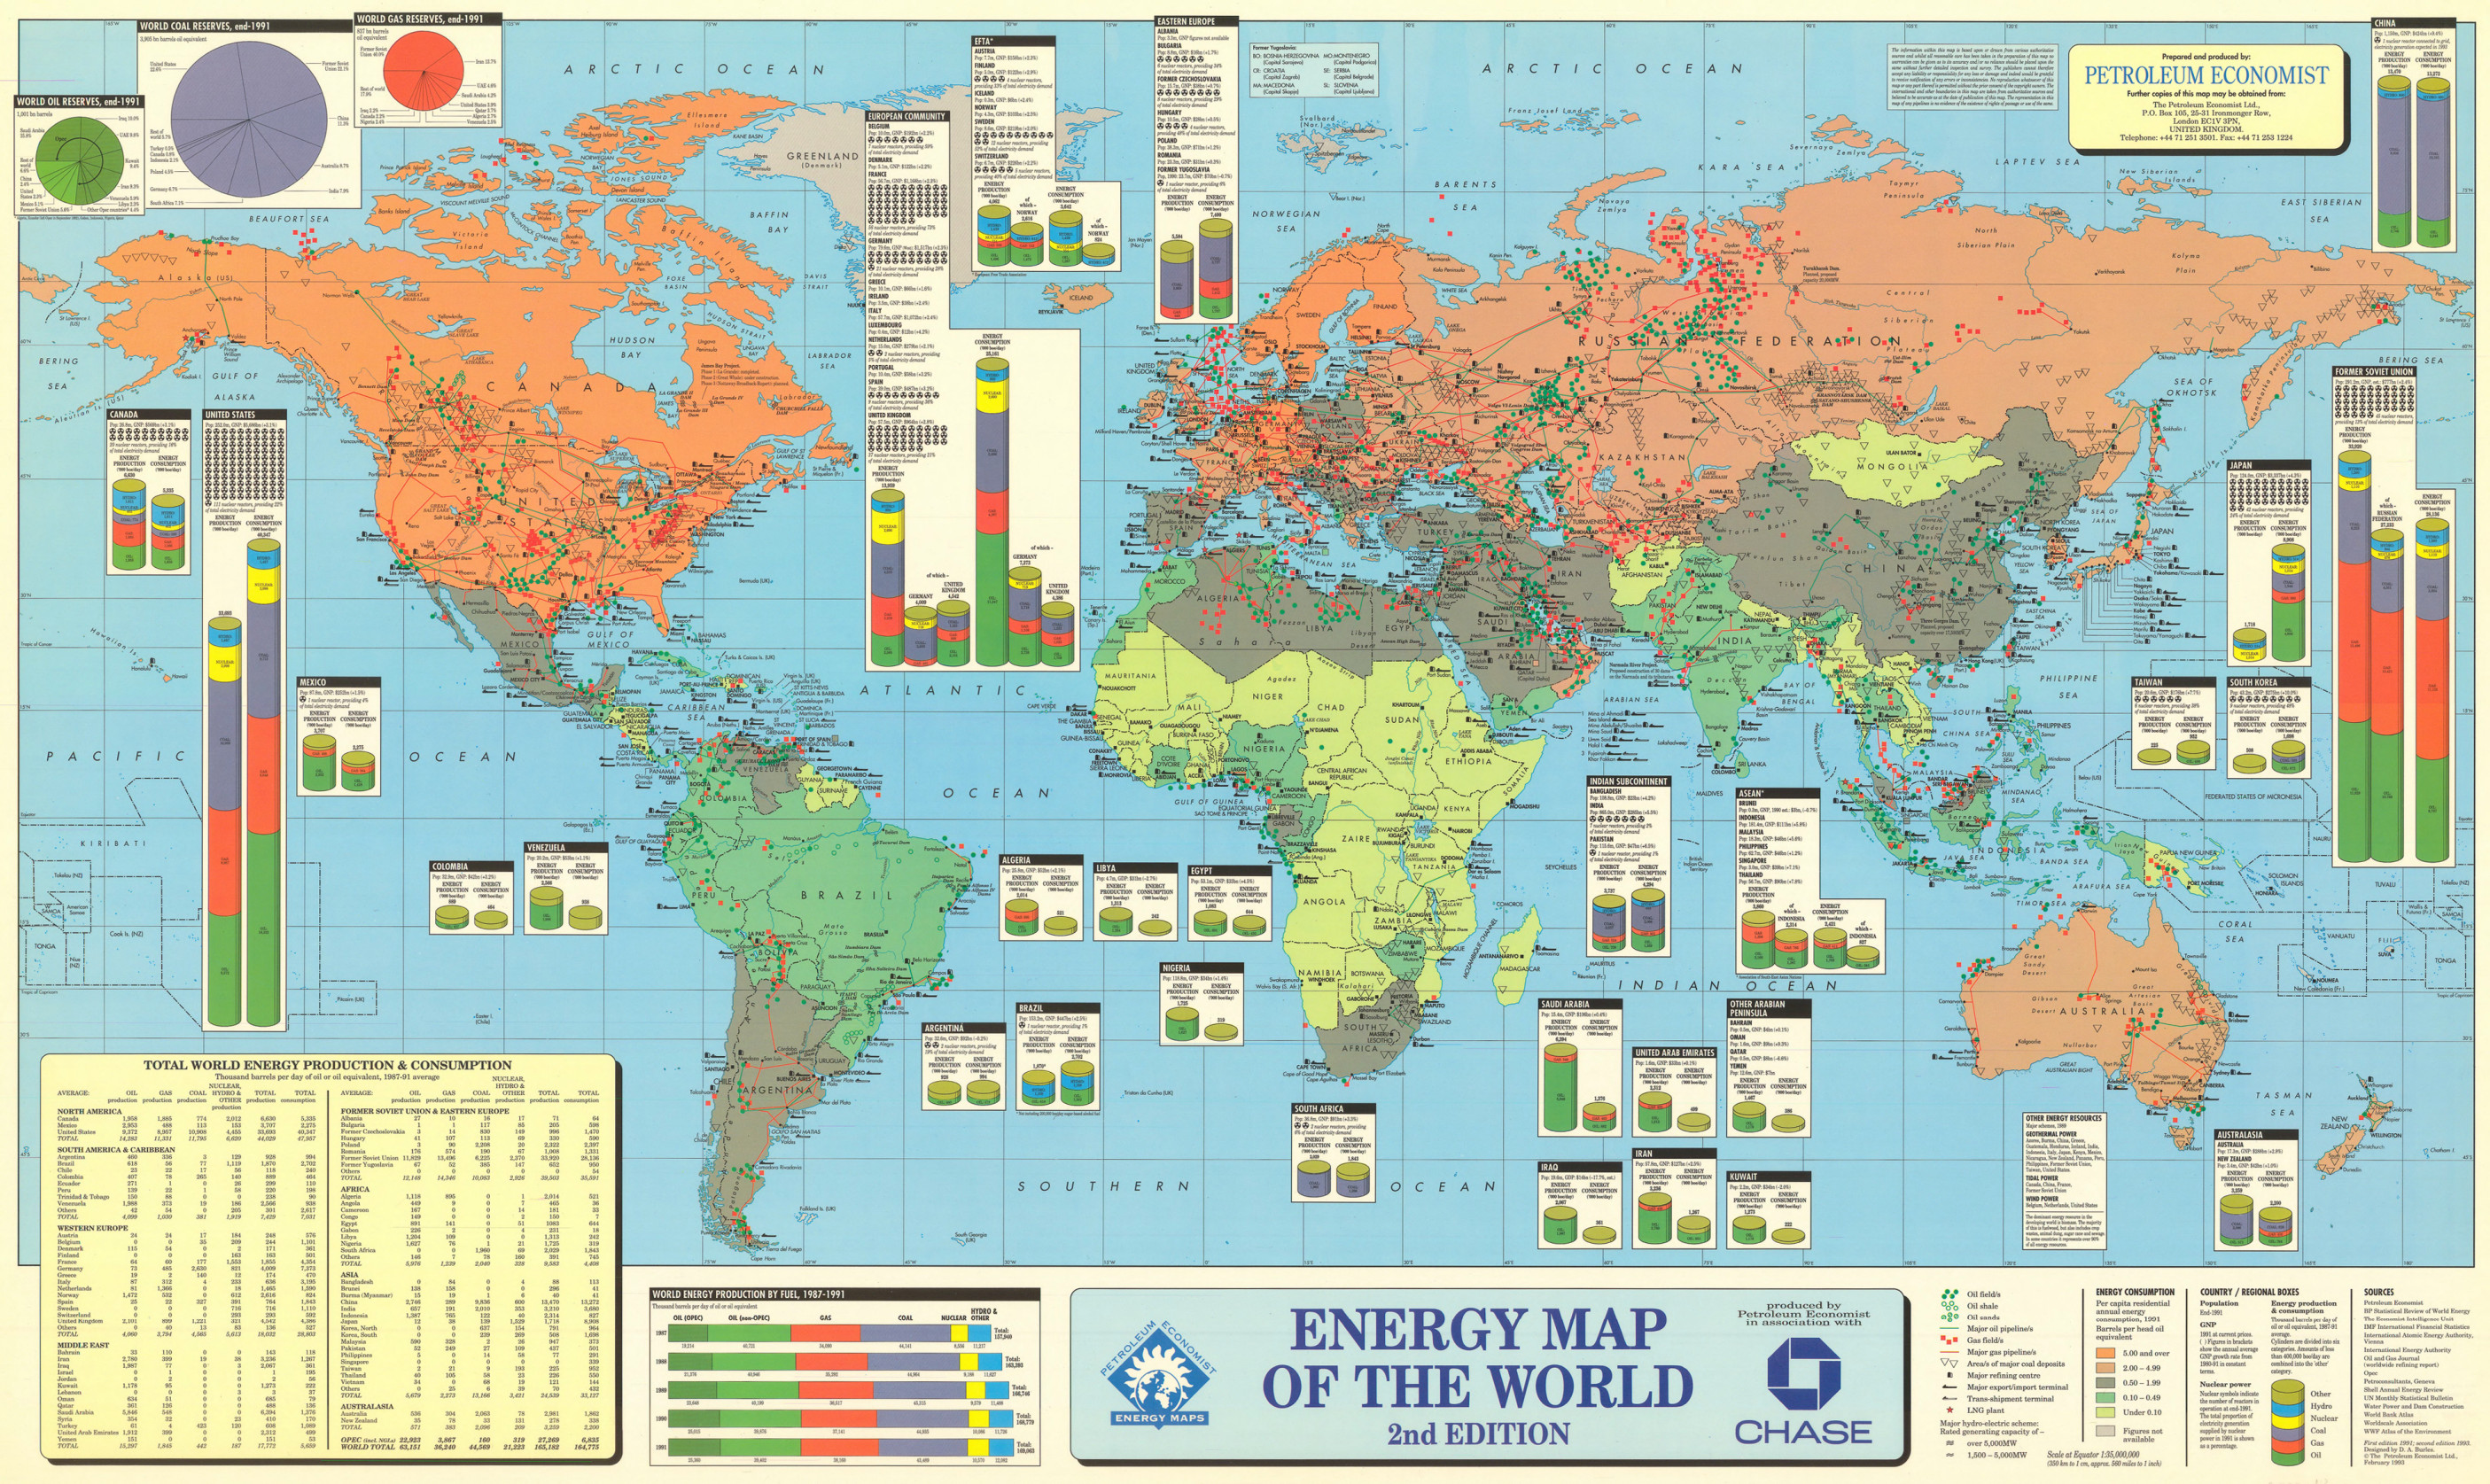
World map shows energy resources for each country in the world, providing lists with names of oil and gas fields and pipelines.
Legend at the bottom indicates for both maps symbols for:
- Oil Field/s
- Oil Shale
- Oil Sand/s
- Major Oil Pipeline/s
- Gas field/s
- Major Gas Pipeline/s
- Area/s of Major Coal Deposits
- Major Refining Centre
- major Export/Import Terminal
- Trans-shipment Terminal
- LNG Plant
Countries are color-keyed according to 1991 per capita residential annual energy consumption.
Barrels per head oil equivalent:
- Orange: 5.00 and over
- Sandy Brown: 2.00-4.99
- Swamp Green: 0.50-1.99
- Kelly Green: 0.10-0.49
- Pear: Under 0.10
- Gray: Figures not available
Country or region inset panels provide graphs and statistics information about energy production and consumption.
These panels indicate population at the end of 1991, annual average Gross National Product growth rate between 1980-91, the number of nuclear reactors in operation by the end of 1991, and energy production and consumption in thousands of barrels per day between 1987-91.
Six categories compound the latter category:
- Olive crab: Other (amounts of less than 400,000 boe/day are combined)
- Dodger blue: Hydro
- Yellow: Nuclear
- Medium purple: Coal
- Pomegranate: Gas
- Kelly green: Oil
World inset panels include graphs and statistical data on: world oil reserves, world coal reserves, and world gas reserves as of end 1991.
A pie graph on world energy production by fuel between 1987-1991, and a table on total world energy production and consumption are additionally provided.
Source
Produced by Petroleum Economist Ltd., in association with CHASE.
Designed by D.A. Burles.
- Other sources:
- BP Statistical Review of World Energy
- The Economist Intelligence Unit
- IMF International Financial Statistics
- International Atomic Energy Authority, Vienna
- International Energy Authority
- Oil and Gas Journal (worldwide refining report)
- Opec
- Petroconsultants, Geneva
- Shell Annual Energy Review
- UN Monthly Statistical Bulletin
- Water Power and Dam Construction
- World Bank Atlas
- Worldscale Association
- WWP Atlas of the Environment
This map is in the collection of copyrighted maps of the Geosciences and Map Library, Fine Hall (B level), Princeton University.
Call number: MC G3201.N3.1993.P4E3
Copyright
© The Petroleum Economist Ltd., February 1993.
Series
This map is one in a series:
- Image:MG©Energy Map of the World, 1993.djvu
- Image:MG©Energy Map of Latin America, 1992.djvu