Category: Assignment 2 (page 2 of 4)

NY 15 Demographic Analysis

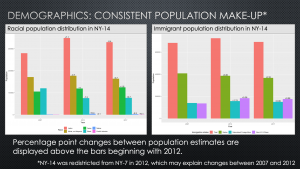
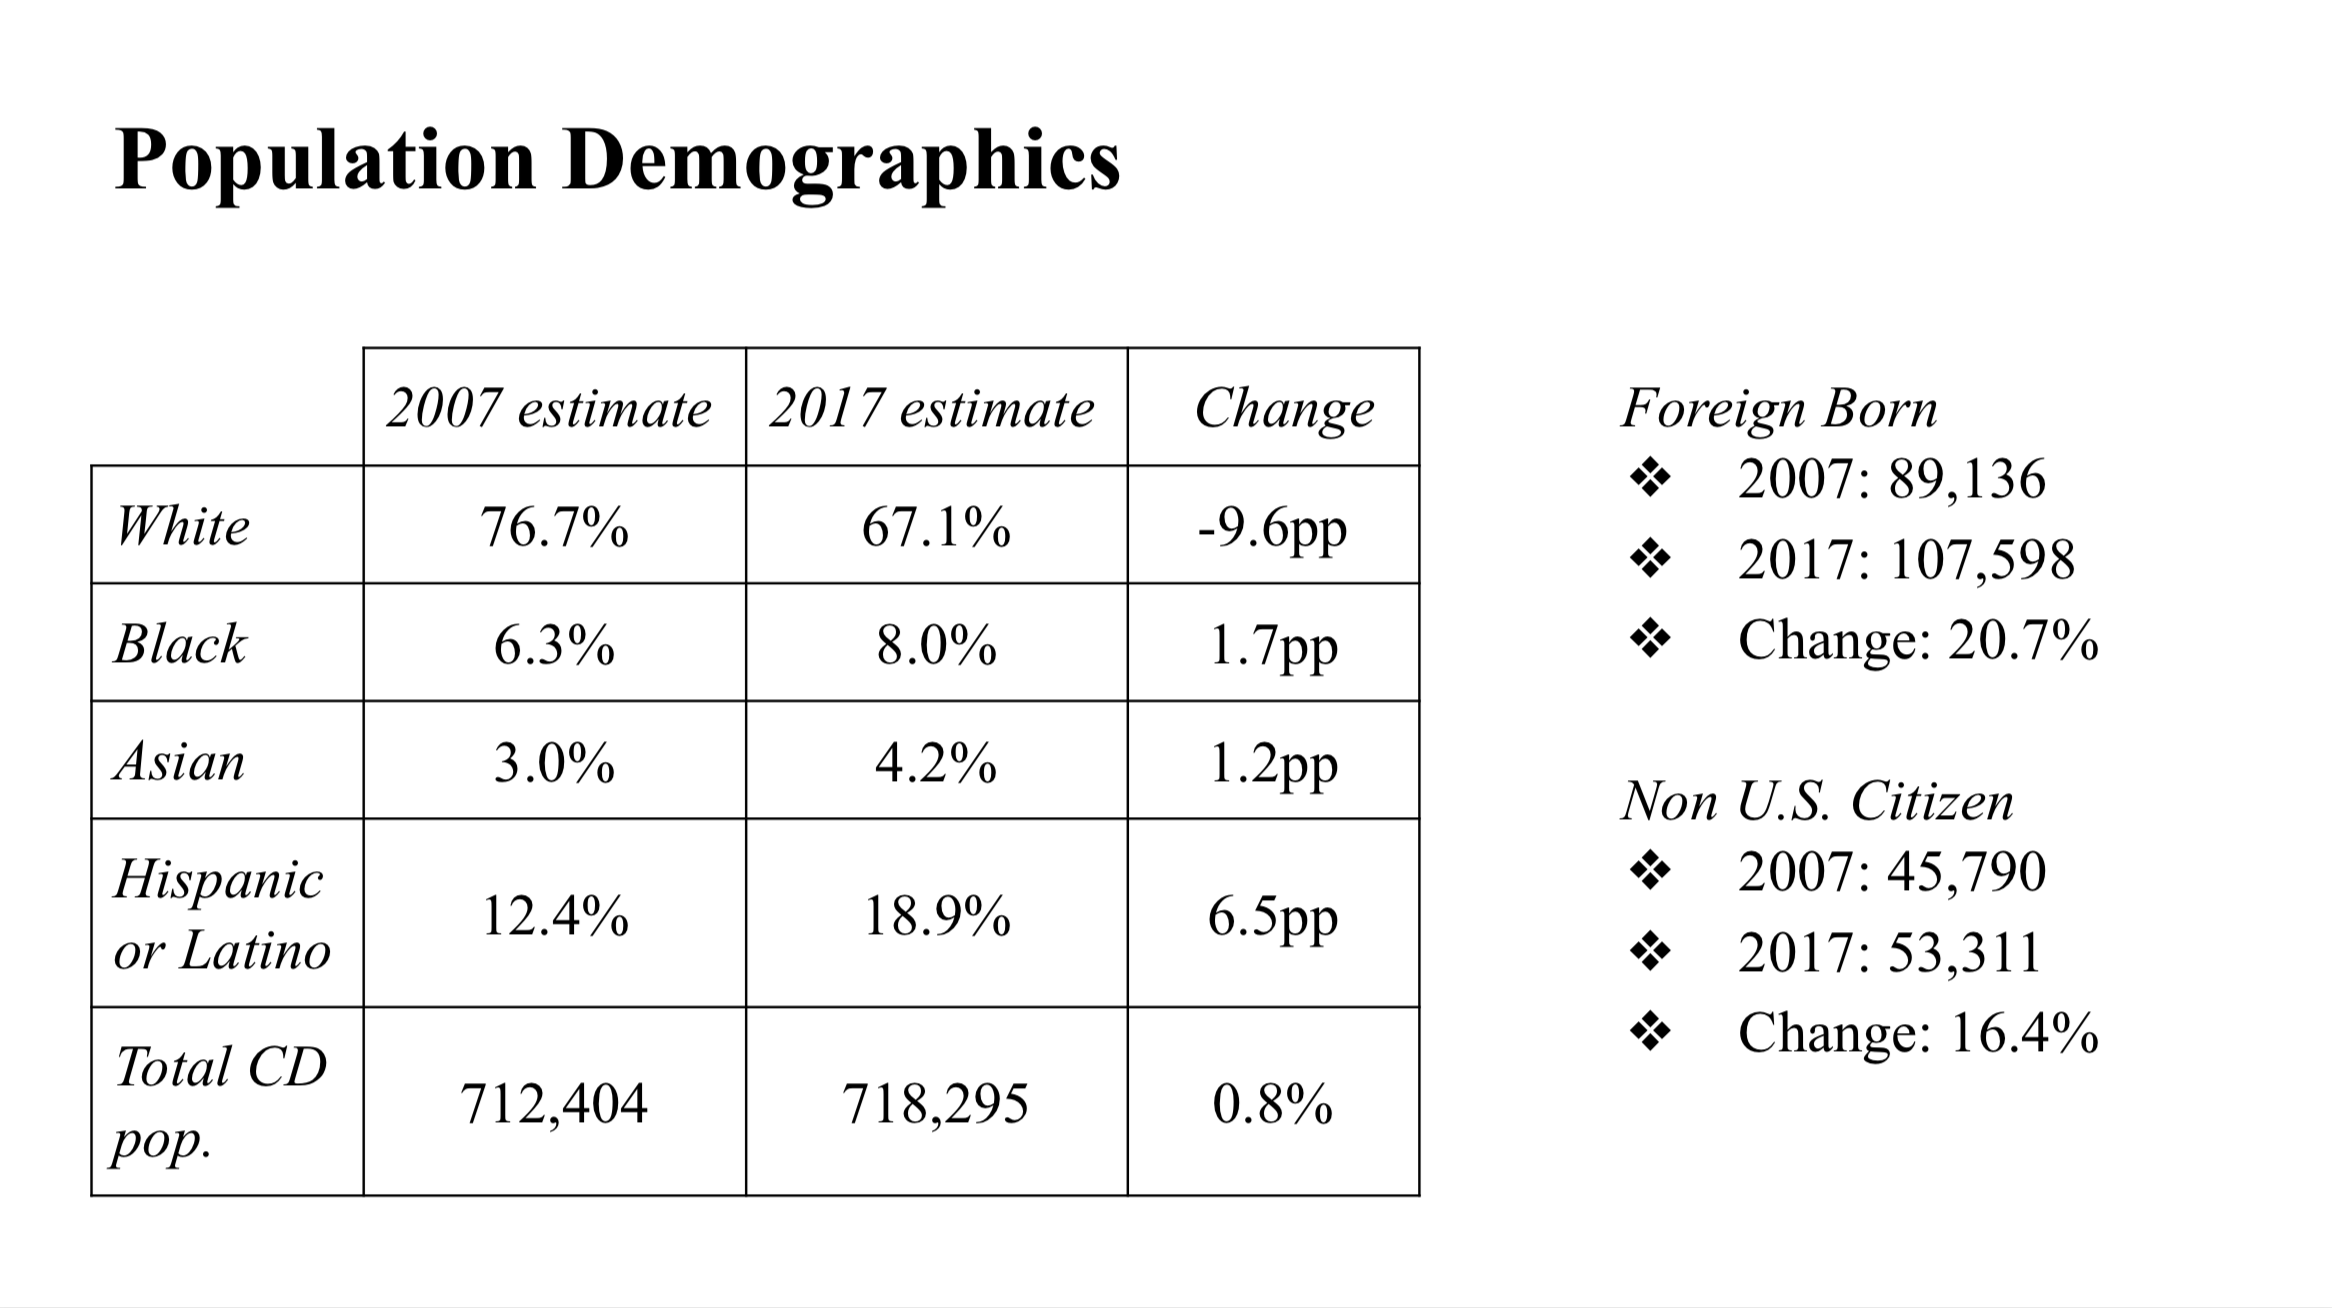
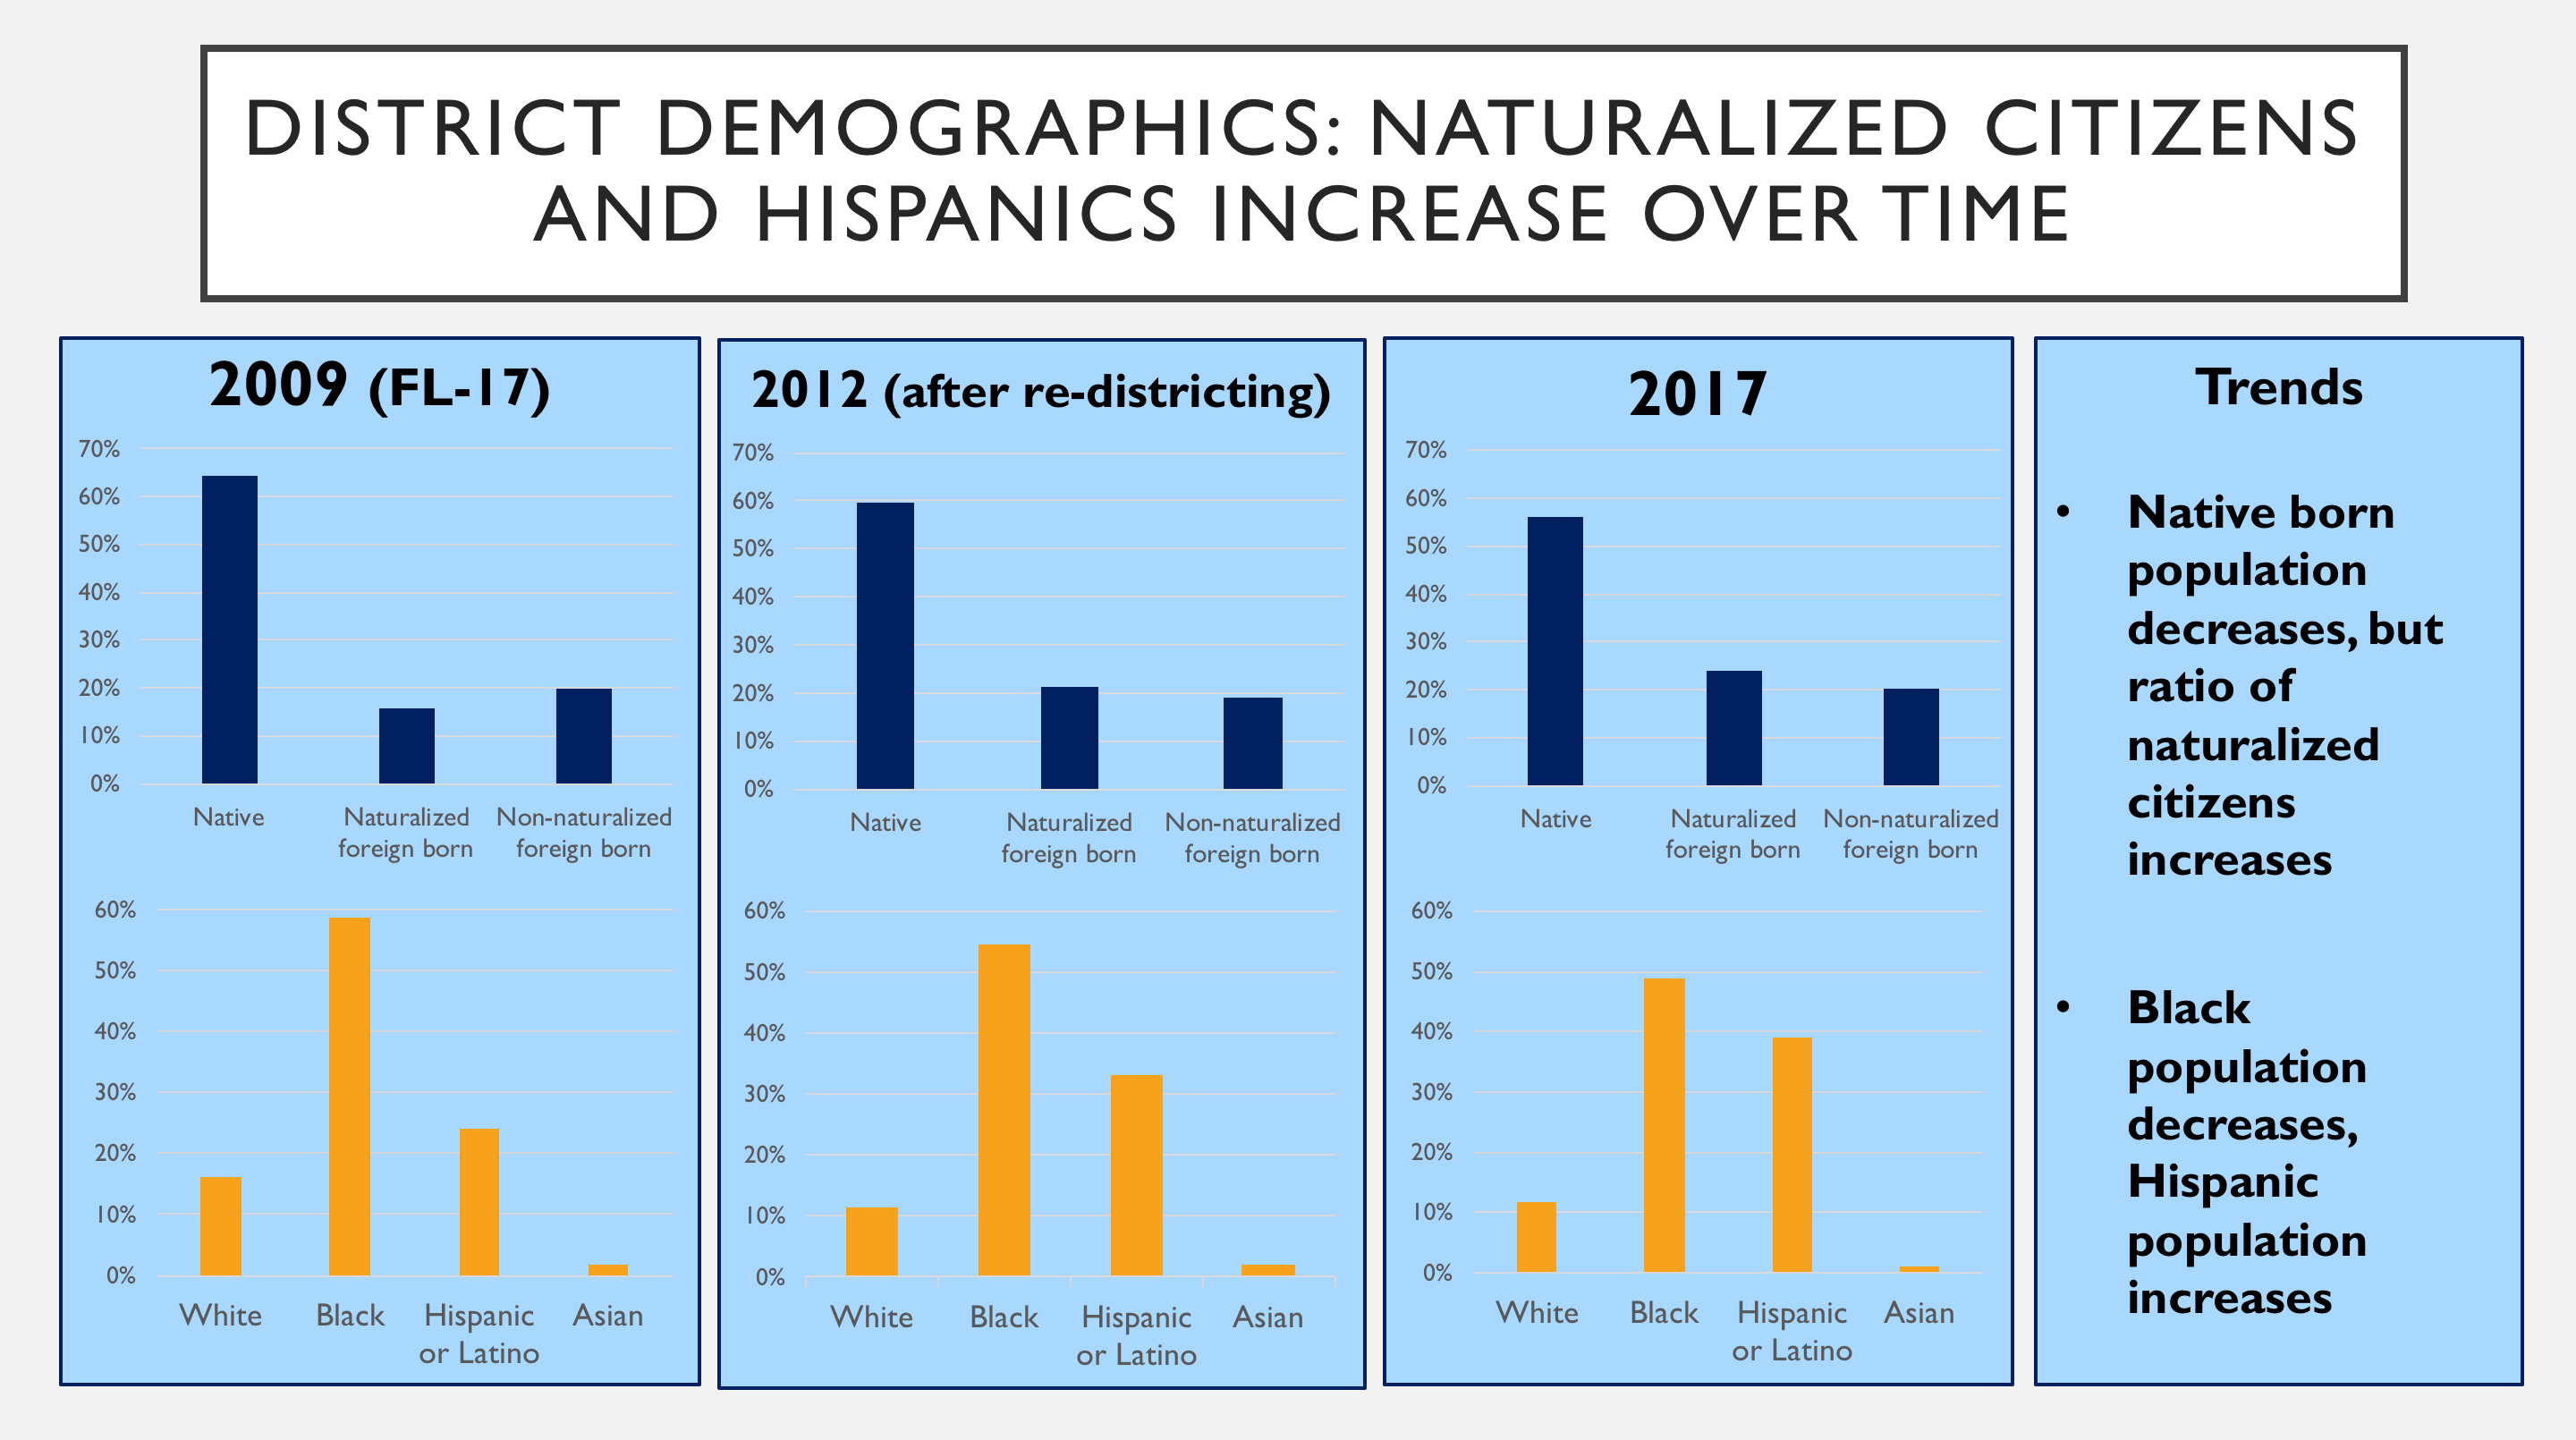
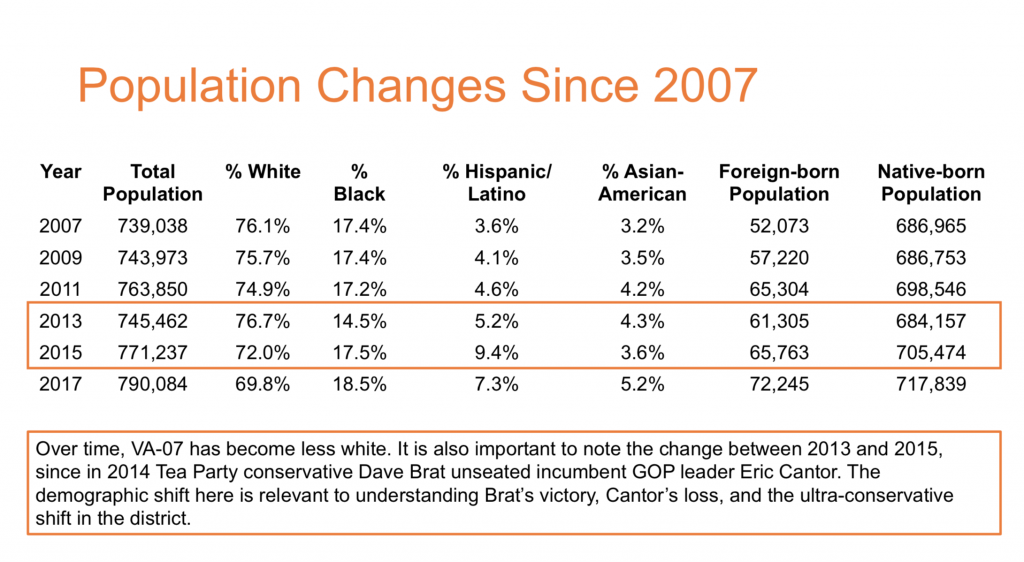
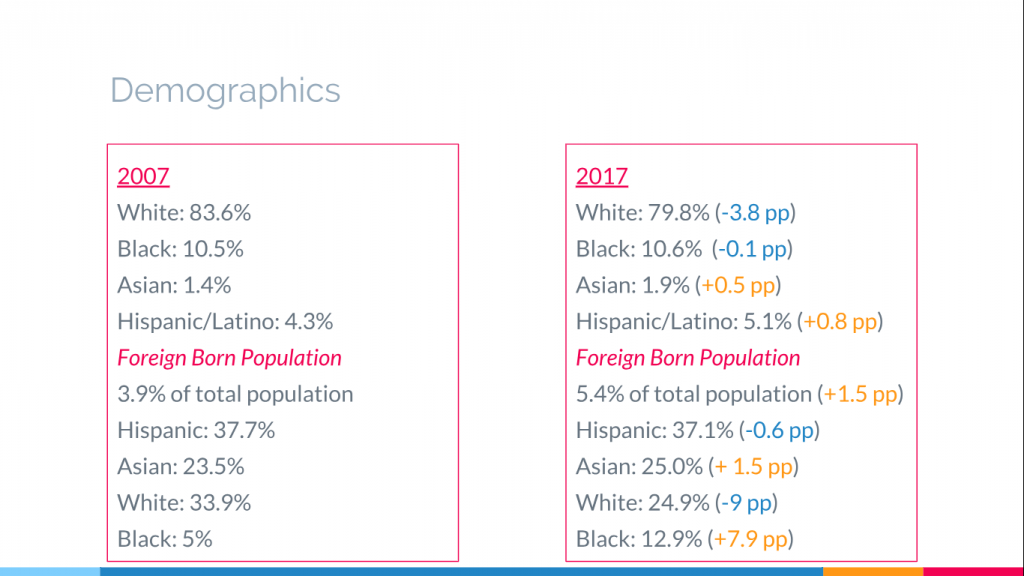
The 15th Congressional District has consistently had a huge Hispanic population and a large foreign-born population. Sonya Sotomayor, the first Latina, supreme court justice proudly comes from the South Bronx in this district. As of 2017, 61.9 % of the population identified as Hispanic ethnicity of any origin, 36.1 % were Black and 2.5% were white. Unfortunately, the demographic data for 2019 and 2018 was not available on the US Census website, so the graphs show the 10 year period from 2007-2017 with intermittent data from 2009, the starting year of interest, 2011, and 2013, the year after redistricting. Before 2012, this area was considered a part of the 16th Congressional District and the statistics presented in the slide come from that district. When the district lines were changed, Jose Serrano, the representative from the 16th district, followed the move becoming the representative of the newly drawn 15th district. As demonstrated on the slide, the Hispanic population has remained consistently high only fluctuating down .4 percentage points since 2017. The Foreign-Born population has grown in the past decade, gaining 5.5 percentage points since 2007.

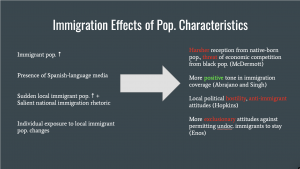
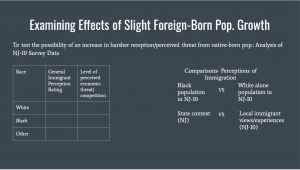
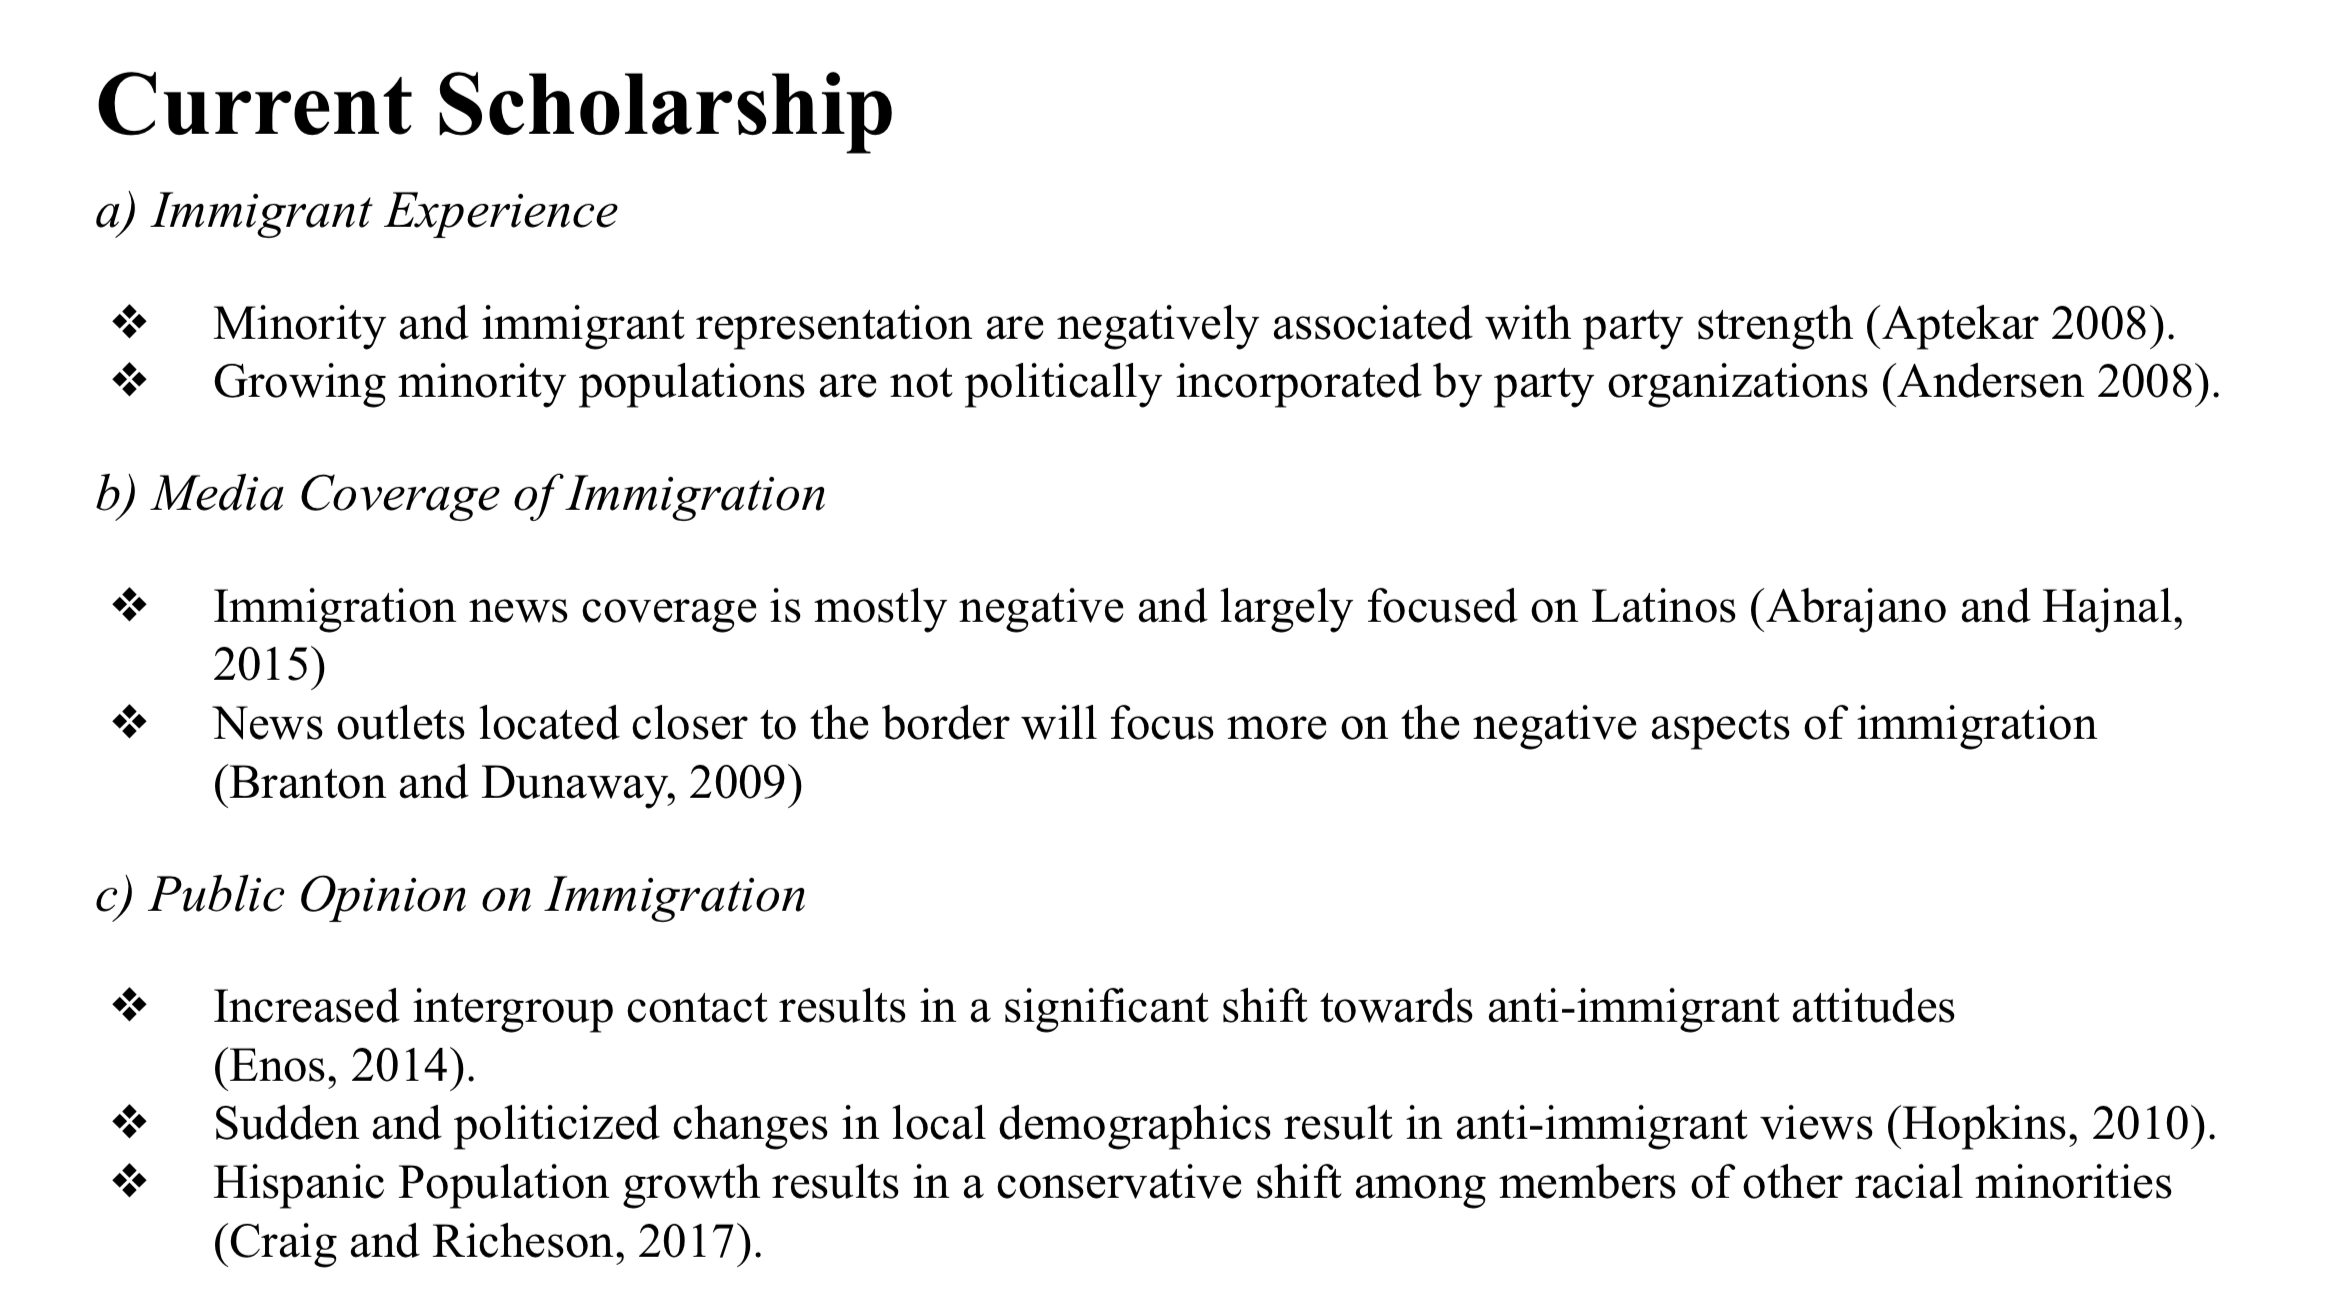
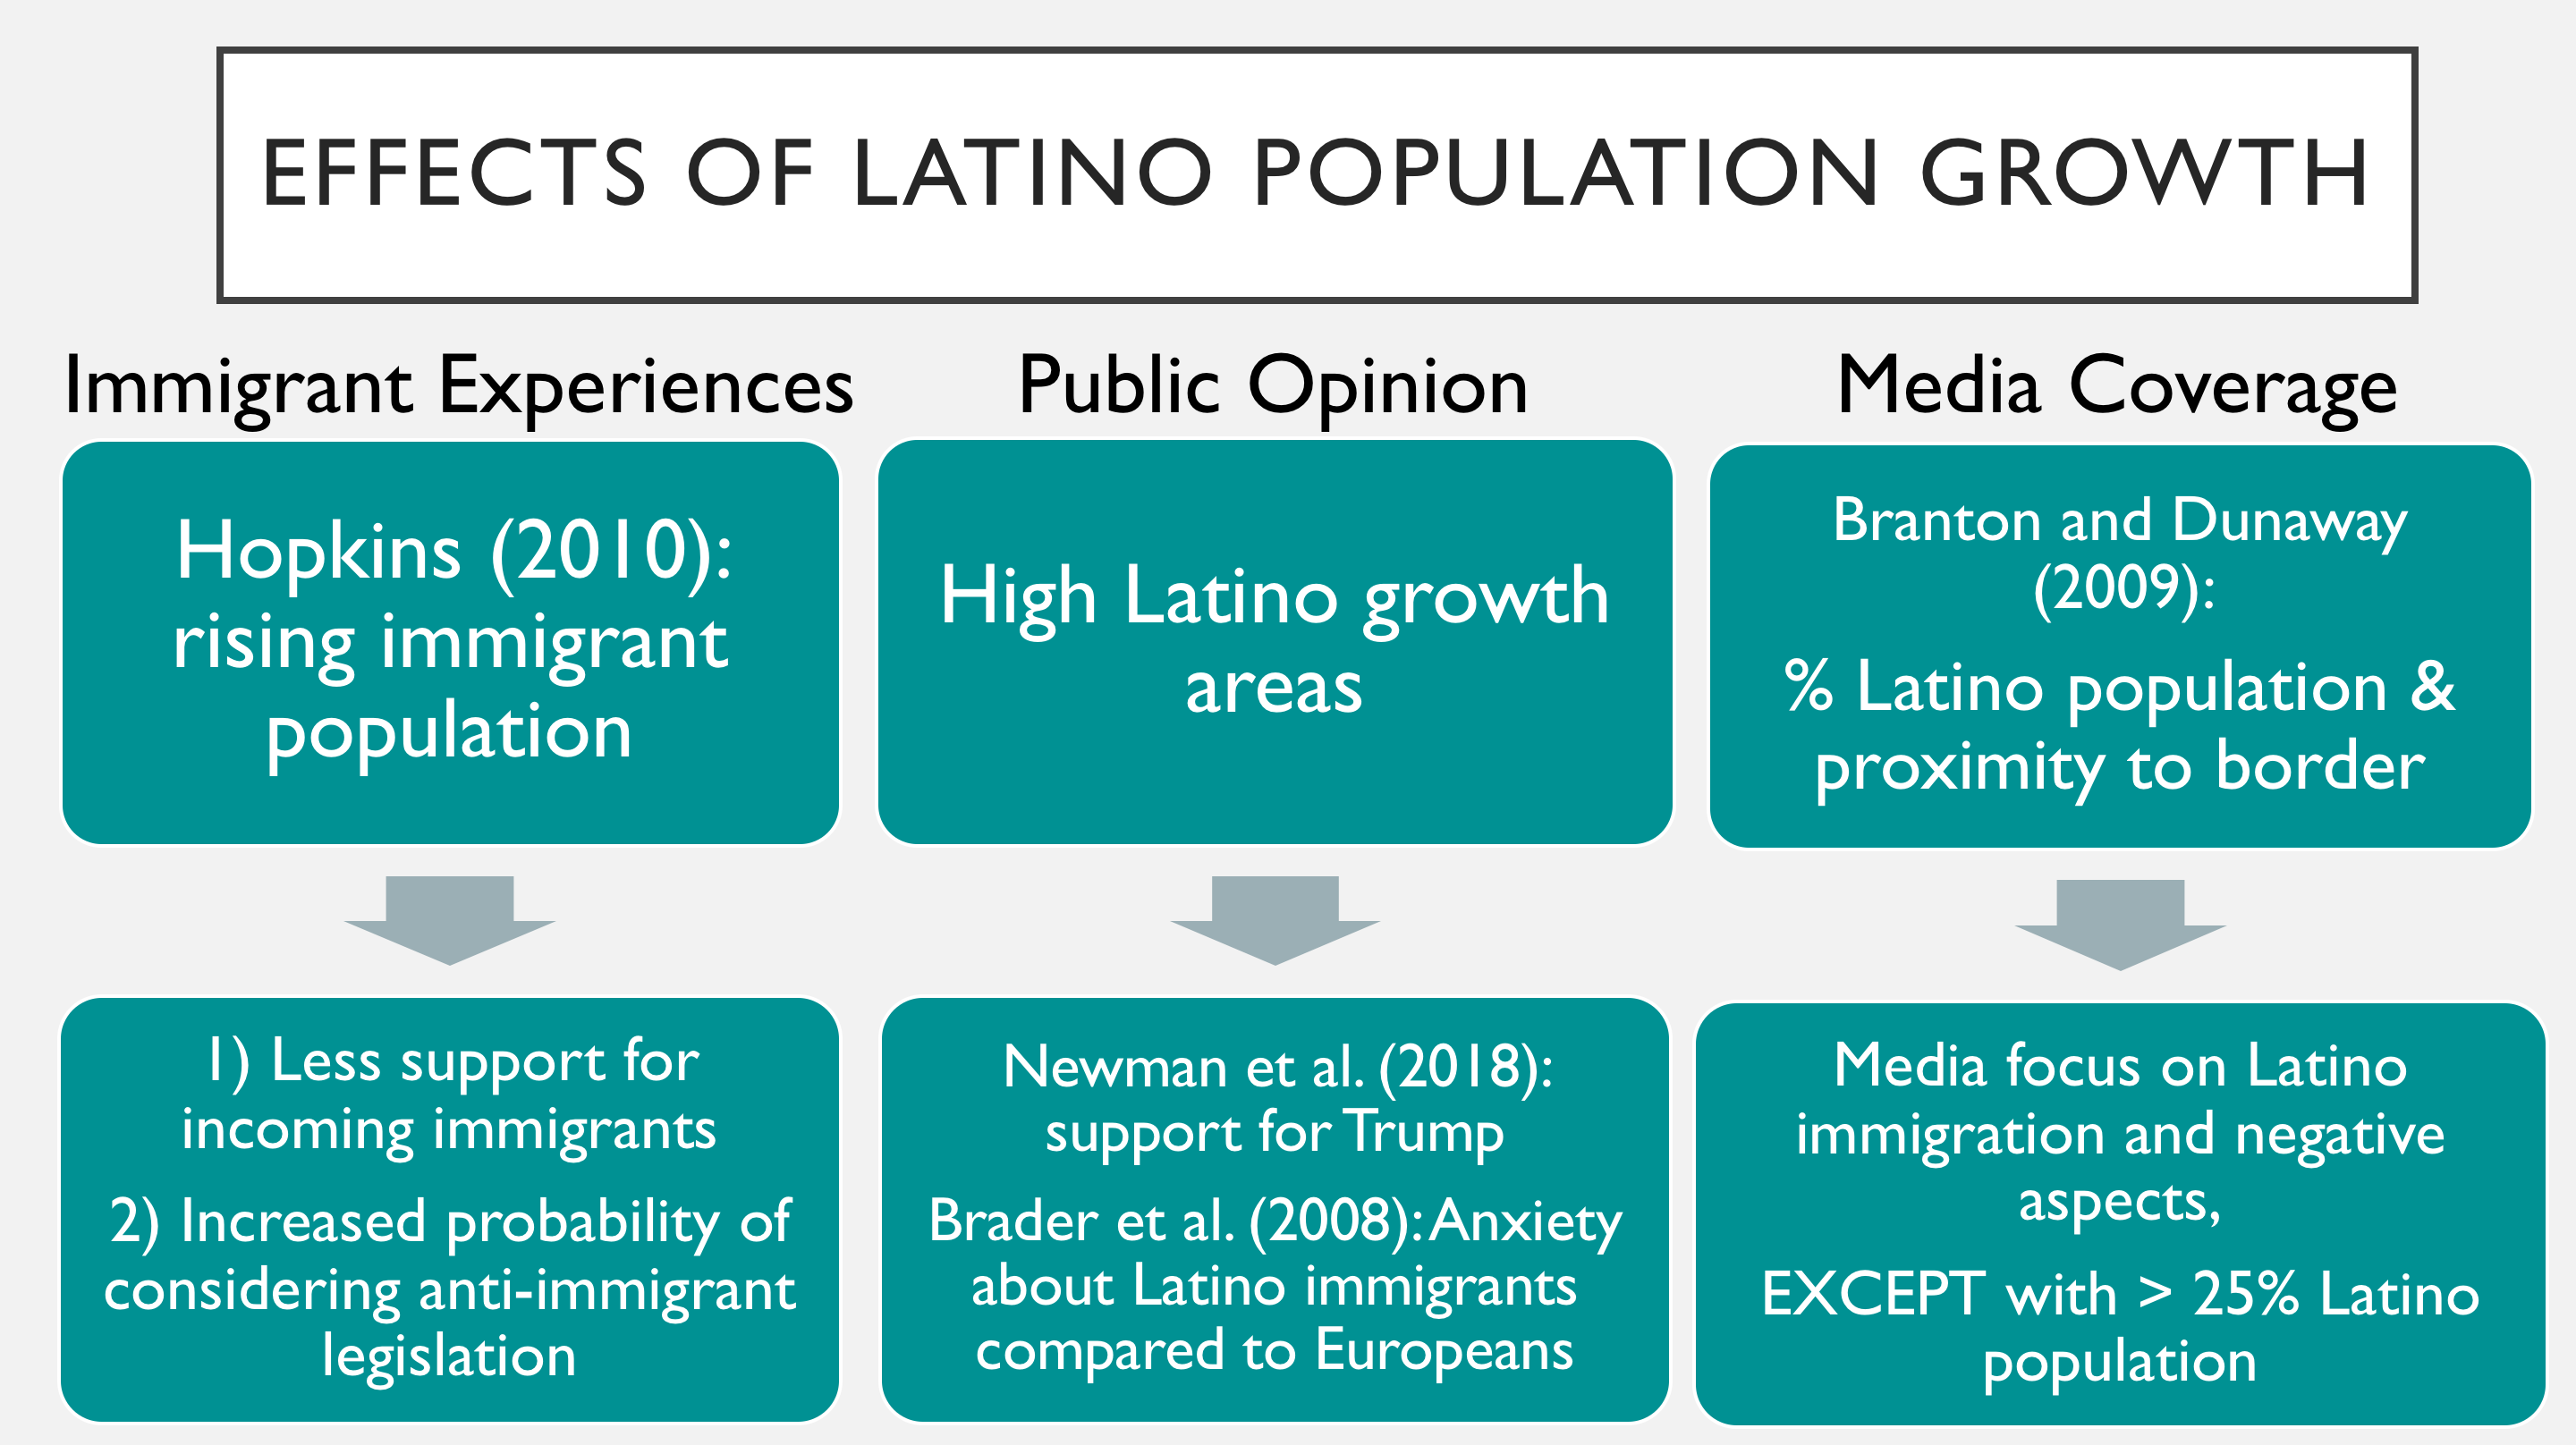
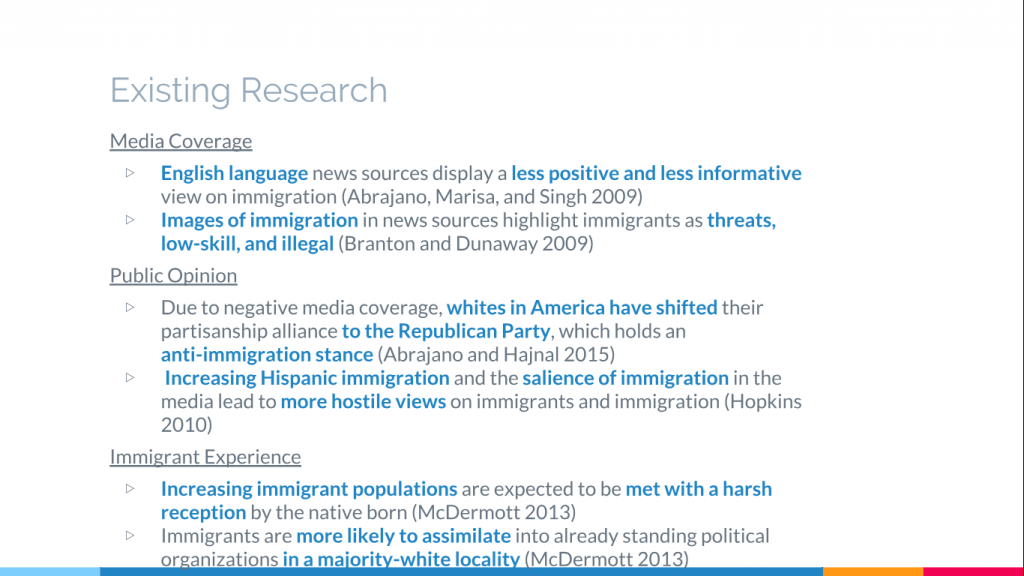
Scholars have examined the role of local demographics in immigration integration, media coverage, and public opinion extensively. In regards to immigrant experiences, McDermott argued that larger immigrant populations correspond to stronger racial identities of native blacks and whites which makes for harsher contexts of reception for immigrants (2013). Contrastingly, in a case study of Trenton, Fernandez-Kelly found that the area’s high Latino population and high prevalence of Latino businesses were associated with more social and political integration for Latino immigrants (2018). As for media coverage, Brader and his team noted that the increased American media attention on immigration has paralleled the increased rates of immigration from Latin America (Brader et. al 2013). Specific to tone, Abarjano and Singh found that Spanish news sources were more likely to focus on immigration in articles and have pro-immigration sentiments (2008). Lastly, for public opinion, Enos found that increased intergroup contact between Latino confederates and White Anglo-Saxon subjects caused a shift towards exclusionary attitudes amongst whites ( 2014). More specifically, Hopkins argued that changes in local demographics in the context of national rhetoric politzies are associated with more anti-immigration attitudes (Hopkins 2010).

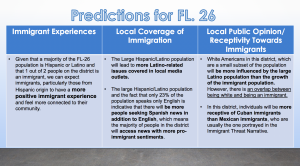
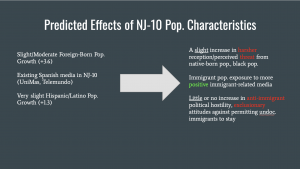
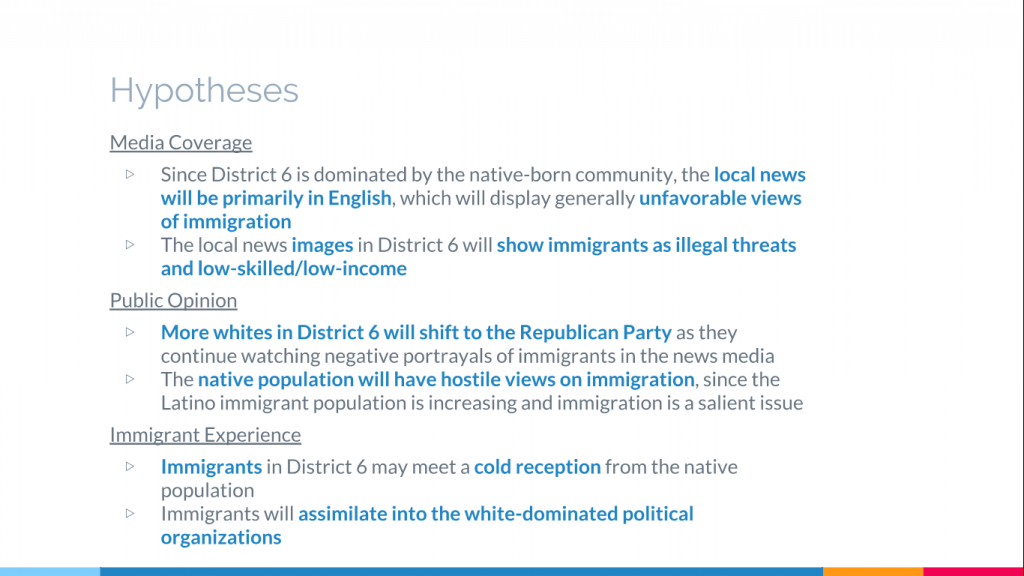
In light of prior research, it is likely that the relatively stable 67% Latino and 37% foreign-born populations in the Bronx bode well for new arrivals from Latin America. First, the primary Latino immigrants will likely have socially and politically integrative experiences and exposure to welcoming policies similar to Fernandez-Kelly’s findings in Trenton. However, it is important to note that the may simultaneously encounter hostile attitudes from native black locals. Second, the local media sources, probably offered in Spanish given the majority Hispanic population, will likely have a high frequency of immigration coverage and positive framing. Lastly, on average, public opinion would likely lean towards pro-integration and immigration attitudes manifested in support for higher immigration levels, DACA, and a pathway to citizenship, while the black subpopulation may have anti-immigrant attitudes.


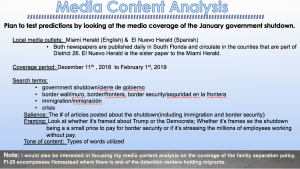
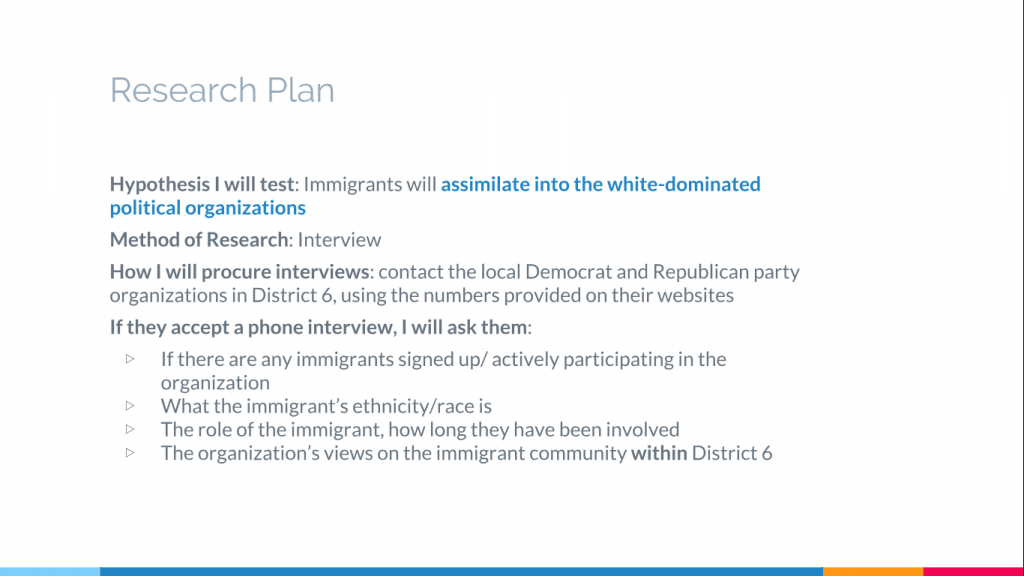
To examine the immigrant experience in the Bronx, I will utilize a mixed methodology of both semi-structured interviews and Survey Report analysis. I will likely use data from the NYC Department of Urban Planning’s “The Newest New Yorkers 2013 Report”, the Mayor’s Office of Immigration “State of Our Immigrant City March 2018 Report” and perhaps the Cooperative Congressional Election Survey (CCES) for immigration attitudes. The city’s reports provide statistics on policies immigrants would encounter and the city immigrant population’s demographics, educational attainment, employment status, and income, which are common measures of integration. As for the semi-structured interviews, I plan to interview local bilingual Hispanic immigrants interacting with the Bronx Immigration Partnership similar to Fernandez-Kelly’s approach to the study of Princeton and Trenton Hispanic immigrants. To recruit these individuals, I intend to reach out to the Bronx Immigration Partnership and request permission to interview recent immigrants in their network or attend and volunteer at one of their BIP Clinics or Resource Fairs to meet potential informants. Lastly, in these interviews, I will ask demographic information, ask them about their interactions with and opinions of local natives, the city government, interest groups, and churches and foundations, and lastly, about their own trajectory and experience with jobs and school since being in the US. These questions are pointed enough to gauge the extent to which the informants socially, politically, and economically integrated into society, but also open-ended enough to capture the nuances of their experiences.

FL-26 Population Demographics


Slide 1: FL-26 is a Hispanic heavy district with 72.3% of the 2017 population identifying as Hispanic or Latino origin, 15.8% white, 9.7% Black or African American and 2.2% Asian. Within the Hispanic population, the majority of the district Hispanics are either Cuban (~39%) or from another Hispanic background (~23%)  and about ~ 5% are Mexican, and ~4 are Puerto Rican. When comparing the population change in the district, I calculated the difference between 2012 (when the district was redrawn; FL-25 was the closest geographically for the 2007 figures) and 2017. Although, I think it’s important to note that there isn’t any significant difference between the 2007 and 2012 population demographics. The only significant change in those five years is a slight 3.8% decrease in the white population, and an equaled 3.8 increase in the Hispanic population. Now, when we look at the foreign-born and native population in the district, we see an upward trend in the foreign-born population. Currently, the district is evenly split  (50/50) with about 40 more foreign-born individuals. This rate is more than double the 20.9% foreign-born rate in Florida and 13.% rate in the U.S.Of the foreign-born population, 94% come from Latin America. Within the foreign-born population, in both 2012 and 2017, around 58% are naturalized U.S. citizens which shows a significant increase from 2007 when about 49% were naturalized. I also looked at the languages spoken in the district, and found that 72.3% speak a language other than English (which means there either bilingual or monolingual of another language, most likely Spanish given the district demographics) and 27.7% only speak English.

Slide 2: To look at how characteristics of the local population and the changes in these characteristics affect immigrant experiences, media coverage of immigration and public opinion on immigration, we turn to the literature. Fernandez-Kelly finds that immigrants living in spaces shared with people from the same backgrounds and who face similar challenges feel a sense of comfort in that community. We can expect to see in districts with large Latino populations more immigrant integration into the community, and the community will be reflective of this population as well, possibly with restaurants or festivals that celebrate the cultures of the immigrant community. When we look at the media Coverage of immigration, the language the news is covered in, the volume of the coverage, and the size of the Latino population are all factors to consider. Abrajano and Singh found that Latinos relying on both Spanish and English news have a higher likelihood of possessing pro-immigrant sentiments than Latinos who only use English news sources.  When it comes to the volume of news coverage, among non border state residents like those in Florida, more immigrant news coverage leads to more dramatic shifts of opinion when compared to residents in border states (Dunaway et al. 2010). Dunaway also concludes that a larger Latino population leads to more considerable attention to Latino-related issues in local media outlets like immigration, which tends to be a synonym of being Hispanic or Latino. In regards to the effects on public opinion, Abrajano and Hajnal concluded that white Americans are somewhat responsive to the growth of the immigrant population, but there are more influenced by the overall size of the Latino population. They also cite research that finds that the immigrant threat narrative targets Mexican immigration, and is less concerned about other Latino national groups like Puerto Ricans and Cubans.

Slide 3: Based on the characteristics of the FL-26 population, we can predict that immigrants, particularly those from Hispanic/Latino origin will have a more positive immigrant experience and feel more connected to their community due to the mostly Hispanic and foreign-born population. The local coverage of immigration in this district is expected to feature more Latino-related issues like immigration. Also, given that only 23% of the population speaks only English and therefore will seek just English news, the remaining 72.3% of the district who speaks a language other than English, and given the district population characteristics probably speak Spanish, there will be more people seeking Spanish news. Given all of this, I would expect the majority of the people in the district to access news that features a more pro-immigrant sentiment. White Americans in this district, which are a small subset of the population will be more influenced by the large Latino population than the growth of the immigrant population. However, we must also note that there is an overlap between being white and being an immigrant in this district, so the influence probably won’t be so significant in this particular district. Also, in this district, individuals will be more receptive of Cuban immigrants than Mexican immigrants, who are usually the ones portrayed in the immigrant threat narrative.  

Slide 4: The prediction that I’m testing is that that given the large Hispanic/Latino population in FL-26 is indicative that the Spanish media coverage of the government shutdown will have a higher focus on immigration than the English media coverage of the shutdown. To do this, I plan to compare the media coverage of the January government shutdown in an English and Spanish local news outlet. I will examine the news coverage starting on December 11, 2018, when news outlets began to report that President Trump would shut down the government after a meeting with Pelosi and Schumer up until February 1st, 2019, a week after the government reopened. The local media outlets I’ve decided would be more fruitful to look at are the Miami Herald, which publishes daily in South Florida in English, and El Nuevo Herald, which also publishes daily but in Spanish. As you probably noted in the name, these newspapers are sister papers, but they target different audiences. Also, I considered looking at the news articles published online from Univision and an English news outlet like CBS Miami, so I would like to get your feedback on that. Additionally, I could also try to compare the news from the Heralds with Spanish and English news from a district similar to FL-26. To gather the media content, I’ll use the following search terms: government shutdown/cierre de gobierno, border wall/muro, border/frontera, border security/seguridad en la frontera, immigration/inmigración and crisis. To look at the salience of the coverage, I’ll calculate the # of articles posted about the shutdown and categorizes them by frame. I’ll look for the following frames that the coverage could have embraced: whether Trump or the Democrats are to blame for the shutdown, whether the shutdown is a small price to pay for border security or whether it was framed to stress the millions of government employees who were working without pay. For the tone of the content, I’ll focus on the types of words utilized in the articles. Although I think this is an interesting research plan that I would like to pursue, I will also be interested in focusing my media content analysis on the coverage of the family separation policy. Fl-26 encompasses Homestead where there is one of the detention centers holding migrants, so I would like to dive more into that kind of media coverage from Spanish and English news outlets.

Population Makeup of MD-01

Population Makeup of MD-01 (3)

Slide 1

MD-01 is home to very small minority and immigrant populations as well as very small minority and immigrant population growth. The proportion of foreign-born residents of MD-01 grew by only one percentage point between 2007 and 2017. The proportion of foreign-born non-citizens practically did not change. A significant plurality of foreign-born residents were Asian, at 30%, while 27% were non-Hispanic White and 26% were Hispanic. MD-01 underwent redistricting that took effect in 2012, which shifted parts of the district from the Annapolis area to the northern Baltimore suburbs. However, the majority of the land and people of the district remain on Maryland’s rural Eastern Shore.


Slide 2

The body of literature on how population characteristics affect immigrant experiences, media coverage, and public opinion is vast. I zero in on a few important articles. Fernandez-Kelly (2008) writes that larger immigrant populations will be better integrated into society. In general, the media portrays immigrants as negative and Latino. This effect is greater in English-speaking media, in areas with more Latinos, and in areas closer to the border (Abrajano and Singh 2009; Branton and Dunaway 2009). I include the literature on the language of media because areas with more Spanish-speakers are presumably more likely to have access to local Spanish media, and thus Spanish media is, in a sense, a proxy for Latino population. Whites in close proximity to Latino populations are more likely to harbor anti-immigrant attitudes and vote Republican (Abrajano and Hajnal 2015). Though still controversial, more scholars agree that anti-immigrant attitudes are triggered when both a sudden influx of immigrants and salient national rhetoric are present (Hopkins 2010; Newman et. al 2018).


Slide 3

Slide 3 indicates that population characteristics should have little impact on the aforementioned categories. MD-01 is home to small foreign-born and Latino populations and has had little immigrant population growth. It is far from the border and does not have local Spanish media. Though salient national rhetoric exists to spark anti-immigrant attitudes, a sudden influx of immigrants does not. The exception to my hypothesis that population characteristics will have little salience in determining outcomes is the immigrant experience. Because there is a small immigrant population in MD-01, I predict that immigrants will be poorly integrated socially and politically.


Slide 4

I hypothesize that the Asian immigrant population in MD-01 will be poorly integrated socially and politically. I choose to look at Asian immigrants because Asians are the largest foreign-born population in MD-01. I plan to interview immigrant advocates in the district, with a focus on interviewing those who are Asian immigrants themselves. If I am unable to interview Asian immigrant advocates, I will ask if they could connect me with prominent Asian immigrants in the district. I plan to ask whether Asian immigrants feel like they have a voice in MD-01, whether the political parties conduct significant outreach to Asian immigrants, whether educational outcomes are favorable to Asian immigrants, and whether Asian immigrants are well represented in local government.

NJ-10 Population Demographics

New Jersey Congressional District 10, represented by Donald Payne Jr. (D)

Over the course of the ten year period from 2007 to 2017, NJ-10 experienced a moderate growth in its foreign-born population, from comprising 26.3% of the total population to 29.9%. While whites and races classified as other experienced slight declines in population size, the black majority in NJ-10 experienced a more significant population decrease, from 56.9% to 51.7%. Asians and Hispanic/Latino populations were the only groups to increase over the ten-year period, with Asians featuring a larger rise in population from 4.5% to 7.6%. Asian and Hispanic/Latino population growth from 2007 to 2017 indicates the rise of Asian and Hispanic/Latino immigrant populations, following the growth of the foreign-born population during the ten-year period as well. Whites in NJ-10 relatively stayed at the same population, suggesting that there wasn’t much of an effect to the increasing immigrant population. However, blacks experienced the most amount of decline, indicating the inhibitory effect of increasing immigrant populations who most likely contributed to the competition of jobs and wages in a low-wage labor market.

As the size of an immigrant population increases, this growth can be met with a increase in harsher reception from the native-born population, assuming that the immigrant population is primarily Asian and Hispanic/Latino (McDermott, 2013). The reaction of the native-born population to a growing immigrant population can affect the ability of immigrant groups to become socially and politically integrated, developing fear and anxiety about hostile opposition from native-born groups. Due to increasing racial salience in the social context of an increasing immigrant population size, whites and blacks may strengthen their racial identities to set social distinctions between different immigrant groups and native-born groups (McDermott, 2013). In a growing immigrant population, the presence of Spanish-language media can influence the public exposure to different perspectives and views regarding immigration. While both Spanish and English national news are neutral in their take on immigration, Spanish local and national news tend to discuss immigration in a more positive tone more frequently than English local and national news (Abrajano and Singh, 2008). This can provide Hispanic/Latino immigrant groups who follow Spanish news media with greater exposure to positive perspectives and views on immigration. Local attitudes on immigration can be impacted by sudden demographic changes in immigrant population and salient national rhetoric which negatively portrays immigration (Hopkins, 2010). As a result, individuals exposed to local immigrant growth can develop anti-immigrant political hostility. In addition, exposure to demographic changes at the local level can immediately create exclusionary attitudes and opposition to permitting undocumented immigrants from residing in the US (Enos, 2014). Despite only slight changes in immigrant population on the state level, individuals who observe immigrant population growth on the local level can develop more exclusionary and anti-immigrant attitudes.

Given NJ-10’s moderate growth in foreign-born populations as well as Hispanic/Latino and Asian populations, this district can experience a slight increase in the development of hostile attitudes and harsher reception towards these immigrant groups from the native-born population. The existence of a black majority in NJ-10 that experienced a more significant decline in population can be highlighted as a native-born group that may develop more anti-immigrant attitudes compared to whites or other races. In addition, the presence of increasing economic competition between working-class blacks and immigrant groups can be attributed to the development of increasingly hostile attitudes from African Americans towards immigrant groups. This demonstrates the greater effect of the local influence of immigrant population growth, as individual exposure to immigrant groups in local communities can cause more hostile attitudes despite only a moderate growth of the immigrant population in the district. Media influence can also be affected by population characteristics in NJ-10, where Spanish-language media is present and available in local communities. These news stations include UniMas, Telemundo, and Television, providing a variety of broadcast options for local immigrant groups. The presence of Spanish media allows for Hispanic/Latino groups to gain exposure to news reporting that discusses immigration in a more positive tone, and portrays different perspective and views on immigration compared to American national and local news stations. Despite the minimal predicted increase in perceived threat and hostile attitudes towards immigrant groups in NJ-10, sudden demographic changes on the local-level along with salient national rhetoric can bring more exclusionary attitudes and opposition to undocumented immigrants residing in the US (Hopkins, 2010). A declining black population combined with increasing Asian and Hispanic/Latino populations can influence more exclusionary attitudes at a greater effect than just the slight foreign-born population increase. The existence of salient rhetoric in national media portrayal of immigration can contribute to the development of these attitudes.

In order to examine the predicted effects of slight/moderate foreign-born population growth on native-born attitudes, I will construct a research plan to analyze state and district-level survey data to observe the salience of increasing anti-immigrant attitudes. In this data, I will create a rating system based on general perception of immigrant groups from native-born populations, in addition to distinguishing different levels of perceived threat in economic competition. I will make two comparisons on the perceptions of immigration, comparing the white alone population in NJ-10 with the black population. I will also compare the effect on both state and individual/local contexts, distinguishing between perceptions of immigration in New Jersey as a whole and perceptions based on experiences and local exposure to immigrant groups in NJ-10. In this analysis I hope to further measure the prevalence of increasing exclusionary attitudes from native-born populations towards immigrant groups, and specifically examining the differences in perception between native-born subpopulations (whites and blacks).

NY-14 Alexandria Ocasio-Cortez

Introduction Slide

Alexandria Ocasio-Cortez (AOC) represents congressional district NY-14, which covers the upper Bronx and northwestern Queens.  On the left is a picture of AOC and the right panel shows a sketch of Astoria, Queens overlooking Manhattan.

Slide #1

NY-14 has a diverse, yet fairly consistent population. This Hispanic population comprises the plurality of the district’s racial make-up at over 47%.  NY-14 also has high proportions of foreign-born naturalized citizens (21.6%) and non-U.S.-citizens (25.4%), though the majority are native-born. Percentage point (pp) changes are illustrated on the top of each bar, beginning in 2012.  Because NY-14 was redistricted in 2012, population changes are difficult to measure for a 10-year period.  A 7.1 pp increase is seen in the Latinx population between 2007 and 2012 as well as a 7.2 pp decrease in the black population.  Similarly, a 6.49 pp decrease is seen in native born constituents with a 5.36 pp rise in non-U.S. citizens between 2007 and 2012.  However, these changes may be due to redistricting. No large population changes are seen between 2012 and 2017, so this may be evidence that the district’s population has remained fairly consistent with strong minority and immigrant representation.

Slide #2

Academic literature points towards general ingroup acceptance but outgroup rejection of immigrant populations.  Specifically, Els de Graauw showed that an increase in immigrants led to the creation of nonprofit advocacy groups focused on immigrant societal and political integration (2008).  In the same paper, and supported by Andersen (2008), nonprofit organizations of this type were shown to improve immigrant experiences by access to resources.  That said, media coverage of immigration typically adopts a negative tone, especially in news sources located close to the U.S.-Mexico border (Farris & Mohamed, 2018; Abrajano & Hajnal, 2015; Branton, 2009).  Abrajano & Singh also analyzed the difference in tone between English and Spanish news sources and found that the Spanish sources were typically more positive about immigration, and that Spanish news consumers tended to favor immigration more than English-only consumers (2009).  Finally, various studies have illustrated an association between increased immigration and local anti-immigrant views (Hopkins, 2010; Enos, 2014).  In particular, white constituents are likely to be less supportive of immigration and to vote for conservative causes, especially in areas with high Latinx populations (Abrajano & Hajnal, 2015; Dunaway et al., 2010).

Slide #3

Given the aforementioned literature, the following predictions were made about NY-14.  Because of the high proportion of immigrants and minority constituents, NY-14 is expected to have many nonprofits working on immigrant issues, which would in turn lead to increased access to social and political resources as well as a large local immigrant advocacy network.  NY-14 is situated far from the border, so it is expected to have less immigration news coverage in general.  Additionally, because of the high Latinx population, NY-14 is expected to have access to Spanish news sources that are more positive than local English sources, as found in Abrajano & Singh (2009).  The district’s population has remained relatively consistent, with minority members comprising a large majority of the population and a high proportion of immigrants.  Because of this, NY-14 is expected to be generally accepting of the immigrant population.  An increase in immigrants and Hispanic residents was seen between 2007 and 2012, so a prediction could be made that there will be more local anti-immigrant views relative to 2007. However, because of the redistricting, this prediction is inaccurate at best.  Additionally, negative views are predicted to be concentrated among the few white conservatives in the area, though, as seen in previous projects, the Republican party does not have a strong constituent base in NY-14.

Slide #4

Due to data availability and the demographic make-up of NY-14, I chose to develop a research plan dedicated to testing the local news sources, hypothesizing that the Spanish coverage will be more positive towards immigration relative to the English news. In order to test this, I will examine news from the New York Daily News (English) and El Diario (Spanish) from between December 22, 2018 – January 26, 2019.  The dates correspond to the January U.S. government shutdown over funding to build a wall on the Mexican border, with the addition of one day at the end to catch any coverage immediately after the passage of the budget.  To analyze the sentiments, I will first use Python web-scraping to form a database of news articles from both sources.  Then, sentiments will be analyzed using the NRC Word-Emotion Association dictionary, which gives negative/positive ratings as well as feelings such as “disgust” and “anger” associated with each word. Unfortunately, no Spanish equivalent exists; however, NRC provides a dictionary for 105 different languages related to the English dictionary through Google Translate.  There are obvious inaccuracies involved with the use of Google Translate, but the NRC dictionary has been tested profusely in both languages with high accuracy for determining word sentiment.  Finally, the sentiment rates between the Daily News and El Diario will be compared to see which reported more positively/negatively about immigration.

CT-5 Population Demographics

Connecticut’s Fifth Congressional District (CT-5), like the United States as a whole, has quickly become more diverse in the last decade. American Community Survey (ACS) estimates that the white share of the population dropped almost 10 percentage points between 2007 and 2017. Meanwhile, minority populations grew across all racial and ethnic demographics, especially the Hispanic/Latino population which increased 6.5 percentage points during the aforementioned decade. As a result, Connecticut has the 11th highest Hispanic population in the United States. Puerto Ricans represent over 50% of this Hispanic population and roughly 8% of the states entire population, the highest percentage in the country. Correlated to the racial and ethnic diversification, CT-5’s foreign born and non U.S. citizen populations have also rapidly grown in the past decade. A plurality of these populations are Hispanic. Increasing minority populations make CT-5 a very interesting case study for the impact of local demographic changes on immigration attitudes.

There is an abundance of research that explores the impact of local demographics on immigrant political experience, news coverage of immigration, public opinion of immigrants. While party organizations once were conducive to immigrant political incorporation, a strong local party organization, even Democratic, has the opposite effect today (Aptekar 2008; Andersen 2008). Immigrant and minority representation lags far behind native and white representation, despite growing populations of minorities across the country. In Aptekar’s study of Edison, New Jersey, the Democratic party often served as an impediment to immigrant political success. Immigrants are also hindered by consistently negative coverage in the news media, which in turn, through agenda setting and framing, can sour public opinion of immigrants and immigration. Abrajano and Hajnal find that 48.9% of immigration related articles published in the New York Times use a negative tone. Only 12.1% assume a positive tone. These suggest that immigration is indeed being framed in a negative light. Furthermore, they find coverage focuses primarily on Latino immigrants and the portion of immigrants who are undocumented. Branton and Dunaway argue the closer a news outlet is to the border, the more the publication will focus on the negative aspects of immigration. Public opinion of immigrants is shaped not only by the media, but also by changes in local demographics. Enos’ research argues white Americans who have increased contact with outgroups (in his experiment, spanish speaking confederates) will adopt stronger anti-immigrant attitudes. However, these effects wear off after a relatively short period of time.

The 2018 congressional election in CT-5 featured an unlikely pair of candidates. Manny Santos, the Republican candidate, is an immigrant from Portugal. Jahana Hayes, a Democrat and the eventual winner, is an African American woman and became the first black person to represent a Connecticut congressional district. Unfortunately, however, these candidates are the exception to minority representation and political success. I predict a strong Democratic party in the District no longer prioritizes immigrant political incorporation. Even with growing minority populations, few minorities will ultimately achieve political success. Even Ms. Hayes, the 2016 national teacher of the year, was not the party backed candidate during the primary. The Hispanic share of the population in CT-5 has risen 6.5 percentage points over the last ten years. The foreign born population has risen more than 20%. With these changes comes more intergroup contact. Existing research would predict these demographic changes, combined with politicized immigration rhetoric, will result in negative local opinions of immigrants and immigration.  These negative attitudes will be reflected in local news coverage of immigration. Some research, however, would predict that CT-5’s distance from the southern border will diminish the amount of negative coverage.

I will test my media prediction through a content analysis of two local Connecticut newspapers. I chose The Hartford Courant and The Republican-American Newspaper, which have the two largest circulations of any local paper in Connecticut. In turn, it is likely that these papers have the largest agenda setting effect on the state’s population. The Republican-American focuses on local news more so than The Courant and serves the larger Waterbury area as well as Litchfield County, the rural portion of CT-5. I will gather all articles related to immigration, including opinion pieces, published during the government shutdown, which ran from December 22, 2018 through January 22, 2019. The search terms I intend to use are “immigrant”, “immigration”, “illegal immigration”,  “border wall”,  and “government shutdown”.  The volume of immigration articles will impact whether I can make statistically significant predictions. In my content analysis of these publications, I intend to follow a coding procedure similar to Abrajano and Hajnal and categorize stories across three aspects of framing. The first test will be for tone– positive, neutral, or negative. I predict that immigration will be framed in a negative light. The second test will code for the immigrant group discussed– Latino, European, Asian etc. I predict a large portion of articles will focus on Latino and Hispanic immigration.  The final coding test will be article content. Categories include immigration policy, economic impact of immigration, and crime associated with immigration. I predict coverage across all issues, but an emphasis on the negative, anti-immigrant, side of each. I recognize a hand-coding process can be subjective, but I hope to find tools to remove any potential subjectivity. Abrajano and Hajnal utilize an automated text analysis package called RText Tools.

FL-24 Demographic Analysis

Slide 1: District Demographics: Naturalized Citizens and Hispanics Increase Over Time

This slide compares two different sets of bar graphs over time, in the same area, from 2009 to 2017. The 2009 column is data from the former FL-17 to account for redistricting that occurred in 2010. The current 24th district is composed of 82% of what was the 17th congressional district before redistricting. The top row of bar graphs, in navy blue, compares the number of native, naturalized and non-naturalized foreign-born population within the district. As can be seen from this data, the percentage of native born citizens in the district decreases over time by approximately 8 percentage points, from about 64% to 56%. Conversely, the percentage of naturalized foreign-born citizens has increased by this amount, going up 8 percentage points from 2009 to 2017. The percentage of non-naturalized foreign-born population remained the same, around 20%, throughout this time period.

The second row of graphs illustrates the racial makeup of the district over time. The previous FL-17 had a large black population of 59%, which has decreased 10 percentage points over time to 49% in 2017. While the white population has always been far lower than the national average, the white population decreased by 5 percentage points after redistricting, and was 12% in 2017. The notable increase in racial groups is the steady increase of Hispanic or Latino over time, by 15 percentage points over time. In 2017, the district was 39% Hispanic or Latino.

Slide 2: Effects of Latino Population Growth

Much literature exists describing the effects of both a rising immigrant population and the percent Latino population on a variety of dependent variables. First, for immigrant experiences, Hopkins (2010) argues that rising numbers of immigration reduces support for these immigrants and for immigration in general. Further, he argues that this immigration growth also affects policy outcomes. A growing number of immigrants greatly increases the probability of a locality considering anti-immigration legislation. Hopkins even states that the probability of an anti-immigrant proposal being considered doubles from 34% to 66% as the share of immigrants increases by 8 percentage points. Second, looking at the effect of public opinion, two studies examine the effect of living in a high Latino growth area on different aspects of public opinion. Newman et al. (2018) show how the marginal effect of Latino growth increases significantly after inflammatory comments about Latino immigrants, suggesting that support for Trump increased when citizens had lived experience with Latino growth. Brader et al. (2008) similarly find that Latino immigrants lead to anxiety and feelings of threat in a way that European immigrants do not.

Finally, for the media coverage on immigration, Branton and Dunaway (2009) show that news organizations closer to the border publish more articles about Latino immigration that focus on the negative aspects of immigration, and this also correlates strongly with the percentage Latino population. However, these authors do note that as the percentage Latino population exceeds 25%, the volume of coverage on Latino immigration declines, most likely because news networks do not want to alienate the local demographics.

Slide 3: Literature’s Predictions May Not Extend to FL-24

Based on the research presented above, the recent growth in the Latino population and immigrant population within FL-24 should predict less support for immigration almost entirely across the board. First, in terms of the immigrant experience, there should be less support for incoming immigrants and a stronger consideration of anti-immigration legislation. This is especially true because FL-24 had an increase of the immigrant population of 8 percentage points, the same number that Hopkins cites as leading to an almost doubling of anti-immigrant proposals being considered. In terms of public opinion, the Latino growth should have a large positive impact on support for Trump and increase anxieties about these Latino immigrants. Lastly, according to the predictions from Branton and Dunway (2009) about media coverage, because the immigrant population is well above 25%, coverage of Latino immigration will decline. Thus, with FL-24’s nearly 40% Latino population, Latino immigration will most likely not be heavily covered in the news media.

Most of the existing research does not account for unique situation that FL-24 is in. While there has been growth of the Latino population and immigrant population within the past 10 years, the district has remained a majority minority district, in which the white population is never more than 20%. In addition, the Hispanic and Latino population started very high in 2009 compared to national averages, at 24%. Further research thus needs to analyze whether existing research holds up in a majority black district and whether the anti-immigrant sentiment is as strong with such a large Latino/Hispanic population.

Slide 4: Analysis of How Hispanic Population Affects Media Coverage on Immigration

My research plan will test the application of the findings of Branton and Dunway (2009) to FL-24 – that at the point at which the Latino population exceeds 25%, the coverage of Latino immigration declines. To do so, it will be necessary to study more than just FL-24, which has a Latino population of nearly 40%, but also the media coverage of the area to another area with a Latino population of less than 25%. I have chosen Jacksonville as this area, because Florida’s 4th district, the district including Jacksonville, has a Latino population of just 8%. However, Jacksonville is a large enough city to have its own media to study.  Thus, my research will compare the coverage of South Florida newspapers, The Miami Herald and the Sun Sentinel, with the prominent Jacksonville Newspaper, the Florida Times-Union. For South Florida, I have chosen to look at both The Miami Herald the Sun Sentinel because together these newspapers cover both Miami-Dade and Broward County, both of which are included in FL-24.

With these sources, I will compare media coverage surrounding the January 2019 federal government shutdown and border wall debate. Given that the government was shut down from December 22, 2018 until January 25, 2019, I will examine the time period from December 1, 2018 to January 31, 2019. I will compare these sources on three metrics: framing, tone and salience. To measure framing, I will assess whether the issue of immigration is associated with Latinos, crime, or the economy. To categorize tone into positive, negative, or neutral, I will assess whether the individual news stories discuss the benefits or problems of immigration, or whether no preference is given. To measure salience, I will measure the volume of immigration coverage throughout the time period and see if there is repeated coverage of the same issues. Finally, the following will serve as my search terms: immigration, immigrant, Latino immigration, Hispanic immigration, government shutdown, border wall, Trump AND immigration, illegal immigration, undocumented immigration.

VA-07 Population Composition

Abigail Spanberger represents Virginia’s seventh congressional district in the U.S. House of Representatives. The district is located in the suburbs of Richmond, VA, and its representative is a member of the Democratic Party.

Map from: https://www.govtrack.us/congress/members/VA/7

Photo from: https://abigailspanberger.com/

This slide shows the demographic change of VA-07 from 2007-2017 — the 11th Congress to the 115th Congress. Therefore, these district demographics are from before Abigail Spanberger was elected to represent VA-07. Clearly, the district has remained incredibly white over the decade, yet the percentage of the population that is white has decreased by 6.3 percentage points. The Asian-American population has been increasing relatively steadily, and the Hispanic/Latino population was also increasing until it began to drop off again between 2015 and 2017 (decreased by 2.1 percentage points). It is important to note the comparatively large increase in the Hispanic/Latino population between 2013 and 2015 (a 4.2 percentage point increase). This increase coincided with the district’s increasing conservatism, as in the 2014 midterm elections, the VA-07 electorate voted out incumbent Republican Eric Cantor — a party leader — and replaced him with the ultra-conservative Tea Party Republican Dave Brat (see Assignment 1). This is important in the context of the increasing foreign-born population in the district. While the district is overwhelmingly comprised of native-born Americans, the foreign-born population has been increasing since 2013 — the same year the district experienced a spike in its Hispanic/Latino population. Perhaps then the relationship between the immigrant population and the Hispanic/Latino population prompted the district to become more conservative, which as the next slide will show, is consistent with existing literature.

Demographics information from: https://factfinder.census.gov/faces/tableservices/jsf/pages/productview.xhtml?pid=ACS_10_1YR_S0501&prodType=table

Existing research on immigration and demographic change shows a great deal of white resistance. As Enos (2014) showed in his experiment, minor demographic change in an area results in more exclusionary attitudes. However, this is not the only effect of an increasing minority population as Craig and Richeson (2017) also showed that an increase in the Hispanic population can motivate a more conservative ideology among the rest of the population in the area. This is consistent with the fact that the more conservative party — the Republican Party — is associated with more restrictive immigrant policies (see Assignment 1). Perhaps then, this is why the VA-07 electorate became even more conservative and voted for the more conservative candidate in the 2014 midterm elections after experiencing an increase in the Hispanic/Latino population. Further support for this comes from Newman (2012) who found that an increase in the immigrant population in a low-immigrant community triggers the white population’s opposition to immigration. This is because a relatively recent change in the immigrant population is more noticeable in a low-immigrant community like VA-07 rather in an area with a high immigrant population already. Of course, VA-07 is largely comprised of native-born residents, so Rocha et al.’s (2011) finding that anti-immigrant sentiments among Anglos result from ethnic concerns which are driven by the size of the native-born Latino population. This could have also contributed to the shift seen in 2014 since even though the immigrant population in VA-07 increased, the native-born population has been an overwhelming majority. The media also does not help improve the situation for immigrants since the media tends to portray immigrants in a negative light, showing them as undocumented, which increases hostility towards immigration (Farris and Mohammed 2018). Therefore, even without a wealth of literature on the immigrant experience, the existing literature about immigration and demographic change as well as how the media represents immigrants shows that immigrants often have negative experiences. As immigrants attempt to integrate, they are met by the exclusionary and conservative attitudes and negative media environment scholars have identified. Even though VA-07 elected a Democrat in 2018, it is still unlikely — given the history of conservatism in the district — that the situation for immigrants has improved.

Considering the demographic change in the district and the existing literature on immigration, demographic change, and the media, which inform an understanding of immigrant experiences, several predictions can be made. For the characteristic of demographic change prompting more exclusionary and conservative attitudes, the impact is on public opinion of the other residents in the community. This also encompasses an increase in immigration since the relevant studies about immigration and attitudes have focused on racial and ethnic minorities which then change the area of interest’s demographics. Given the demographics of the district over the last decade and the existing research, for the outcome of public opinion I predicted that VA-07 is full of anti-immigrant sentiment and a conservative ideology. This is due to the fact that both the Asian-American and Hispanic/Latino populations have increased over the last decade (despite the slight 2017 decline for the Hispanic/Latino population) and how the district has consistently elected conservative candidates until 2018, when Spanberger narrowly won her election. Therefore, most of VA-07 has exclusionary attitudes as a result of this demographic change and the residents also likely support restrictive immigration policies, consistent with the district’s Republican lean. In terms of the media coverage immigrants receive, which focuses on their legal status and thus presents them negatively as undocumented, the outcome here is media coverage, and the predictions are that in VA-07, the media will emphasize immigrants’ documentation and frame them as criminals. This would be consistent with the literature as well as with the district’s Republicanism which hints to a negative immigration attitude and thus media coverage. Of course, the media can also be influencing VA-07’s immigration attitudes, which is why the two outcomes of public opinion and media coverage must be studied to see how immigrant experiences may be impacted. As immigrants face hostility and negative attitudes socially and through media coverage, the outcome in question is immigrant experiences, and I predicted that as immigrants try to integrate into VA-07 they will face social hostility in addition to a lack of government support. In turn, this hostility and lack of institutional support create an overall negative experience for immigrants in VA-07.

I plan to focus my future research on public opinion, specifically. I predict the Republican lean of VA-07, which was found in Assignment 1, makes public opinion in VA-07 more anti-immigrant than the rest of the country, despite the fact that in 2018 the district elected a Democrat. To study this, I will use the Collaborative Multiracial Post-Election Survey (CMPS) from 2016. During this time, the district was still being represented by Tea Party Republican Dave Brat, showing how conservative the district was becoming after experiencing some demographic change. The CMPS is a survey conducted after each election to measure the attitudes of voters and non-voters on a variety of political social issues, one of which is immigration. I will specifically focus on the importance of addressing immigration, how respondents feel undocumented immigrants should be handled (focusing on how “undocumented” vs. “illegal” changes the responses), immigration’s economic impact, and which party is viewed as better on the issue of immigration. I hope to study these across party first of all, and also gender, news consumption, and religiosity. I will then compare the results of my statistical analysis to that of the country overall. I will adjust the scope of the study as necessary as I proceed through the research process.

Honor Code

This assignment represents my own work in accordance with University regulations

– Morgan Bell

Virginia District 6 Demographics


This slide shows the race and ethnic makeup on District 6 in 2007 and 2017, respectively. This data was provided through census.gov and its American Fact Finder service. The main observations are that the white population size has decreased, the Asian and Latino population has increased, the overall foreign born population increased, and Asians and Blacks are an increasing fraction of the foreign born population. These observations reinforce the awareness that immigration to America has increasingly become non-white, leading us to see its effects on the slide below.


This slide indicates the findings of immigration scholars around the immigrant population’s effects on media coverage, public opinion, and immigrant experience. The general composition of this slide highlights the negative portrayal of immigrants by the media, which in turn, leads white to hold negative views of immigrants and shift their partisanship to the Republican Party, known for its firm anti-immigrant status. On a local level, immigrants are expected to be received coldly by the native population and undergo assimilation into the white population’s political organizations. An implication of this research is that now the Spanish language is tagged as ‘the immigrants’ language’, deepening the binary between native Americans and foreign born Americans. As a result, we can see how communities that push against bilingual services in the community are preserving the language that highlights the downsides of immigration in the media. Ultimately, there is a cyclical relationship identified, in which the media negatively depicts immigrants, which causes public opinion on immigration to sour, worsening the reception of immigrants, which will the be recorded in the news under the heading of titles like “Border Security”.


These hypotheses begin with the premise that District 6 is a primarily white congressional district and from there, it is safe to assume that the news will be in primarily in English. Based on the research, if District 6 shows it news in English, then immigration-related news will depict immigrants negatively. In effect, more whites in District 6 will shift to the Republican Party and hold more hostile views on immigration, then immigrants will undergo a cold reception in their locality and assimilate into white-dominated political structures. It seems that based on the conditions created where the native group wants to preserve their cultural practices, immigrant groups will find it difficult to integrate unless they assimilate to the dominant culture.


My research will be interview-based as the virginia.gop website provides many contact numbers of local Republican Party organizations. The Virginia Democrat party provides some contact information, as well. I am a bit skeptical of McDermott’s graphic and how it applies to Virginia’s District 6. Since I predicted that immigrants in District 6 will not have the most welcoming reception, I am investigating whether or not they will integrate into the political structures/ organizations. If there are immigrants participating, I will consider their race and/or ethnicity to determine if different immigrants in District 6 participate more than others in the political environment.

Texas 7th District Population Characteristics and Effects

Rep. Lizzie Fletcher (Democrat, TX-07)

Slide 1:

In terms of the racial and ethnic population makeup of Texas’ 7th district, the district has remained largely white and non-immigrant over the course of 10 years from 2007-2017, but there has been remarkable change in diversity. The Latino population has grown 6.6 percentage points and subsequently, the white alone and non-immigrant populations have decreased substantially. Furthermore, other minorities such as blacks and Asians have increased in size. In terms of the immigrant population, the foreign-born population has increased by 8 percentage points, with a higher increase in naturalized citizens over non-citizens.


Slide 2:

Existing research on how local population characteristics affect immigrant experiences, media coverage, and public opinions of immigration has been well-documented. In terms of immigrant experiences, Enos’ 2014 study shows that exposure to immigrants translates into more exclusionary attitudes for short periods of time (Enos 2014). These experiences also affect whites on the receiving end, as whites living in states with more Latinos are found to be more supportive of restrictive policymaking and generally identify with the Republican party (Abrajano and Hajnal 2015). News coverage of immigration has been found to push the immigrant threat narrative, cover immigration as a negative issue with pessimism, and focus on Latinos specifically (Abrajano and Hajnal 2015). Proximity to the border is an observed factor in determining the volume, sensationalism, and tone of immigration coverage, with more negative reception closer to the border (Branton, Dunaway 2009). Coverage often engages in agenda-setting, negative framing, and as a result, priming on the issue. In local public opinion, percent Latinos in a population is always a significant predictor of anti-immigrant attitudes, while the percent Asian American indicates more generous social welfare policies, less negative attitudes about immigrants (Abrajano and Hajnal 2015). When “sudden, destabilizing change” occurs in local demographics while immigration also becomes a high-profile national issue, attitudes become more anti-immigrant (Hopkins 2010).


Slide 3:

In the context of TX-07, immigrant experiences with society and politics is presumably at a negative-level, but with signs of optimism. Given the 30.4% Latinos, there are definitely interactions between immigrants and native-born residents, which might create some sense of white backlash, anti-immigrant views, and movement towards the Republican Party. However, the opposite took effect: TX-07 became Democratic in 2018, at the end of a 10 year increase in Latino population. I believe backlash to Trump overpowered attitudes on immigration here, which makes the conflict between the literature and the reality harder to identify. This is also why I want to explore this area in my research proposal. I don’t think immigrant receptivity will be negative because the population increase of this group has not been sudden or destabilizing, rather it’s been constant and consistent over the last 10 years. Furthermore, growing Asian populations might counteract more restrictive policymaking that Latino attitudes tend to create; support for DACA and amnesty might begin to increase as native-born population decrease. Given Houston’s proximity to the border, I suspect local news media to succumb to more sensational, frequent, and negatively-toned coverage of immigration. The media, regardless of their political leanings, will engage in agenda-setting, framing immigration as negative, and consequently priming, all while pushing group-centric ideas about Latinos.


Slide 4:

I plan to test my predictions about immigrant experiences by doing qualitative interviews. I would like to interview a leader or high-level employee of an immigrant nonprofit (possibly the Alliance), a staffer for Rep. Fletcher, an immigrant business owner, family members, or any immigrants in municipal positions, to list a few possibilities. I think it would be even more beneficial if people in these positions were also immigrants. I have worked with the non-profit the Alliance in the past and have suggested it due to my familiarity. Some key questions I would ask immigrants include: How do you feel you’ve been received in the community? How was that changed in the last 10 years or since you’ve arrived? Do you feel a part of the political process of our district? What would you like to see improved upon in the future? I plan on contacting and securing permission from interviewees through email, phone calls, and personal connections.

« Older posts Newer posts »

The McGraw Center for Teaching and Learning
328 Frist Campus Center, Princeton University, Princeton, NJ 08544
PH: 609-258-2575 | FX: 609-258-1433
mcgrawect@princeton.edu

A unit of the Office of the Dean of the College

© Copyright 2025 The Trustees of Princeton University

Accessiblity | Privacy notice