Susan Davis

Link to higher-quality and more legible slides

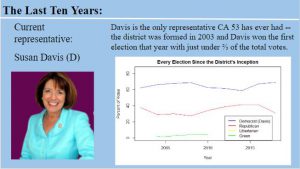
CA 53 was one of the products of a redistricting effort in 2001-2002 when it was sectioned off from CA 49. Susan Davis became the House Representative for this district at its inception in 2003 after serving from 2000-2002 in District 49. Davis has represented the district since 2003 and has had no problem maintaining her seat. As seen in the plot I made using California Secretary of State data, she has won consistently with a 20% or more margin of victory.

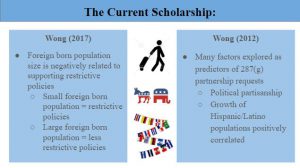
I chose to focus on two very CA-53-applicable pieces from the semester so far: Wong’s The Politics of Immigration: Partisanship, Demographic Change, and American National Identity from 2017 and Wong’s 2012 publication on 287(g) and local cooperation in Journal of Ethnic and Migration Studies. Specifically I am taking hypotheses from these texts which cover a much broader range of information than is relevant to the scope of this assignment. In Wong’s 2017 piece, a primary hypothesis is that restrictive immigration policy is negatively correlated to foreign-born population. Such that more foreign-born people would predict looser immigration policy. In Wong’s 2012 piece, he looked at multiple factors that might predict the level of cooperation with local authorities and 287(g) agreements, or local partnerships with ICE. I chose to pull two of these factors: political partisanship and growth of Hispanic/Latino population. Directionally, Democrat partisanship predicts less cooperation and Republican partisanship predicts more cooperation. A growing Hispanic/Latino population predicts more cooperation.

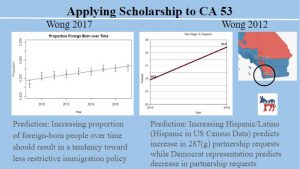
Applying the above hypotheses to CA 53 is a multi-step process. Data for the plot on the left comes from the US Census, including the anticipated error calculations depicted on each data point. The plot shows a steady but small climb in foreign born population in the last ten years. According to Wong 2017, CA 53 should have more relaxed policy regarding immigration now than several years ago to reflect this trend. The plot and visuals under Wong 2012 are less clear at face value because I included two of Wong’s factors to consider. The plot shows a ~5% increase in Hispanic population in the last 8 years. Wong predicts that the increasing Hispanic population will indicate an increase in local cooperation and 287(g) agreements. It can be hard to isolate CA-53 from surrounding districts, but the donkey underneath is meant to reassure viewers that CA-53 is blue on the map, indicating that the district overall is expected to have reduced cooperation and 287(g) agreements. The partisanship and growth of the Hispanic population predict contradictory directional effects according to Wong; however, partisanship is generally stronger than other factors so the overall expectation for CA-53 is low levels of cooperation and 287(g) agreements.

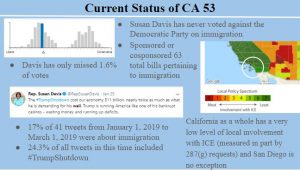
In reality, CA-53 and Susan Davis are not too far off expectations from the literature. Davis is a fairly average Democrat in Congress with a slightly better voting attendance (missed 1.6%) than the median lifetime Congressional average (2.0%). In terms of immigration, Davis has never differed from the results of a prediction algorithms’ expectations, indicating that her votes have been consistent with the overall vote of Democrats. Furthermore, Davis has sponsored or cosponsored 63 total bills having some relevance to immigration. As exemplified in the tweet seen here, Davis has been very vocal in her disapproval for the Trump administration’s behavior at the border as well as the resulting government shutdown. Returning to the prediction from Wong 2017, it is challenging to know if her stance on immigration has changed very much considering she has never disagreed with the Democratic Party on it. She appears to have always been and has remained a strong proponent for lax and supportive policy. Looking at the heat map on the right allows us to revisit the prediction from Wong 2012. The heat map uses 287(g) agreements and other indicators of local cooperation where green is low and red is high. CA-53 has generally low cooperation, which is consistent with the prediction. Although California has very low cooperation overall which makes it hard to compare different districts.