Author: Jenny Xin

CA-19: The Limitations of Asian Political Integration in San Jose

Summary:

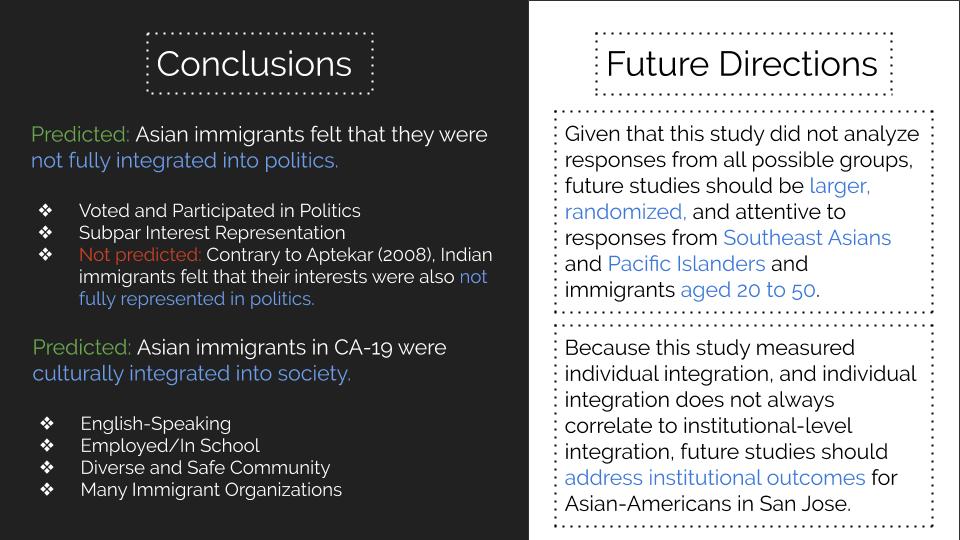
Traditional models show that Asians are not well-represented in politics: Asians have historically had an abysmal turnout rate, and even in regions with substantial Asian cultural integration, there is little direct representation or interest articulation. The combination of these three phenomena seems to generally prevent Asians from being politically well-integrated in the United States. In CA-19’s San Jose, however, the traditional model seems to not apply. Asian voter turnout in San Jose is relatively high, due to concentrated efforts by Asian advocacy groups to increase turnout and political engagement. In addition, there are also a fair number of Asian representatives in California generally and San Jose specifically. Despite subverting the traditional model, however, San Jose still seems to struggle in adequately representing Asian voters’ interests. While the Asians interviewed in a small-scale study voted consistently in presidential, state, and local-level elections or frequently participated in political activities like campaigning or fundraising, their political interests were not represented by their party or in politics generally. Moving forward, San Jose’s political representatives at every level should listen more carefully to their Asian constituents: that is, understanding and addressing their many political interests through open lines of communication.

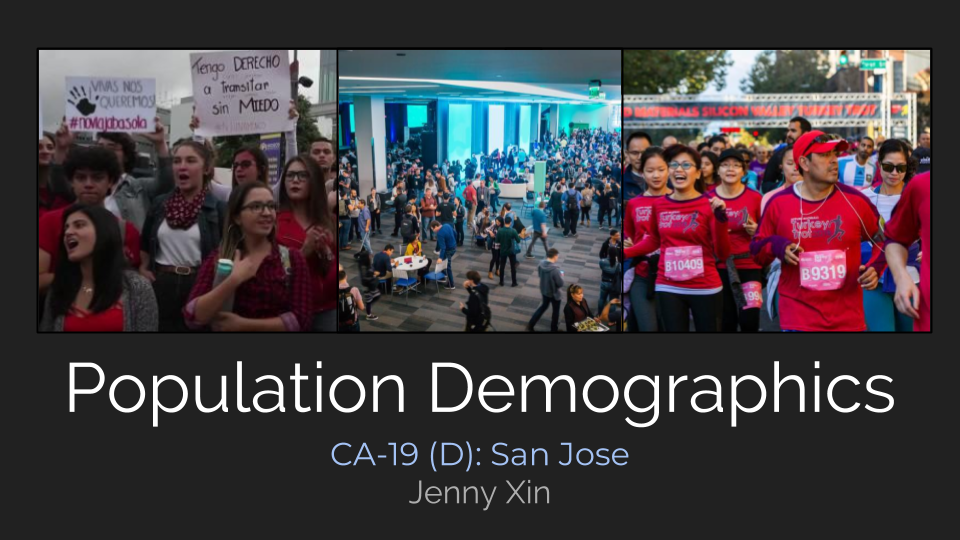
CA-19: The Limitations of Asian Political Integration in San Jose:

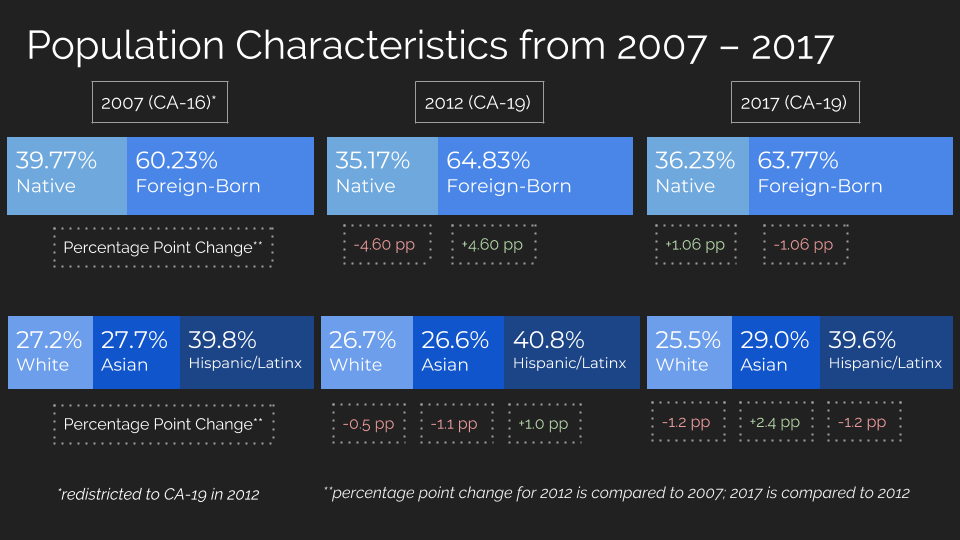
May marks the beginning of Asian American and Pacific Islander Heritage Month, a month in which we celebrate the culture, traditions, and history of Asian Americans and Pacific Islanders in the United States. The month is particularly well-advertised in San Jose: take a walk around the city, and you’ll see flyers and posters announcing the month in schools, restaurants, malls, and every other possible public space. This is not an inexplicable phenomenon, given the city’s Asian population size: while Asians are currently 5.6% of the U.S. population, AAPIs account for 15% of Californians and 30% of San Jose residents. Since San Jose serves as a population hub for Asian-Americans, it is not difficult to imagine that it would also serve as a political haven: in theory, while places in the United States with fewer Asians might not represent the group politically, in San Jose, where Asians make up 30% of the city’s population, they should be well-integrated into politics through direct representation, voter turnout, and interest articulation. This, unfortunately, is not the case. While traditional models of Asian political behavior do not predict Asian behavior in San Jose, representatives in the city – congressional, state, and local – still do not adequately represent their Asian constituents’ political interests.

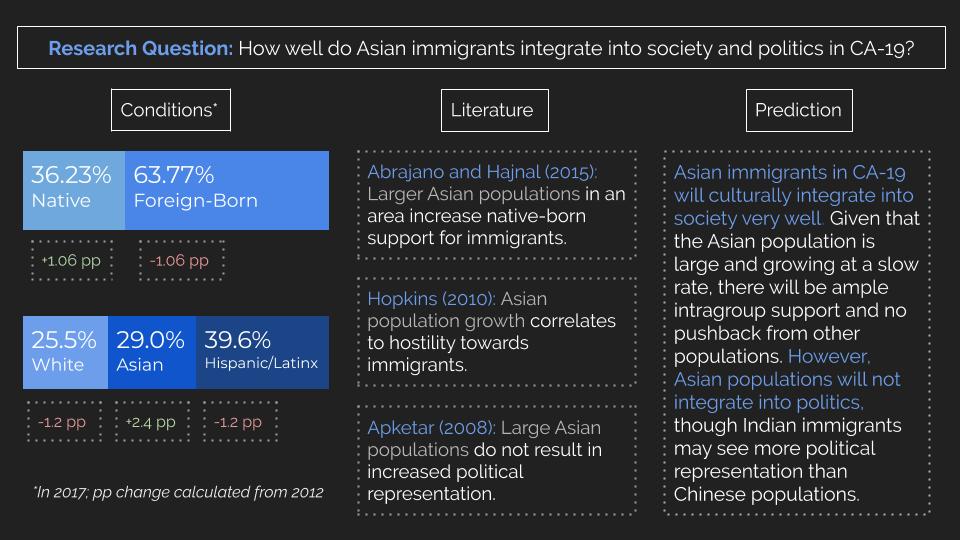
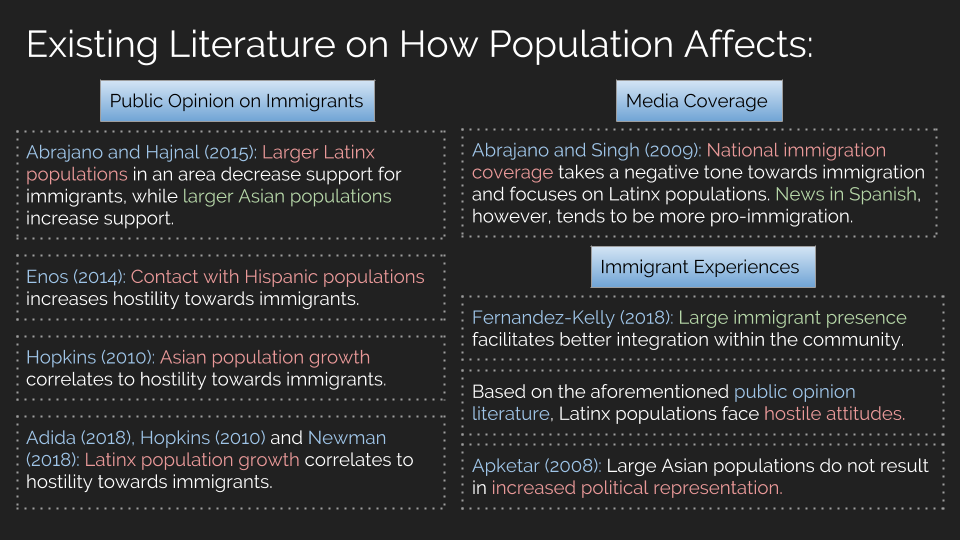
Traditional models of Asian political behavior show that Asians are not well-represented in every possible way. Asians have historically had an abysmal turnout rate: in the 2016 election, 49% of Asian voters cast ballots, as compared to 64% of White voters and 59% of Black voters, and even that was considered abnormally high. Moreover, even in regions with substantial Asian cultural integration, there is little direct representation (i.e. Asian politicians) or interest articulation. One study by Aptekar (2008) finds that despite a large number of Asian cultural organizations in suburban Edison, New Jersey, few Asians hold elected positions in the region and political elites are largely unaware of Asian political interests. The traditional model would thus suggest that a combination of low voter turnout rate, little direct representation, and lack of interest articulation that prevents Asians from being politically well-integrated.

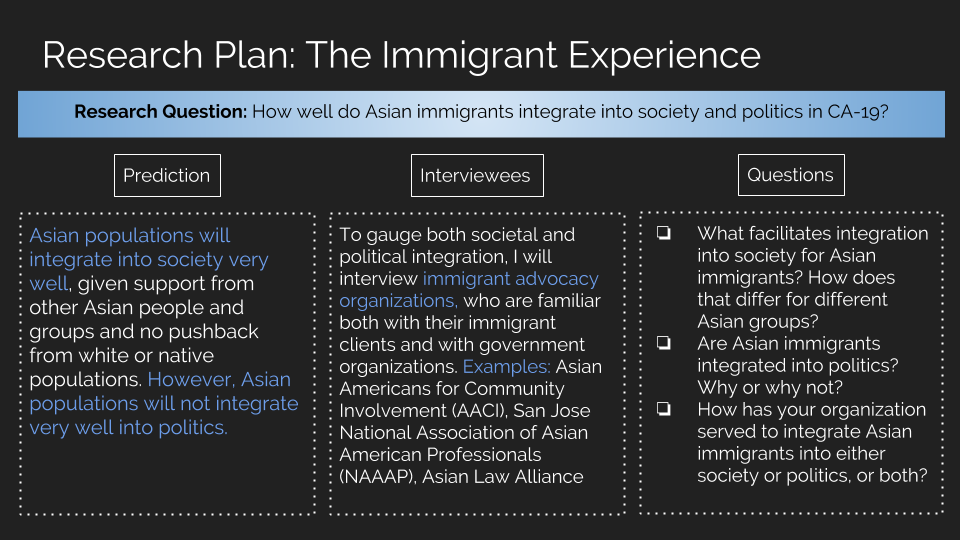
In San Jose, however, the traditional model does not apply. Asian voter turnout in San Jose is relatively high, due to concentrated efforts by Asian advocacy groups to increase turnout and political engagement. Pastor, Rosner, and Tran write that in terms of immigrants generally, Santa Clara County has consistently exceeded or tied with Los Angeles County and New York City in terms of foreign-born voters. This, in large part, is because of inter-networked advocacy groups that encourage immigrant turnout, like the API Justice Coalition, headed by Asian Americans for Community Involvement (AACI) in combination with the Asian Law Alliance, the Asian Pacific Bar Association, and the Japanese American Citizens League of San Jose. In addition, there are also a fair number of Asian representatives in California, and San Jose specifically, which is a historical trend that has continued into the present day. A study by Pei-Te Lien found that in 1998, around 400 people of Asian or Pacific Islander descent held key elective positions in federal, state, and municipal governments, and 33 percent were from California. Today, direct political representation of the Asian population occurs to a great extent in San Jose specifically. Pastor, Rosner, and Tran explain that San Jose elected the first Asian-American mayor of an American city, Democrat Norman Mineta, in 1971. Since then, several San Jose Council members, like Madison Nguyen of District 7, have served on school boards and launched political careers. In addition, many of the other fourteen cities in Santa Clara County have elected Asian leadership. Cupertino has three Asian council members (a majority) and an Asian former mayor. Campbell, meanwhile, elected Evan Low, the first gay Asian council member, who has since gone on to serve as the mayor of the city and a member of the California State Assembly.

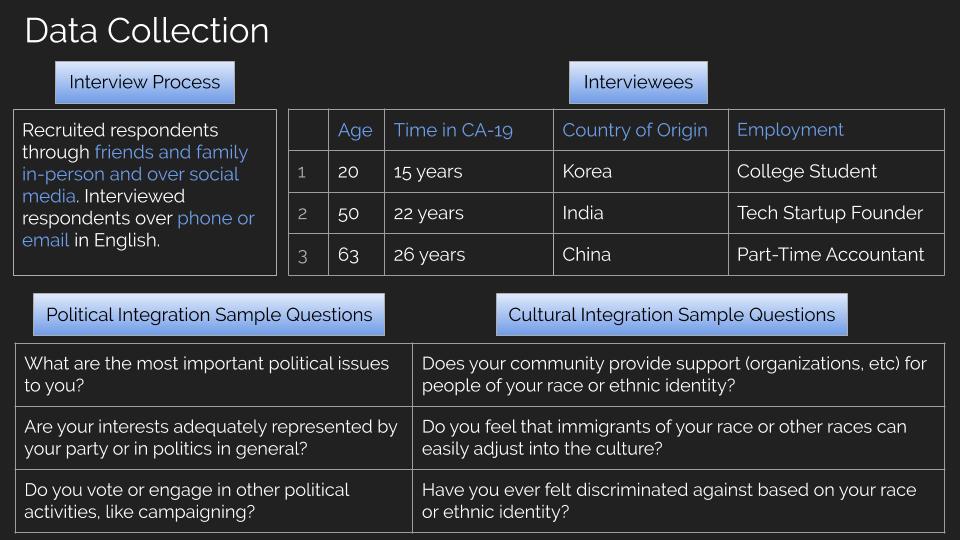
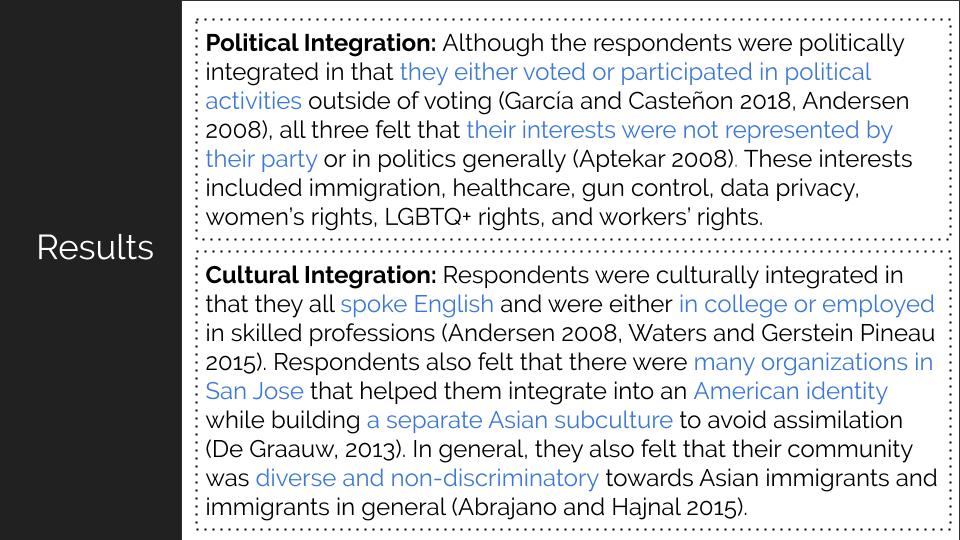
It is thus clear that San Jose does not struggle with the traditional difficulties of low Asian voter turnout and meager direct representation. The issue that San Jose seems to struggle with, however, is interest articulation. I interviewed three San Jose residents of differing ages, educational levels, and nationalities as part of a small-scale study on Asian immigrant political and cultural integration. All three said that while they voted consistently in presidential, state, and local-level elections or frequently participated in political activities like campaigning or fundraising, their political interests were not represented by their party or in politics generally. All three expressed intense dissatisfaction with the fact that their representatives, both national and local, did not frequently discuss or comprehensively flesh out positions on their interests, which included immigration, healthcare, gun control, data privacy, women’s rights, LGBTQ+ rights, and workers’ rights. While the feeling of inadequate interest articulation may be a sentiment felt widely in our current political arena, political elites’ habit of not listening to Asian constituents specifically is a well-documented phenomena, as Aptekar showed. San Jose’s political sphere, despite having good turnout and spectacular Asian representation, is thus still not representative of Asian voters’ interests.

What, then, do San Jose’s representatives need to do? It is evident that San Jose has thus far done a great job of subverting traditional expectations of Asian political behavior, with advocacy groups that promote turnout and a fair amount of direct political representation. Moving forward, San Jose’s political representatives at every level should listen more carefully to their Asian constituents: that is, understanding and addressing their many political interests through open lines of communication. This, of course, is a difficult job: translating symbolic representation into actual representation is difficult because the name “Asian” comprises more than a few nationalities, languages, beliefs, cultural norms, and backgrounds. That being said, however, San Jose representatives’ work is not yet complete. This May’s Asian American and Pacific Islander Month is a perfect time to enjoy San Jose’s many cultural offerings while understanding that the political needs of San Jose’s Asians haven’t yet been met.

Asian Immigrants in CA-19: Assessing Cultural and Political Integration

Slide 1:

The existing demographic conditions of CA-19 make it an interesting place to study Asian immigration in particular. CA-19, or its corresponding geographical area, is almost evenly split between Asians (30%), Hispanics/Latinx (40%), and Whites (30%). Changes to this population from 2012 to 2017 have been small: since 2012, the Asian population has grown by 2.4 percentage points, while the Hispanic/Latinx population and White population has shrunk by 1.2 percentage points. Since 2012, meanwhile, the size of the foreign-born population has shrunk by one percentage point. In general, however, CA-19 is notable for its large foreign-born and Asian populations, shrinking White population, and overall consistency, with little demographic change. Meanwhile, there is much existing literature on Asian immigration and integration. Abrajano and Hajnal (2015) find that if an Asian population is significant, support for immigration from the native-born population increases. Rapid growth of an Asian population, however, may induce hostility against immigrants: Hopkins (2010) finds that when an Asian population expands quickly, attitudes towards the population also become more negative. Aptekar (2008) argues that though Asians are more readily integrated into society, even in places where they are prominent, they find difficulty being represented or integrating in politics. The literature suggests, therefore, that when an Asian population is large, Asian immigrants may integrate into society, but face difficulty achieving political integration. When an Asian population is rapidly expanding, however, neither cultural nor political integration is likely. Through qualitative interview collections, I plan to gauge Asian immigrant integration into politics and society in CA-19. I predict that, as the conditions and existing literature suggests, the large size of CA-19’s Asian population will allow Asian members of the community to be fully integrated into society. Though growth of an Asian population may play a role in increasing hostile attitudes regarding immigration, since CA-19 has seen very little change in its Asian populations in the last five years, hostility against immigrants may not manifest in CA-19. Despite their social and cultural integration, however, I predict that Asian immigrants of all nationalities in CA-19 will not be fully politically integrated or have their interests represented in politics. Aptekar (2008) does introduce the caveat that Asian Indians are more likely to be or have their interests represented in politics than Chinese immigrants; thus, I expect to find that Indians in San Jose may feel both culturally and politically integrated where other Asian immigrants only experience cultural integration.

Slide 2:

To test my prediction, I decided to interview first-generation Asian immigrants living in San Jose regarding their perceptions of their own political and cultural integration. I recruited interview subjects by asking friends and family in-person and through social media (a non-random process) and interviewed subjects over either phone or email, depending on the subject’s availability and comfort. Two interviewees opted for email so that they would have more time to answer the questions. In total, I interviewed three subjects, all of differing ages, backgrounds, and nationalities so as to provide more comprehensive data. Respondent 1 is a 20-year-old Korean male who is currently attending college in San Jose and has lived in the city for 15 years with his family. Respondent 2 is a 50-year-old Indian female who moved to San Jose 22 years ago to establish a high-tech startup with her husband. Respondent 3 is a 63-year-old Chinese female who has lived in San Jose for 26 years and currently works as a part-time accountant. Interview questions were split into three categories: Background, Political Integration, and Cultural Integration. Below is a full list of the questions asked.

Background:

  • How old are you?
  • What do you do for work/school?
  • Are you a citizen?
  • How long have you lived in your community?
  • Why did you choose to live in your community?

Political Integration:

  • Did you register to vote?
  • Did you vote in your most recent state, presidential, and county-level elections?
  • Are you affiliated with one of the two major political parties? If not, why?
  • If you are party-affiliated, how well do you think the party you support represents your interests?
  • Do you feel that your interests are represented in politics? How so?
  • What are the most important political issues to you?
  • Are you engaged in any political activities outside of voting (ie volunteering for campaigns, donating to candidates, fundraising or advertising, conversations with friends and family about politics)?
  • How often do you talk about politics with friends and family? (Frequently, once in a while, not at all)

Cultural Integration:

  • How would you define your community?
  • How diverse is your community?
  • How safe or comfortable do you feel in your community?
  • Does your community provide support or organizations for you or people like you?
  • Do you socialize with people from different races outside of work/school?
  • Would you say you feel “American” (that you associate with your national identity) or do you think your ethnic identity is more salient for you?
  • Do you feel that there is a specific Asian subculture in your community, or are Asians an equal part of a larger culture in your community?
  • Do you feel that immigrants of other races can easily assimilate into your community?
  • Have you ever been called racial slurs or by any derogatory names?
  • Have you felt discriminated against on the basis of your race/ethnicity?

Slide 3:

All three respondents were politically integrated in that they either voted or participated in political activities outside of voting. Respondents 2 (Democrat) and 3 (Independent) voted in all recent elections, while Respondent 1, as a DACA recipient, could not vote but participated in political activities (i.e. campaigning and fundraising for the Democratic Party). As García and Casteñon (2018) and Andersen (2008) explain, the act of voting or participating in politics can mark political integration into a society. In this regard, therefore, all three respondents were fairly politically integrated. All three respondents felt, however, that their interests were not represented by their party or in politics generally. Respondent 1 reported that he felt the Democratic Party to be fairly split on issues important to him, such as immigration, LGBTQ+ rights, and workers’ rights. Respondent 2, meanwhile, felt that the Democratic Party had no well-executed, comprehensive position on immigration, women’s rights, or data privacy, the issues most important to her. Respondent 3 felt that no political party was able to adequately represent her positions on healthcare reform and gun control, the issues most important to her. Aptekar (2008) writes that one measure of integration is interest articulation and representation; in this regard, therefore, the Asian immigrants interviewed were not politically integrated. In regards to the second portion of the prediction, respondents were culturally integrated in that they all spoke English and were either in college or employed in skilled professions. Some possible measures of cultural integration, as explained by Andersen (2008) and Waters and Gerstein Pineau (2015), is English language acquisition, educational attainment, and skilled, gainful employment, all of which all three respondents possessed. Respondents also felt that there were many organizations in San Jose that assisted in cultural integration while pushing back against total assimilation. Respondents 1 and 3 mentioned Korean and Chinese schools in the area that helped to teach young children the language and culture of their respective countries; these schools operated only on the weekends so that they would not conflict with “regular” school, thereby impeding language acquisition or educational attainment. Respondent 2, meanwhile, mentioned Indian community centers that hosted networking events and job fairs to promote employment in the area while also hosting Bollywood stars, classical music classes, and Holi festivals to encourage cultural preservation. De Graauw (2013) explains that immigrant advocacy and cultural organizations are often highly important in integrating immigrants into their host community while helping to preserve their culture, and all three Asian immigrants interviewed felt that these organizations had been helpful in that regard. They felt very much a part of the San Jose community and consciously identified themselves as “American” through their education, employment, and values systems, but were also very aware of their ethnic identity and felt as if they were part of an Asian subculture within the larger body. A final indicator of cultural integration was that all respondents felt that San Jose was very diverse, with high levels of socialization between people of different races, and was non-discriminatory towards immigrants in general. Given that all respondents felt welcomed and not targeted for their Asian immigrant status or racial identity, there seems to have been minimal native-population backlash against Asian immigrant populations and a welcoming attitude towards cultural integration, as Abrajano and Hajnal (2015) predicted.

Slide 4:

The results found through the three interviews generally supported the initial predictions. Political integration of the interviewed Asian immigrants was limited, given that all three respondents voted or participated in politics on a regular basis but still felt as though their interests were not well-represented in politics. Culturally, however, all three respondents were well-integrated, given their educational attainment, language acquisition, employment status, acknowledgement of the various cultural organizations that had supported them in balancing their Asian and American identities, and personal feelings of diversity and inclusion within the city. In general, the predictions were all well-supported by the results. There was one caveat, which was that Indian immigrants, like the East Asian immigrants interviewed, also felt as if their political views and interests were not represented. This was directly contrary to Aptekar’s (2008) findings, which were that in Edison, New Jersey, Indians were more likely to be politically integrated than Chinese immigrants. Given that Aptekar (2008) occurred in one small geographical location far from San Jose, however, it is entirely possible that her results were simply not generalizable to other regions. This study, of course, had a fair number of limitations. Because the study utilized non-random sampling and a small sample size, in future studies, randomization of interview collection as well as a larger body of responses would be helpful. Further, though my results encompassed Asian immigrants of differing nationalities and age groups, I was not able to interview Southeast Asians or Pacific Islanders, nor was I able to interview Asian immigrants between the ages of 20 and 50. In future studies, targeting those groups for interviews would lead to more comprehensive, representative results. Finally, the nature of this study made it so that the focus of the study was on individual-level integration, rather than on institutional-level, group outcomes. Given the differences between individual-level integration and group integration, and that individuals can be more or less integrated where larger groups are not, there is ample opportunity for work to be done analyzing institutional-level integration, cultural and political, for Asian immigrants in San Jose.

CA-19: Population Demographics

Title Slide: The images in this title slide are meant to introduce the viewer to the district’s demographics. One image is of protestors holding signs written in Spanish, the next is of White and Asian “techies” at a conference, and the third is of Asian runners participating in a race.

Slide 1: From 2007 to 2017, CA-19, or its corresponding geographical area, has remained almost evenly split between Asians (30%), Hispanics/Latinx (40%), and Whites (30%). Changes to this population have been small: the Asian population shrunk by one percentage point post-redistricting and grew by two percentage points five years after that. The Hispanic/Latinx population, meanwhile, grew and then shrunk again by one percentage point in the span of a decade. The only notable trend is that Whites have shrunk by 1.5 percentage points over the course of the decade, which, though consistent, is still very small. Before redistricting occurred in 2012, CA-19, or what was then CA-16, was around 60% foreign-born and 40% native-born. Post redistricting, the foreign-born population grew by 4.6 percentage points, but shrunk again by one percentage point. In general, however, CA-19 is notable for its large foreign-born, Latinx, and Asian populations, shrinking White population, and overall consistency, with little demographic change in the last ten years.

Slide 2: In terms of existing literature, it is clear that the size and growth of various immigrant populations impact public opinion, local media coverage, and their own lived experience in different ways. In terms of public opinion, Abrajano and Hajnal (2015) find that once the Latinx population reaches a certain size, support for immigration decreases; if an Asian population is significant, however, support for immigration increases. Enos (2014) builds upon that literature by suggesting that short-term contact with Hispanic populations increases hostility towards immigrants in general. Other literature focuses not on size of the immigration population, but on growth, which Abrajano and Hajnal (2015) suggest is weakly related to attitudes towards immigration. Hopkins (2010), Newman (2018) and Adida et al. (2018) all find that the rapid growth of Latinx populations increases hostility towards immigrants. Hopkins’ “politicized places” theory, for instance, argues that when communities are undergoing large growth in Latinx populations at the same time that salient national rhetoric politicizes immigration, hostility towards immigrants will increase (Hopkins, 2010). Adida et al. (2018), meanwhile, argues that large growth in Latinx populations results in increased support for restrictionist immigration policies; Newman (2018) argues that when communities undergo the lived experience of Latinx population growth, their attitudes towards Latinx immigrants interact with Trump’s rhetoric and become more hostile and adversarial. Rapid growth of an Asian population, meanwhile, may also induce hostility against immigrants: Hopkins (2010) finds that when an Asian population expands quickly, attitudes towards the population also become more negative. When taken together, the literature seems to suggest that largeness of, close contact with, and fast growth of a Latinx population increases general hostility towards immigrants. A large Asian population decreases hostility towards immigrants, but if the Asian population grows very quickly, that effect quickly mimics the trajectory of the Latinx experience. In terms of media coverage, Abrajano and Singh (2009) suggest that national news coverage of immigration tends to focus on Latinx immigration, using a very negative tone. When compared to news published in English, however, Spanish news are seen to be more positive about immigration as a whole and use more positive language. Therefore, an area with large quantities of news published in Spanish may see more positive media coverage of immigration as compared to the national average. Finally, in terms of the overall immigrant experience, the literature varies. The literature previously discussed in terms of public opinion applies here: Latinx populations, large or growing in size, face hostile attitudes towards them and towards immigrants in general from the communities that they join. Professor Fernandez-Kelly (2018), however, argues that large immigrant communities can help facilitate integration, by providing immigrants with a support system for societal integration. This applies, in particular, to Hispanic/Latinx populations in various parts of New Jersey. In terms of the Asian population, Aptekar (2008) argues that though Asians are more readily integrated into society, even in places where they are prominent, they find difficulty being represented or integrating in politics. The literature suggests, therefore, that Latinx populations may or may not have a difficult time integrating into society and politics, depending on their reception by the native population and by their immigrant peers. Asian immigrants may integrate into society, but face difficulty achieving political integration.

Slide 3: This literature can allow us to make predictions about CA-19. First, in terms of public opinion, the  largeness of the Hispanic/Latinx population and the close contact that White residents will have with them indicates that there will be hostility towards immigrants as a whole. The largeness of the Asian population, however, as a non-threat to White populations, may mitigate that general ill-will. Meanwhile, as described before, CA-19 has seen very little change in either its Latinx or its Asian populations in the last decade; therefore, though growth of both Latinx and Asian populations may play a role in increasing hostile attitudes regarding immigration, the effects may not manifest in CA-19. The overall prediction, therefore, is that based on size of population alone, public opinion of immigration will be lukewarm: cold towards the size and proximity of Latinx populations, but warm towards the size of Asian populations. Second, in terms of media coverage, 40% of CA-19 is either Spanish-speaking or Latinx. CA-19 is likely to have numerous Spanish-speaking news outlets, and as Spanish new outlets tend to be more positive towards immigration than a national news outlet, CA-19 is likely to see more positive local media coverage of immigration, especially as compared to national media coverage. Third, in terms of the overall immigrant experience, CA-19 is, while very largely Latinx and Asian, also fairly White. Latinx immigrants thus may find it easy to integrate thanks to robust immigrant communities (40%), or may face backlash and hostility from the White native population. Asian immigrants, meanwhile, may find it easy to integrate into CA-19, given the robust size of the Asian population (30%), but still may not be adequately represented in or allowed to participate in politics, be it at the local, state, or federal level.

Slide 4: I plan to gauge Asian immigrant integration into politics and society through qualitative interview data collection. As already mentioned, I predict that the large size of CA-19’s Asian population will allow Asian members of the community to be fully integrated into society, be it through educational attainment, employment status, or income attainment, to name just a few measures of integration. Despite their social integration, however, I predict that Asians in CA-19 will not be fully politically integrated or represented on multiple levels of government. In order to look at both societal and political integration, I plan to interview a number of immigrant advocacy groups, which will give me insight into both. Immigrant advocacy groups, as argued by authors like DeGraauw (2013), work alongside both the immigrants that serve as their clients and government officials that want to use the knowledge that advocacy groups possess to better serve immigrants’ interests. These groups will therefore be one of the most reliable sources to draw upon in understanding the integration of immigrants into societal and political life in CA-19. Some groups that I would get in contact with for interviews include Asian Americans for Community Involvement (AACI), San Jose National Association of Asian American Professionals (NAAAP), or the Asian Law Alliance. Preliminary general questions for these organizations include “What facilitates integration into society for Asian immigrants? How does that differ for different Asian groups?” or “Are Asian immigrants integrated into politics? Why or why not?” I would also want to differentiate between different service providers by asking specific questions like “How has your organization served to integrate Asian immigrants into either society or politics, or both?” Upon completing my qualitative interviews with immigrant advocacy groups, I would compile the data and gauge the accuracy of my predictions in a written report.

White Minority, White Backlash: The Impacts of Shifting Demographics on the Racial Threat Theory

Abrajano and Hajnal’s work opens with the idea of the racial threat theory, which is that “individuals in contexts with larger minority populations should feel more threatened, express greater animosity, and be especially supportive of a host of policies aimed at maintaining the in-group’s social, political, and economic privileges” (117) They modify this theory, however, by arguing that whites view large Asian populations as positive while viewing similarly large Latinx populations as threatening. Thus, the racial threat theory applies particularly to Latinx populations.

Tavernise’s New York Times article, on the other hand, lends support to the original racial threat theory, in the midst of a discussion between demographers on the accuracy, ethics, and consequences of publishing data that shows that whites will soon be a racial minority in America. It suggests that when whites are confronted with the idea of losing their status as a majority group, they are more likely to support restrictive immigration and “report negative feelings toward racial minorities” as a whole. The article thus seems to support the idea of the racial threat theory applying to racial minorities across the board. Tavernise closes by suggesting that though political actors seem unwilling to promote them, possible solutions to white backlash lie in emphasizing the good of immigration or suggesting to white Americans that they will still be the dominant racial group due to shifting racial boundaries.

  1. Which conception of the racial threat theory (that it applies to all minorities or only a subset of them) do you find more compelling? Is the article necessarily at odds with Abrajano and Hajnal’s findings, given that we have discussed the conflation of “immigration” with “Latinx immigration” or even “undocumented immigration,” as well as the fact that the Asian-American population is the fastest growing population in the United States?
  2. Do you agree with the potential solutions to white backlash presented in the article? Why or why not?

Article: https://www.nytimes.com/2018/11/22/us/white-americans-minority-population.html

CA-19: Zoe Lofgren

Link to Slides

Title Slide: In this slide, I’ve included a picture of Rep. Zoe Lofgren as well as an image of San Jose, California, the largest city in her constituency. The picture of San Jose indicates its modernity (skyscrapers), vibrancy (crowds of people), affluency (well-groomed streets and greenery), and its Spanish influences (San Pedro Square).

Slide 1: This slide details the election results of the current and past representatives of CA-19. Republican George Radanovich, who represented the area from 1994 to 2010, won his race in 2008 by 98% of the vote. Upon his retirement, Republican Jeff Denham (2010-2012) won his race by 64.6%. CA-19 was redistricted in 2012, upon which the largely agricultural Central Valley became CA-10 and the highly Democratic, urban area of San Jose, which had been CA-16, became CA-19. Post-redistricting, Dunham ran in CA-10, while CA-16 incumbent Democrat Zoe Lofgren won the CA-19 race by 73%, a percentage that has remained more or less constant until the present. Though originally highly Republican, CA-19 has, mostly as a result of redistricting, become very Democratic, which is reflected in the continuation of Lofgren’s tenure and the large margins with which she has won her races.

Slide 2: In this slide, I summarize the existing literature pertinent to immigration policy and the factors that influence representatives’ votes. All of the literature suggests that partisanship is highly important factor in determining how a representative will vote (i.e. Republican MCs will vote Republican). Aside from this, foreign-born population size, Latinx or Asian population size, partisanship of constituents, and city size can all be factors in determining the vote. Wong (2017) builds off of the median-voter theorem by claiming that the size of a foreign-born population in a district will affect the location of the median voter in the district. He thus suggests that a small foreign-born population will mean more support for restrictive immigration policies (and vice versa). Wong (2014), meanwhile, suggests that the higher the percentage of Latinx or Asian people within a population, the less likely a representative will be to support interior enforcement bills. This, of course, has a caveat: a higher Latinx population percentage will still decrease the likelihood of support amongst Republican representatives, but a higher Asian percentage will increase the likelihood of interior enforcement support amongst Republicans. The caveat does not apply, however, to CA-19, as I explain later. Casellas and Leal (2007) suggest that the party of the constituency represented, beyond just the party of the representative, will impact the way which in representatives vote, particularly within the House. For instance, “House Republicans, and members with districts that primarily vote Republican, are more likely to support restrictionist bills and amendments” (Casellas and Leal 2007). Finally, Ramakrishnan and Wong (2010) suggest that while partisanship is a large factor, the biggest factor in determining the passage of pro-immigrant ordinances is city size. Large cities, the authors argue, are most likely to pass pro-immigrant ordinances, while small and mid-size cities are more likely to pass restrictive bills.

Slide 3: Using the literature from the previous slide, I make predictions about Rep. Zoe Lofgren’s behavior in bills pertaining to immigration. First and foremost, Lofgren and her constituents in San Jose are highly Democratic, as seen by her vote margins. She is thus likely to vote alongside party lines on issues pertaining to immigration, as suggested by Casellas and Leal (2007). Second, the city is almost 40% foreign-born, which, according to Wong (2017), would suggest less support for restrictive immigration from Rep. Lofgren. Third, the city is very Latinx and Asian, so much so that both racial groups are more dominant than Whites in San Jose. According to Wong (2014), high proportions of these populations would suggest that Lofgren will support lax interior enforcement; furthermore, because the district is highly Democratic, the caveat he mentions of “Asian voters increasing enforcement support amongst Republicans” does not apply. Finally, San Jose is the 10th largest U.S. city and 3rd largest city in California. Given city size alone, according to Ramakrishnan and Wong (2010), Lofgren is likely to support passage of pro-immigrant ordinances. All indicators (partisanship, nationality, race, city size) thus point to Lofgren’s support of policies that will support immigrants.

Slide 4: The results are mostly consistent with the predictions made in the previous slide. In her campaign website, she emphasizes her leadership as the Chair of the House Subcommittee on Immigration and Citizenship, her experience as an immigration lawyer and professor, and her history as a granddaughter of immigrants. Immigration is the first of the four issues on her campaign website and one of nine (alphabetically listed) issues on her official website, and the language she uses is strongly supportive of DREAMers, reforms to welcome the “best and brightest” immigrants, and keeping families intact. She is not extremely active on Twitter, having only posted 15 tweets between January and March 2019. A third of those tweets, however, have been about immigration, in which she condemns the idea of the border wall and of separating immigrant children from families. Her bill sponsorship and voting record in office, meanwhile, mostly support her staunchly pro-immigrant image. In her time in the House, she sponsored 236 bills (the seventh-most of any representative), 59 of which were related to immigration. As 32% of her sponsored bills deal with immigration, it is her primary issue of interest, superseding other issues she is interested in. Her voting record is mostly consistent along Democratic party lines. She has, however, voted against the party on numerous occasions, which is surprising given the emphasis on partisanship being the primary indicator of voting behavior in the literature. Given other indicators of her pro-immigrant stance, though, it is possible that she may have had other considerations in her contrarian votes.

References:

https://ballotpedia.org/California%27s_19th_Congressional_District_elections,_2012

https://lofgren.house.gov/about/our-district

https://lofgren.house.gov/issues/immigration

https://zoelofgren.com/issues/protecting-dreamers/

https://zoelofgren.com/meet-zoe/

https://www.govtrack.us/congress/members/zoe_lofgren/400245

https://factfinder.census.gov/faces/tableservices/jsf/pages/productview.xhtml?pid=ACS_17_5YR_B05002&prodType=table

http://www.sanjoseca.gov/index.aspx?NID=109

The McGraw Center for Teaching and Learning
328 Frist Campus Center, Princeton University, Princeton, NJ 08544
PH: 609-258-2575 | FX: 609-258-1433
mcgrawect@princeton.edu

A unit of the Office of the Dean of the College

© Copyright 2025 The Trustees of Princeton University

Accessiblity | Privacy notice