Author: Henry Parkhurst

Himes’ reticence on immigration the right strategy

Summary: I outline the extent to which our national conversation around immigration, in the form of media coverage and politicians’ rhetoric, has become racialized. Research shows that this framework helps the GOP through emphasizing the racial threat narrative, so I argue that Democratic politicians should retain old rhetorical lines on immigration policy, asking and trying to answer basic policy questions without indulging in racial rhetoric. I outline Rep Jim Himes’ (D-CT) platform and public statements, arguing that he is going about talking about immigration in the right way, from the perspectives of serving his constituents and advancing the interests of the party.

Full op-ed here:  himes_reticence_parkhurst_oped


Demographic Changes and Political Attitudes in CT-4

I. Theory and Predictions
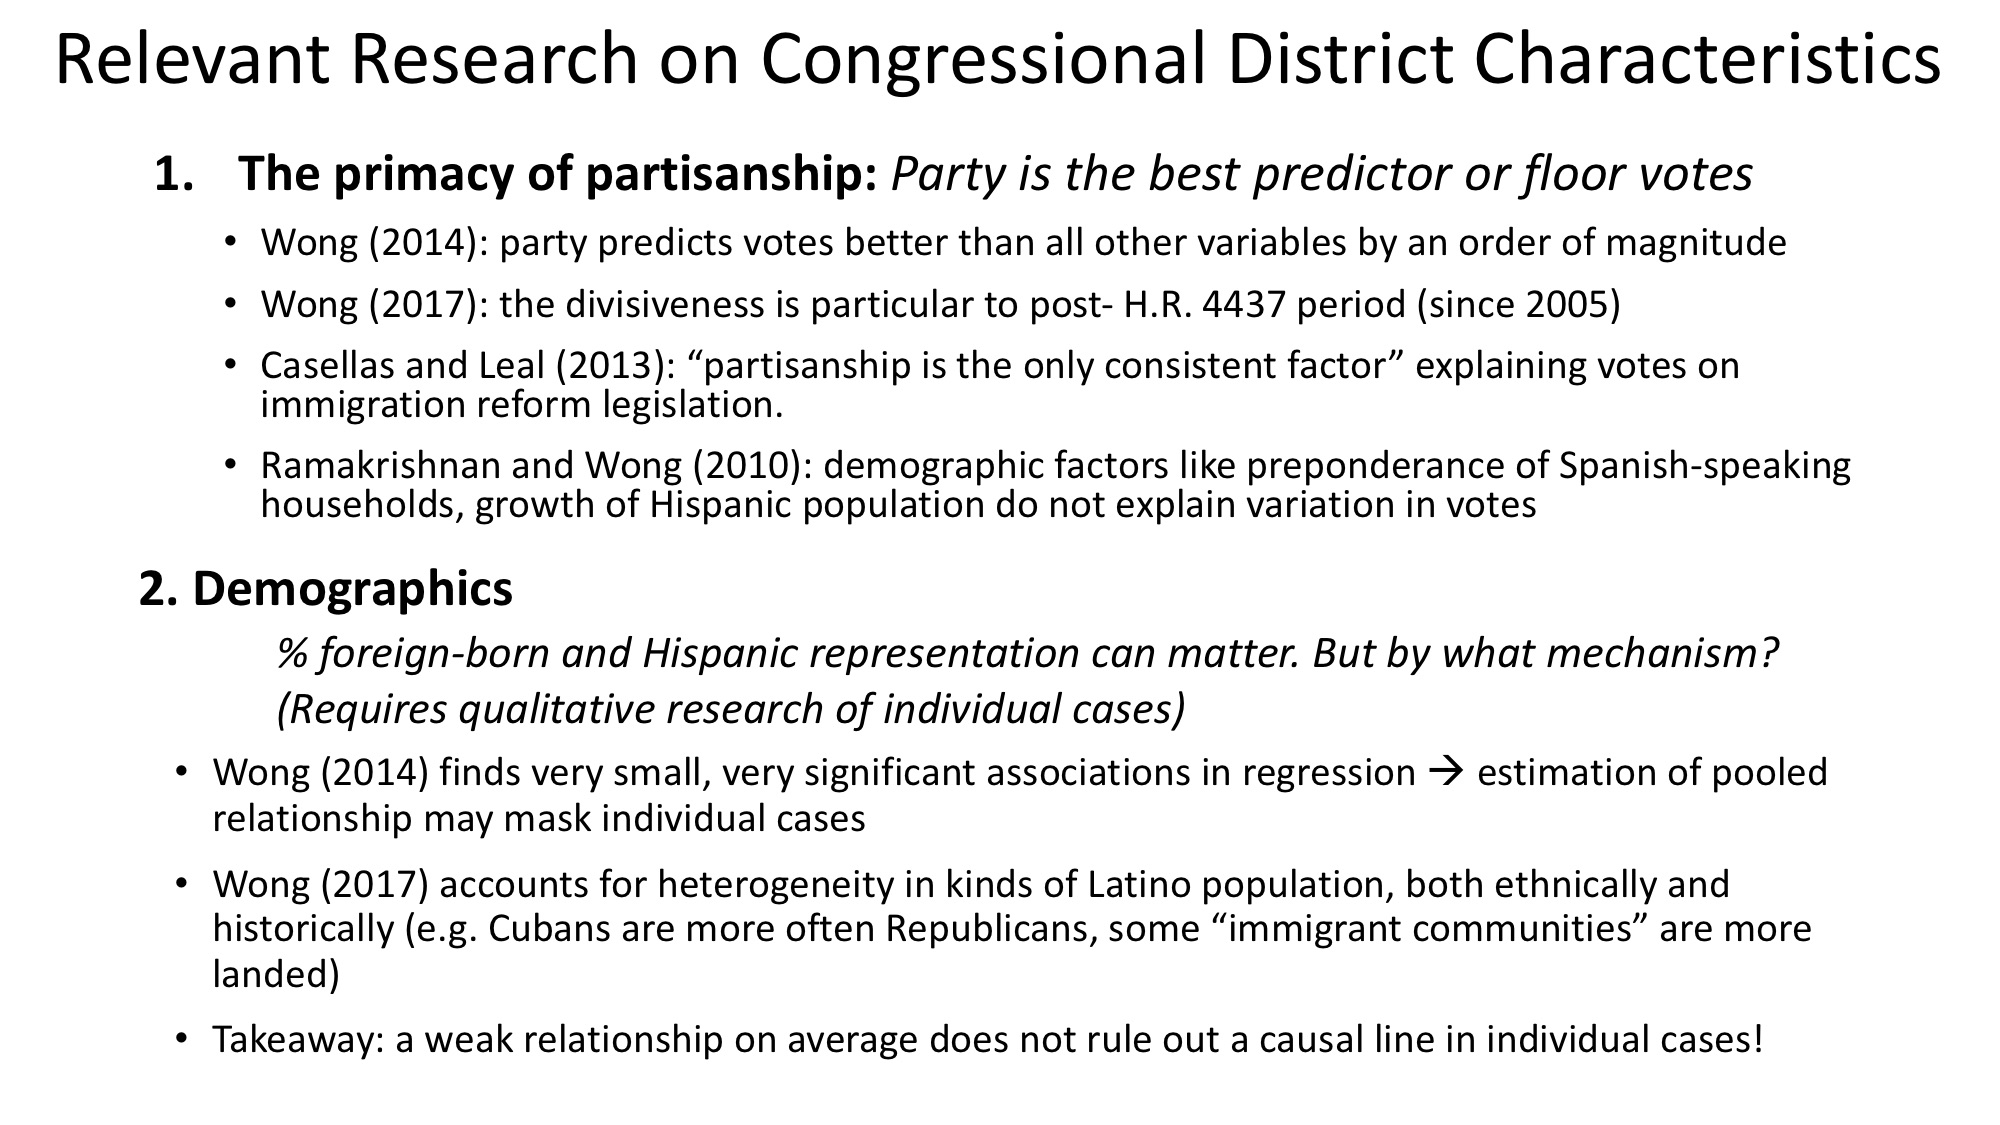
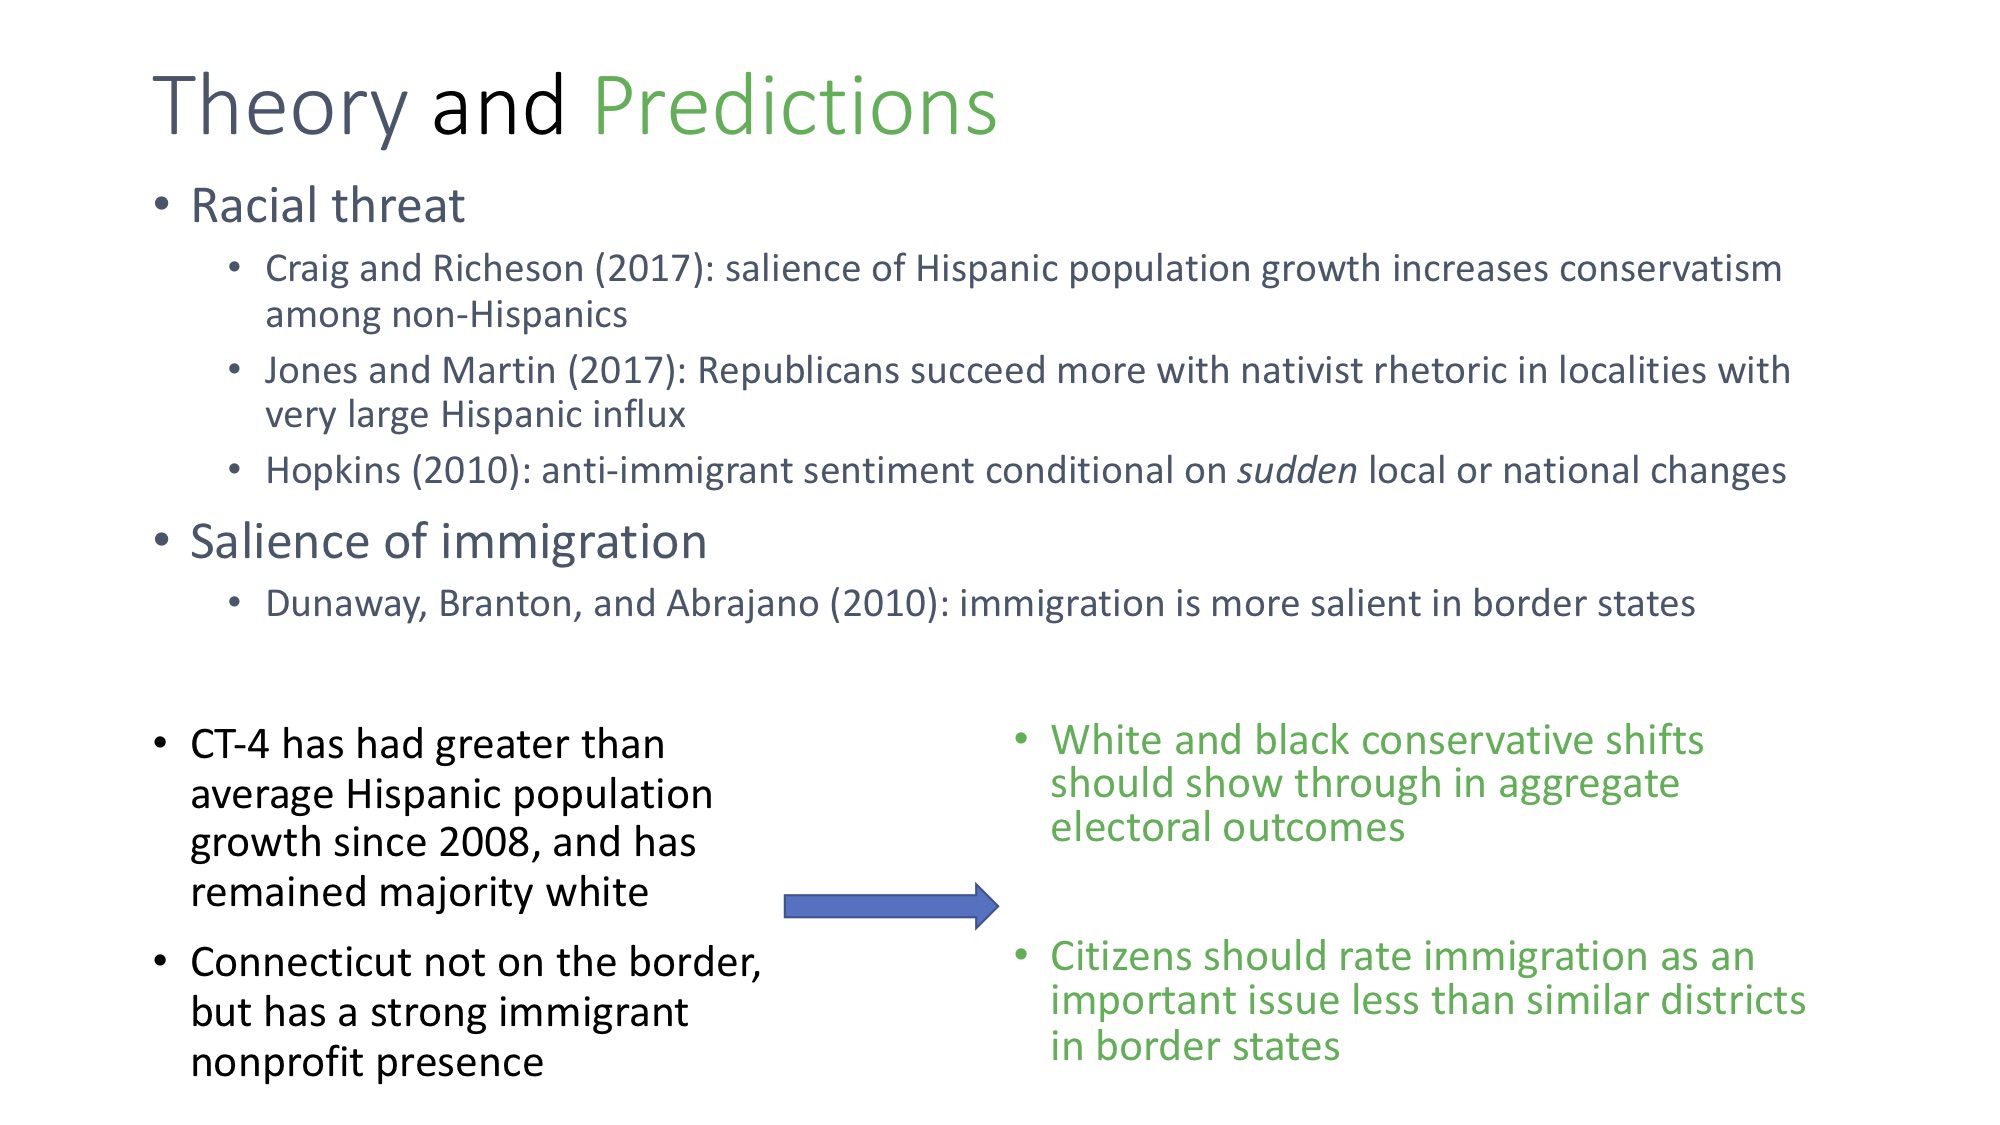
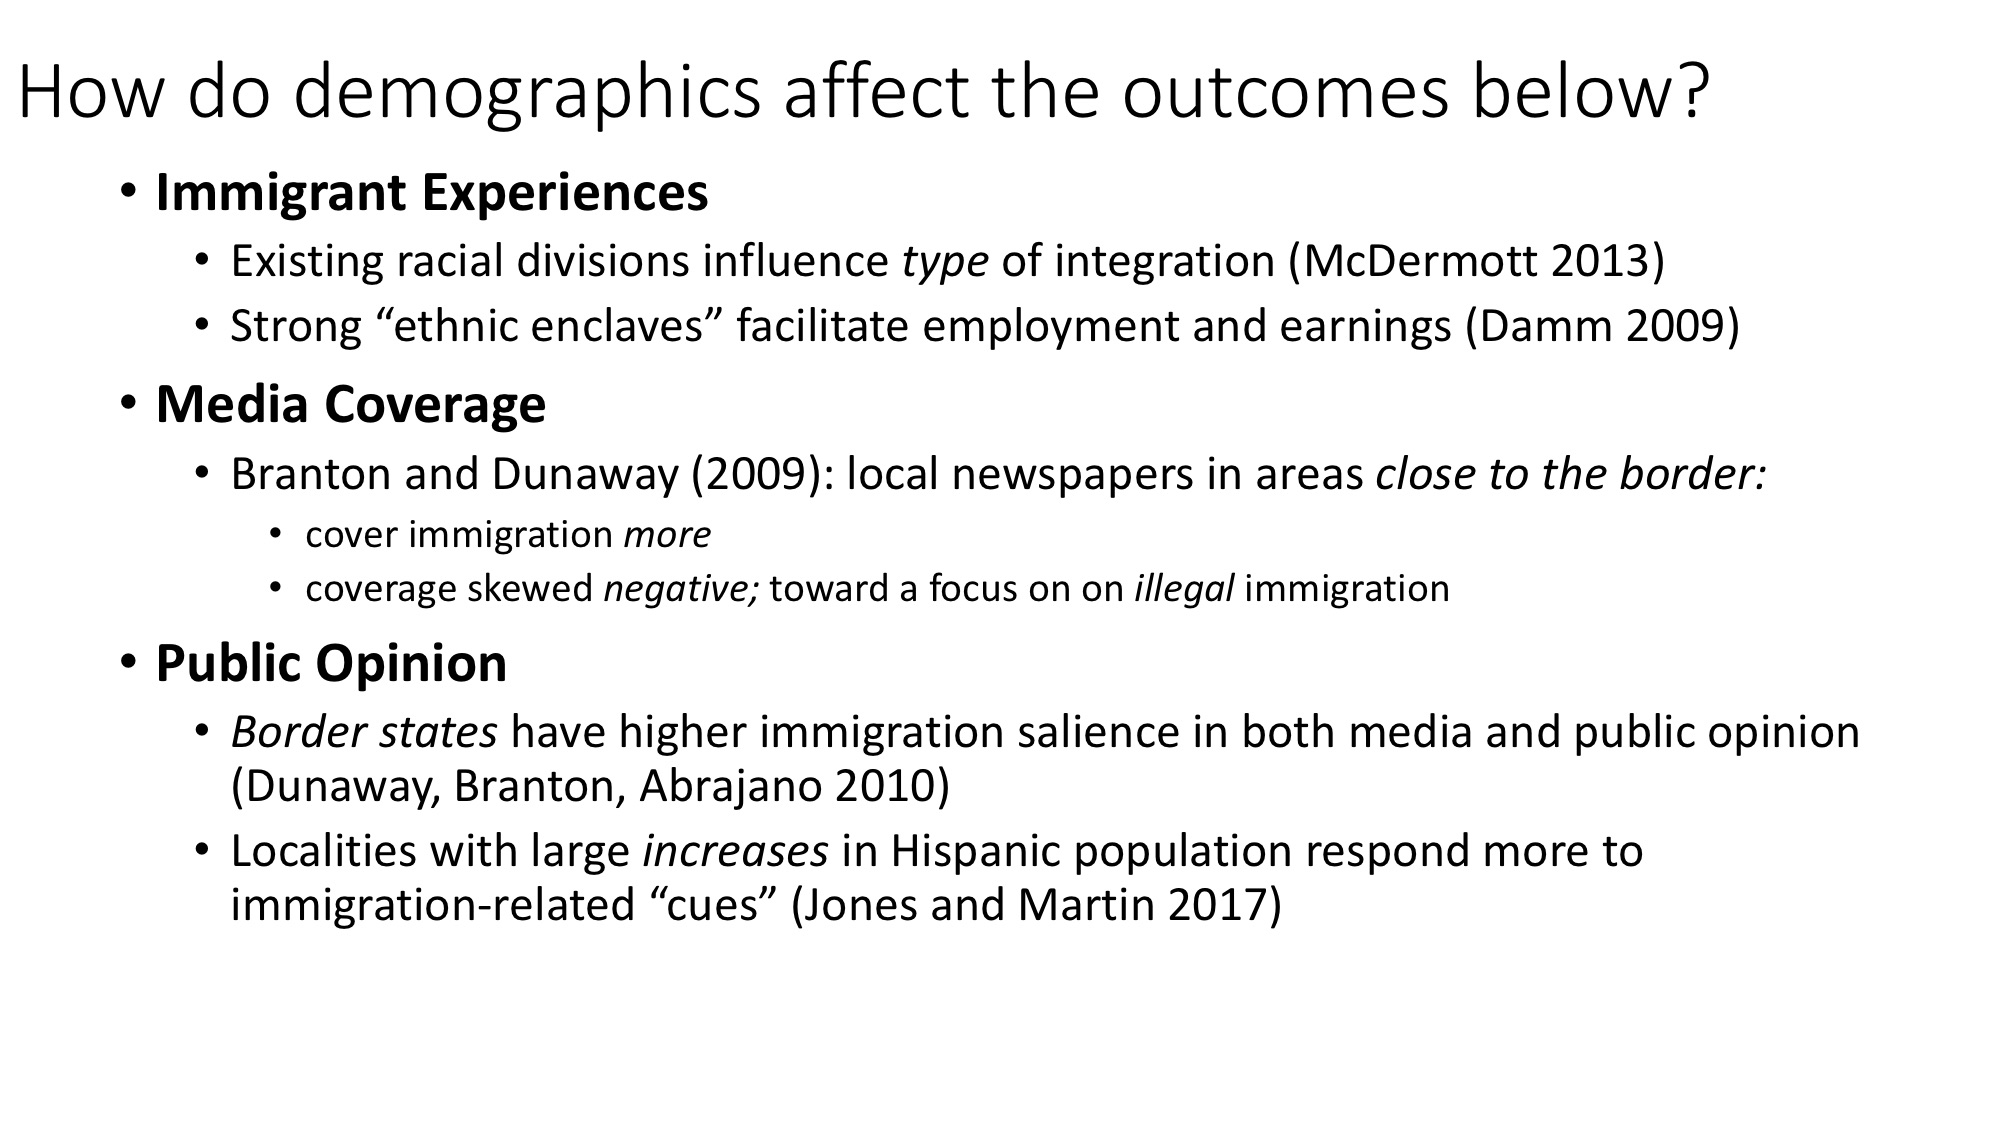
I test the effect of CT-4’s demographics on two outcomes: electoral outcomes and the importance of immigration to voters. Many papers (more than mentioned in the slide) have documented “racial threat,” or the tendency of whites to become more politically conservative when faced with the influx (or economic rise) of racial minorities. The papers listed in slide 1 identify particular effects, which are in fact much more conditional than the general trend of racial minorities triggering white conservatism. Craig and Richeson (2017) randomized priming of respondents with newspaper articles about the growth of the Hispanic population (or a control condition). Jones and Martin (2017) set a very large cutoff (>300%) for Hispanic growth, and Hopkins’ (2010) “politicized places” theory argues that a large influx influences political outcomes and attitudes mostly during intense national news cycles, and not in general. We should be cautious, then, about drawing a general connection between non-white Latino immigration and white conservatism; it seems that only when immigration is at the forefront of respondents’ minds does it have an effect on their politics. The second outcome is simply how much immigration matters to survey respondents. Dunaway, Branton, and Abrajano (2010) show that border states exhibit higher immigration salience in both local media coverage and survey respondents’ attitudes.

II. Data and Hypotheses
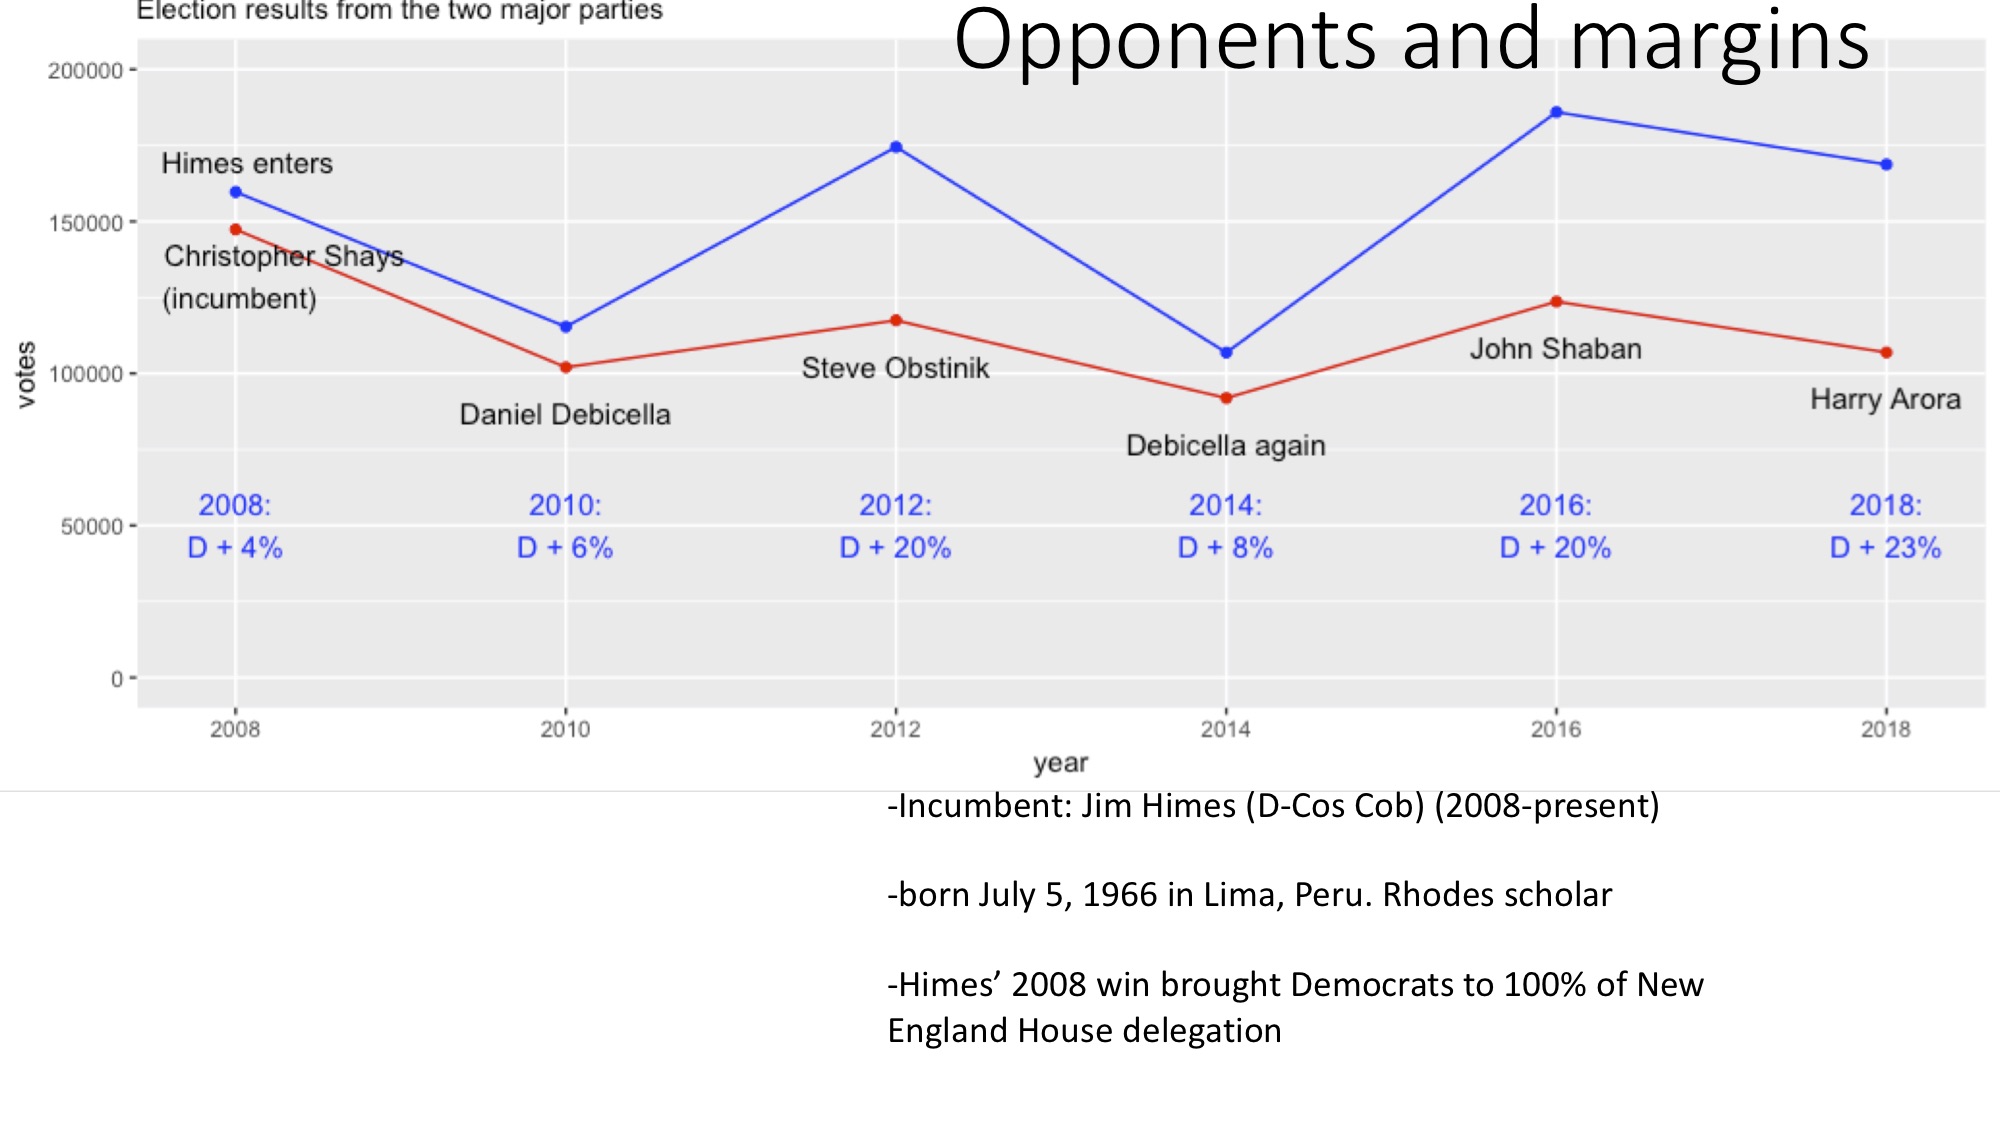
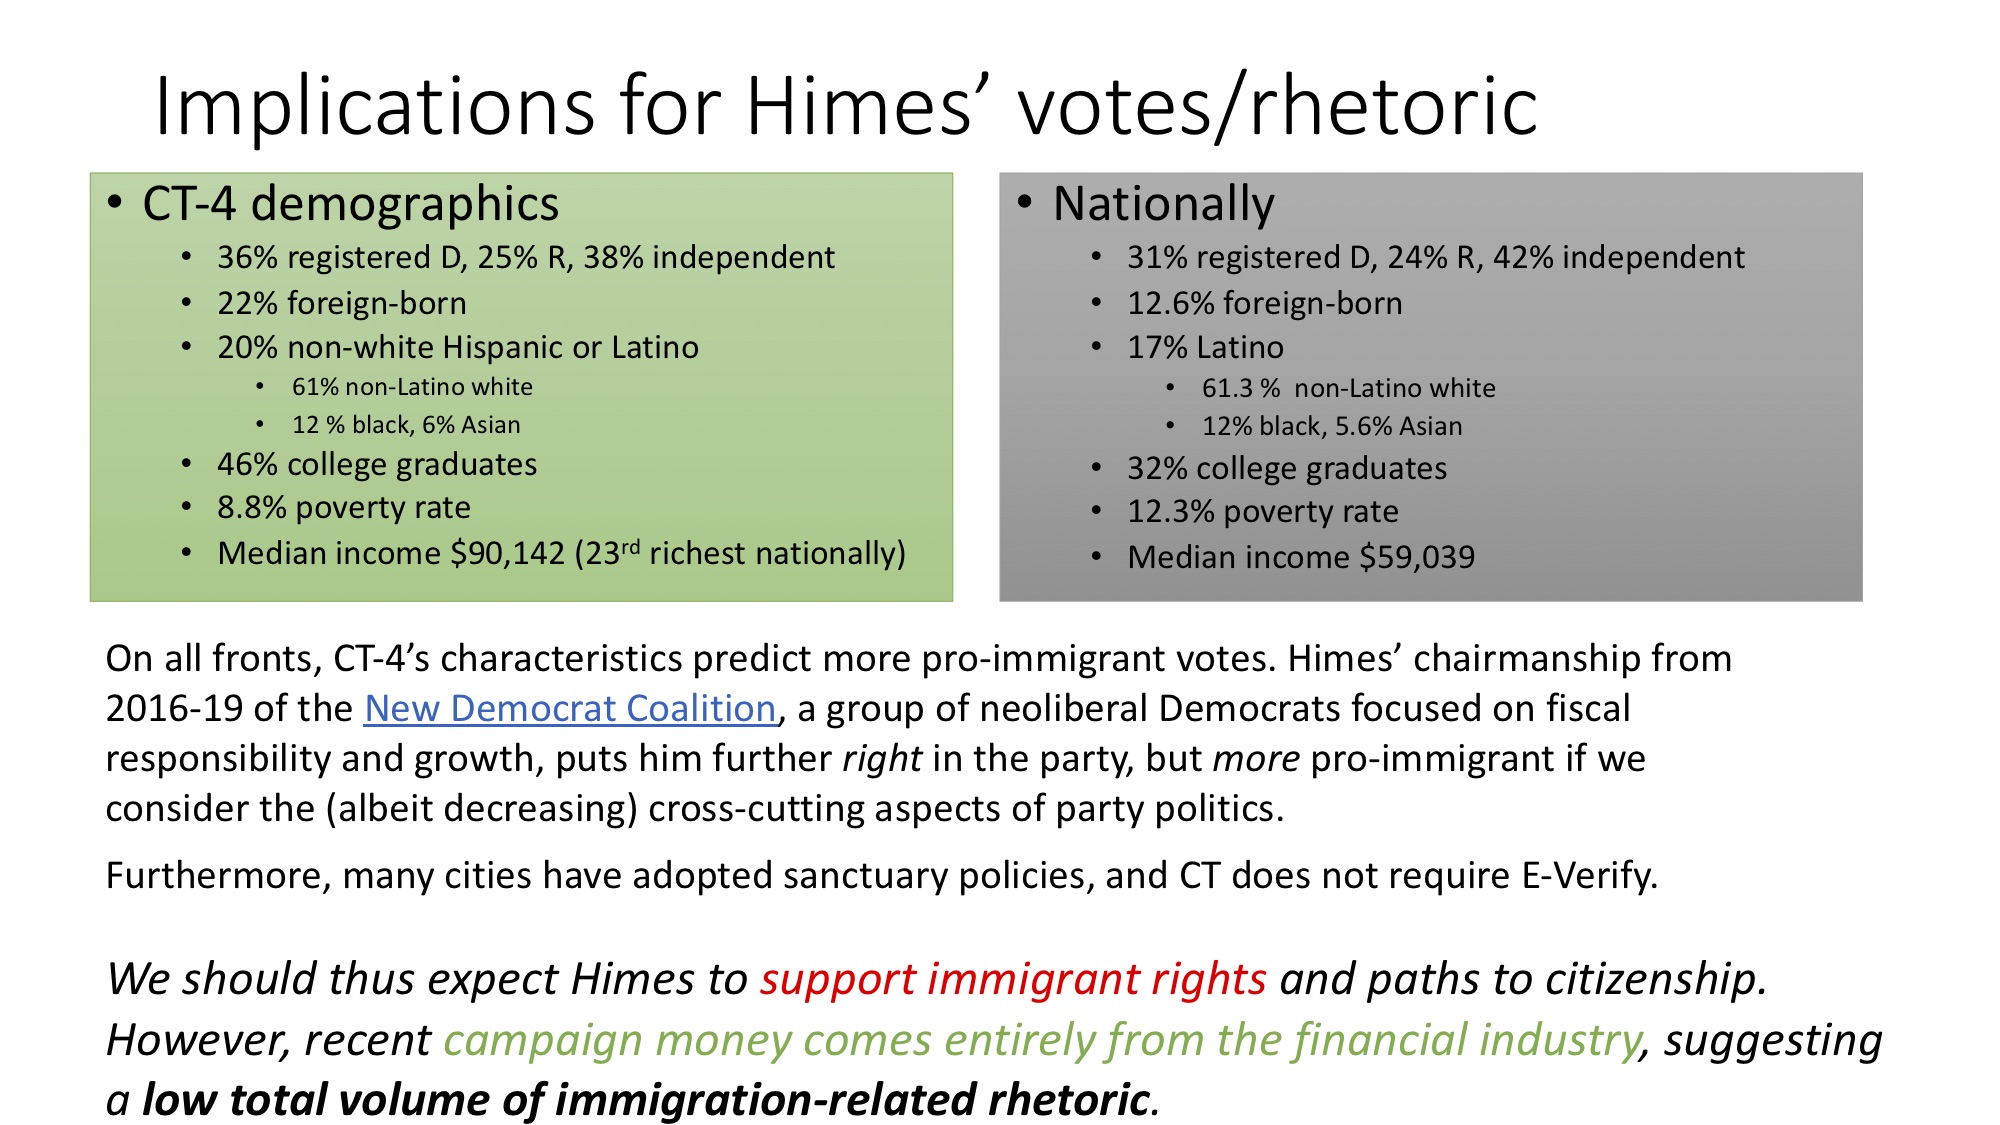
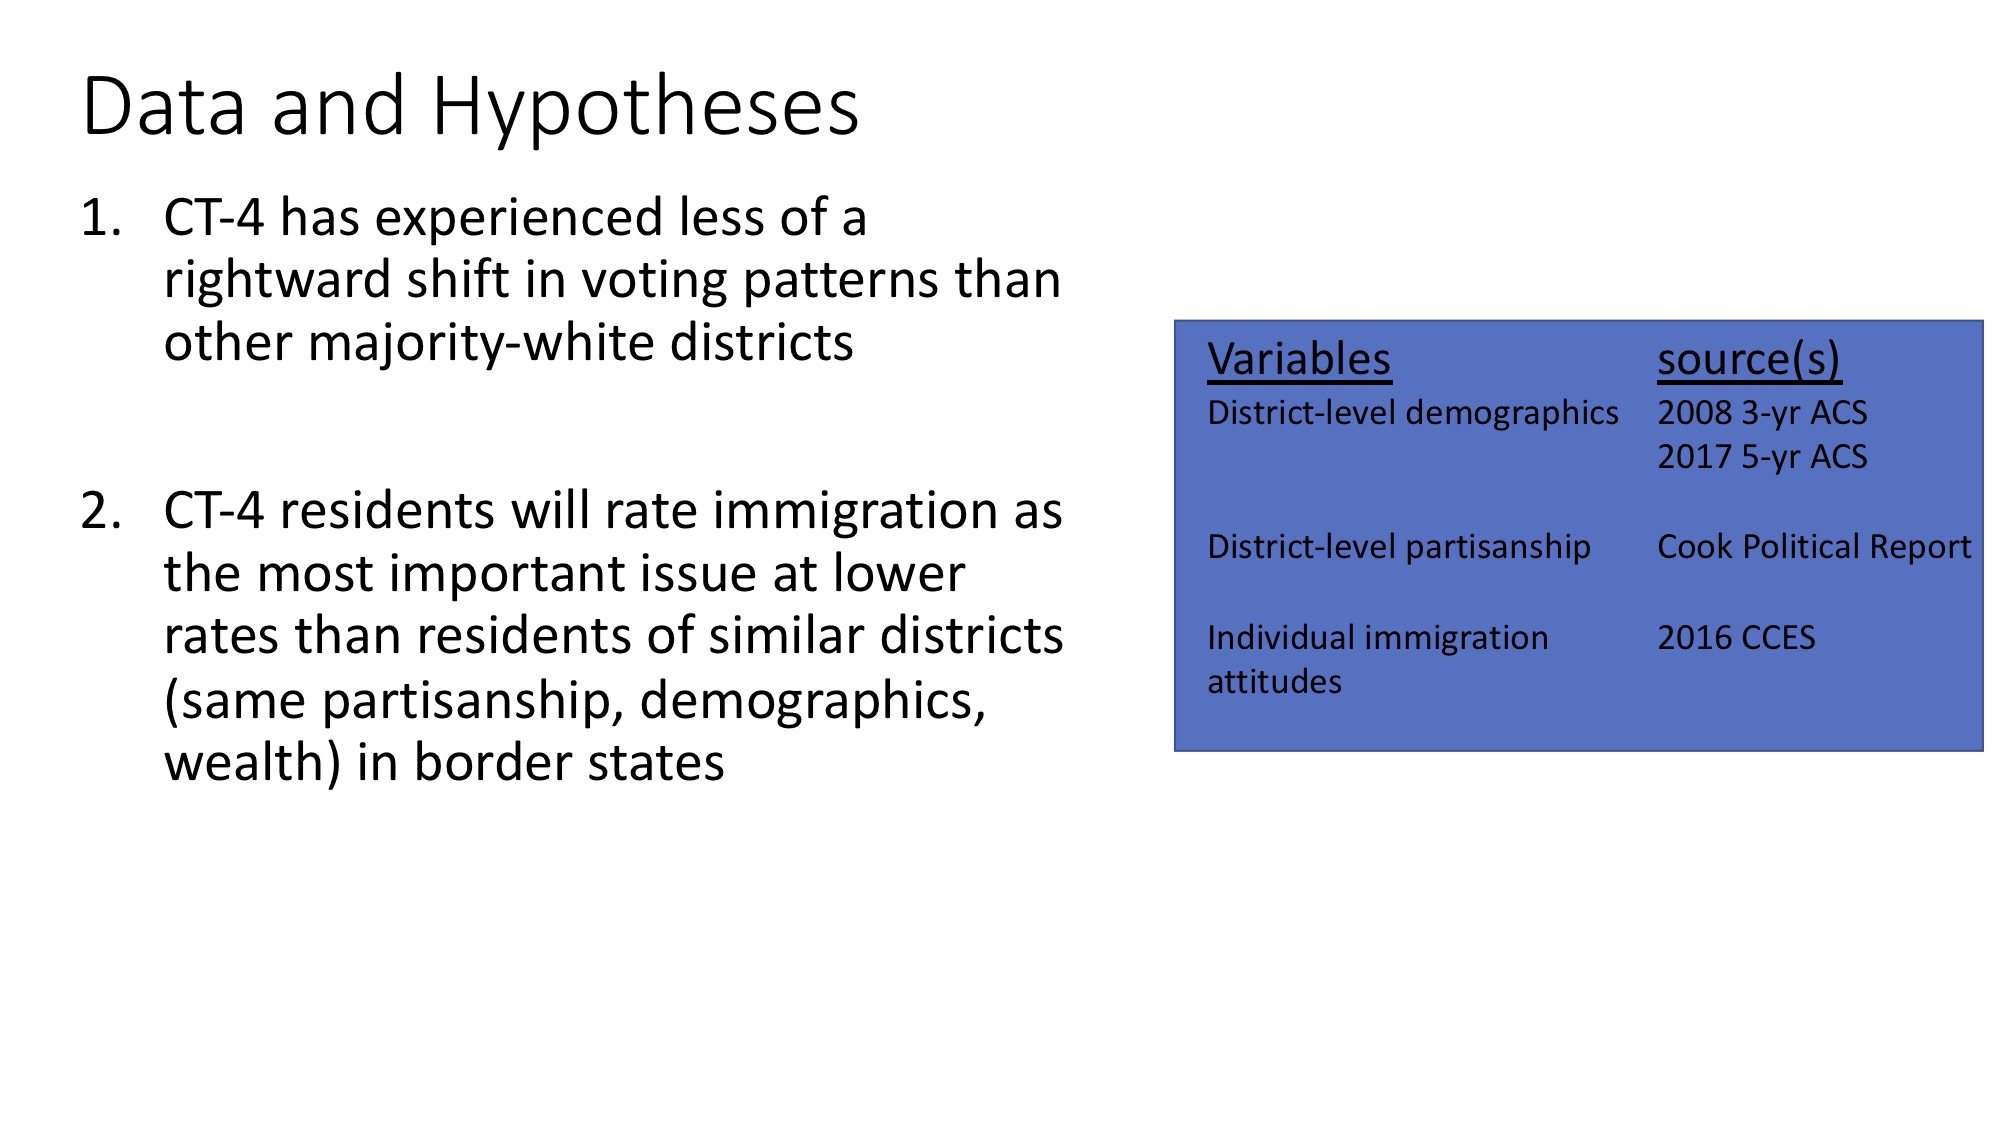
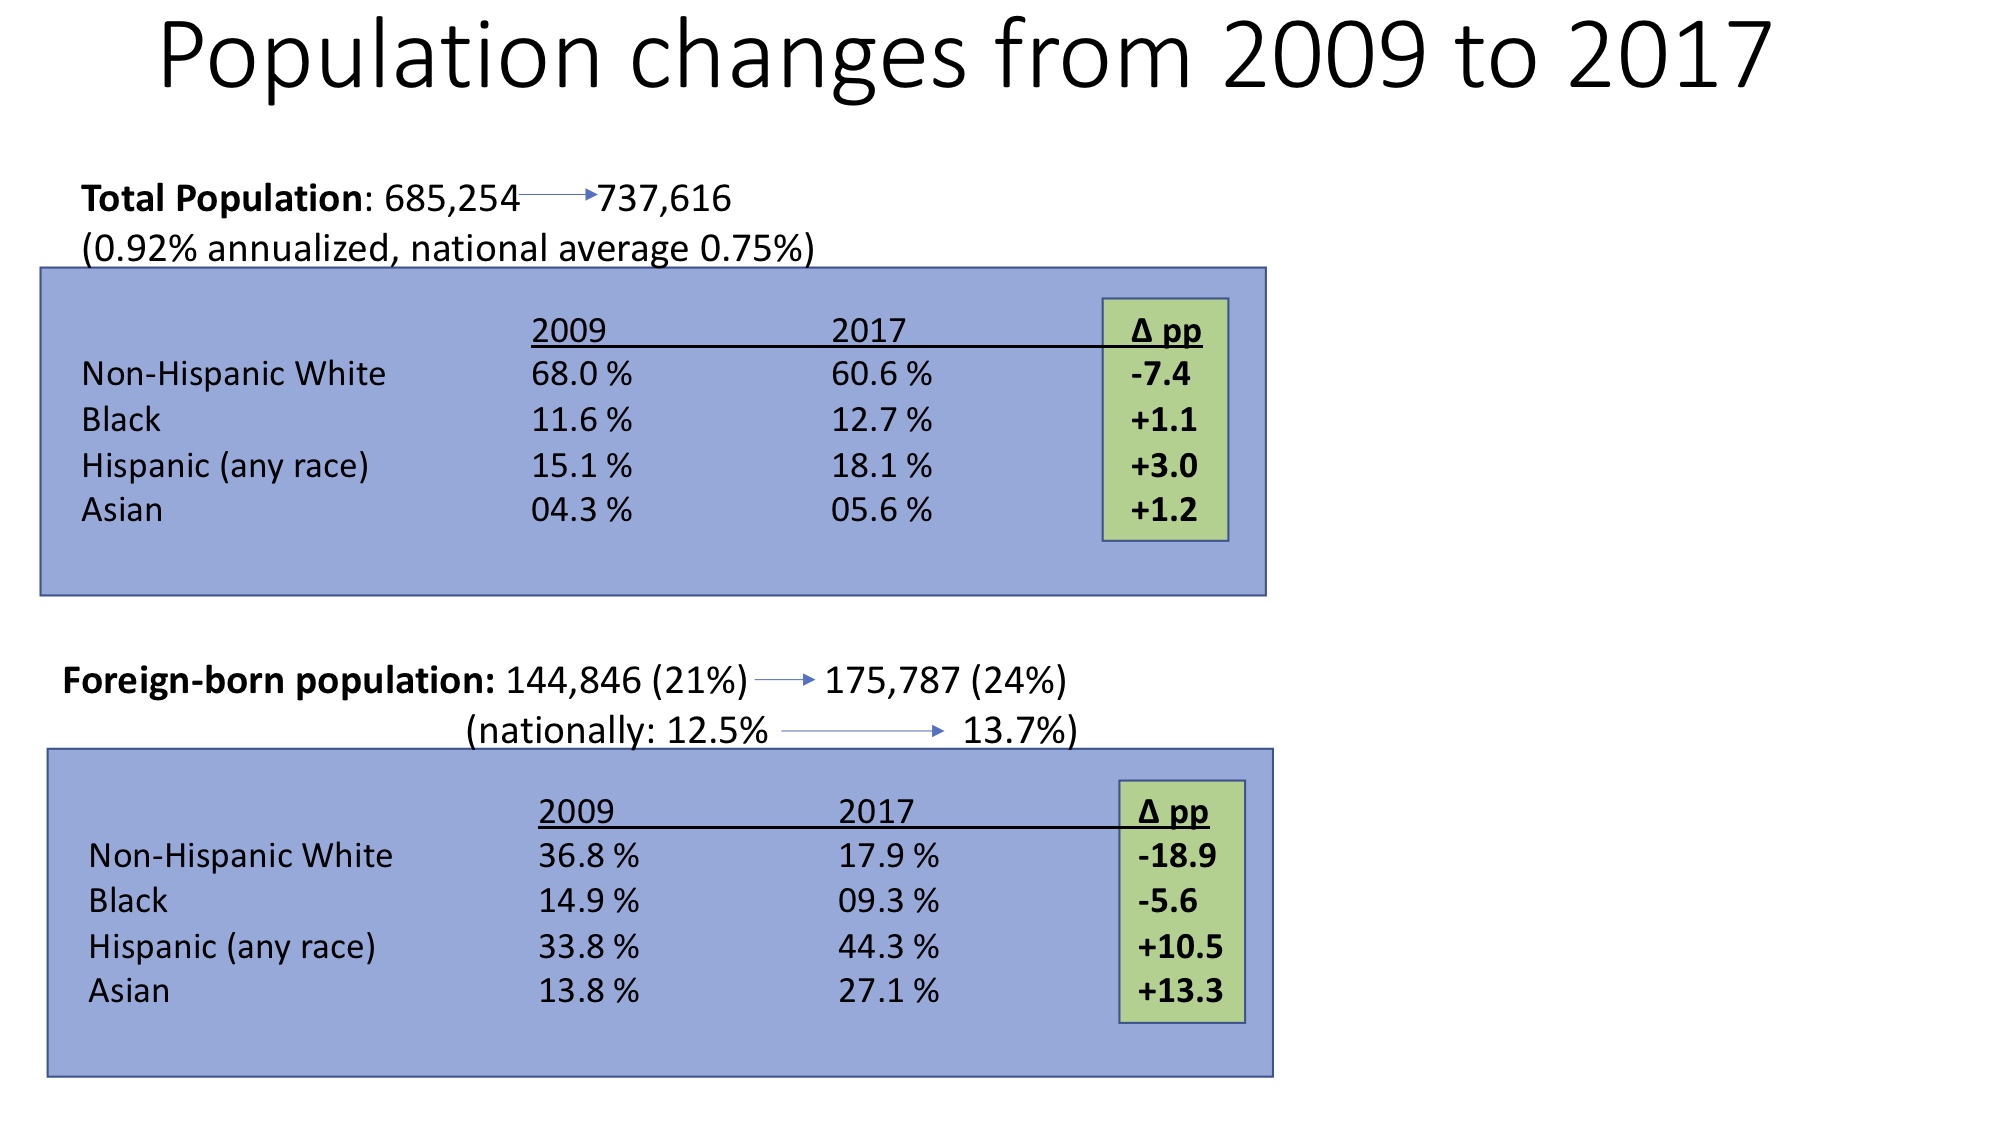
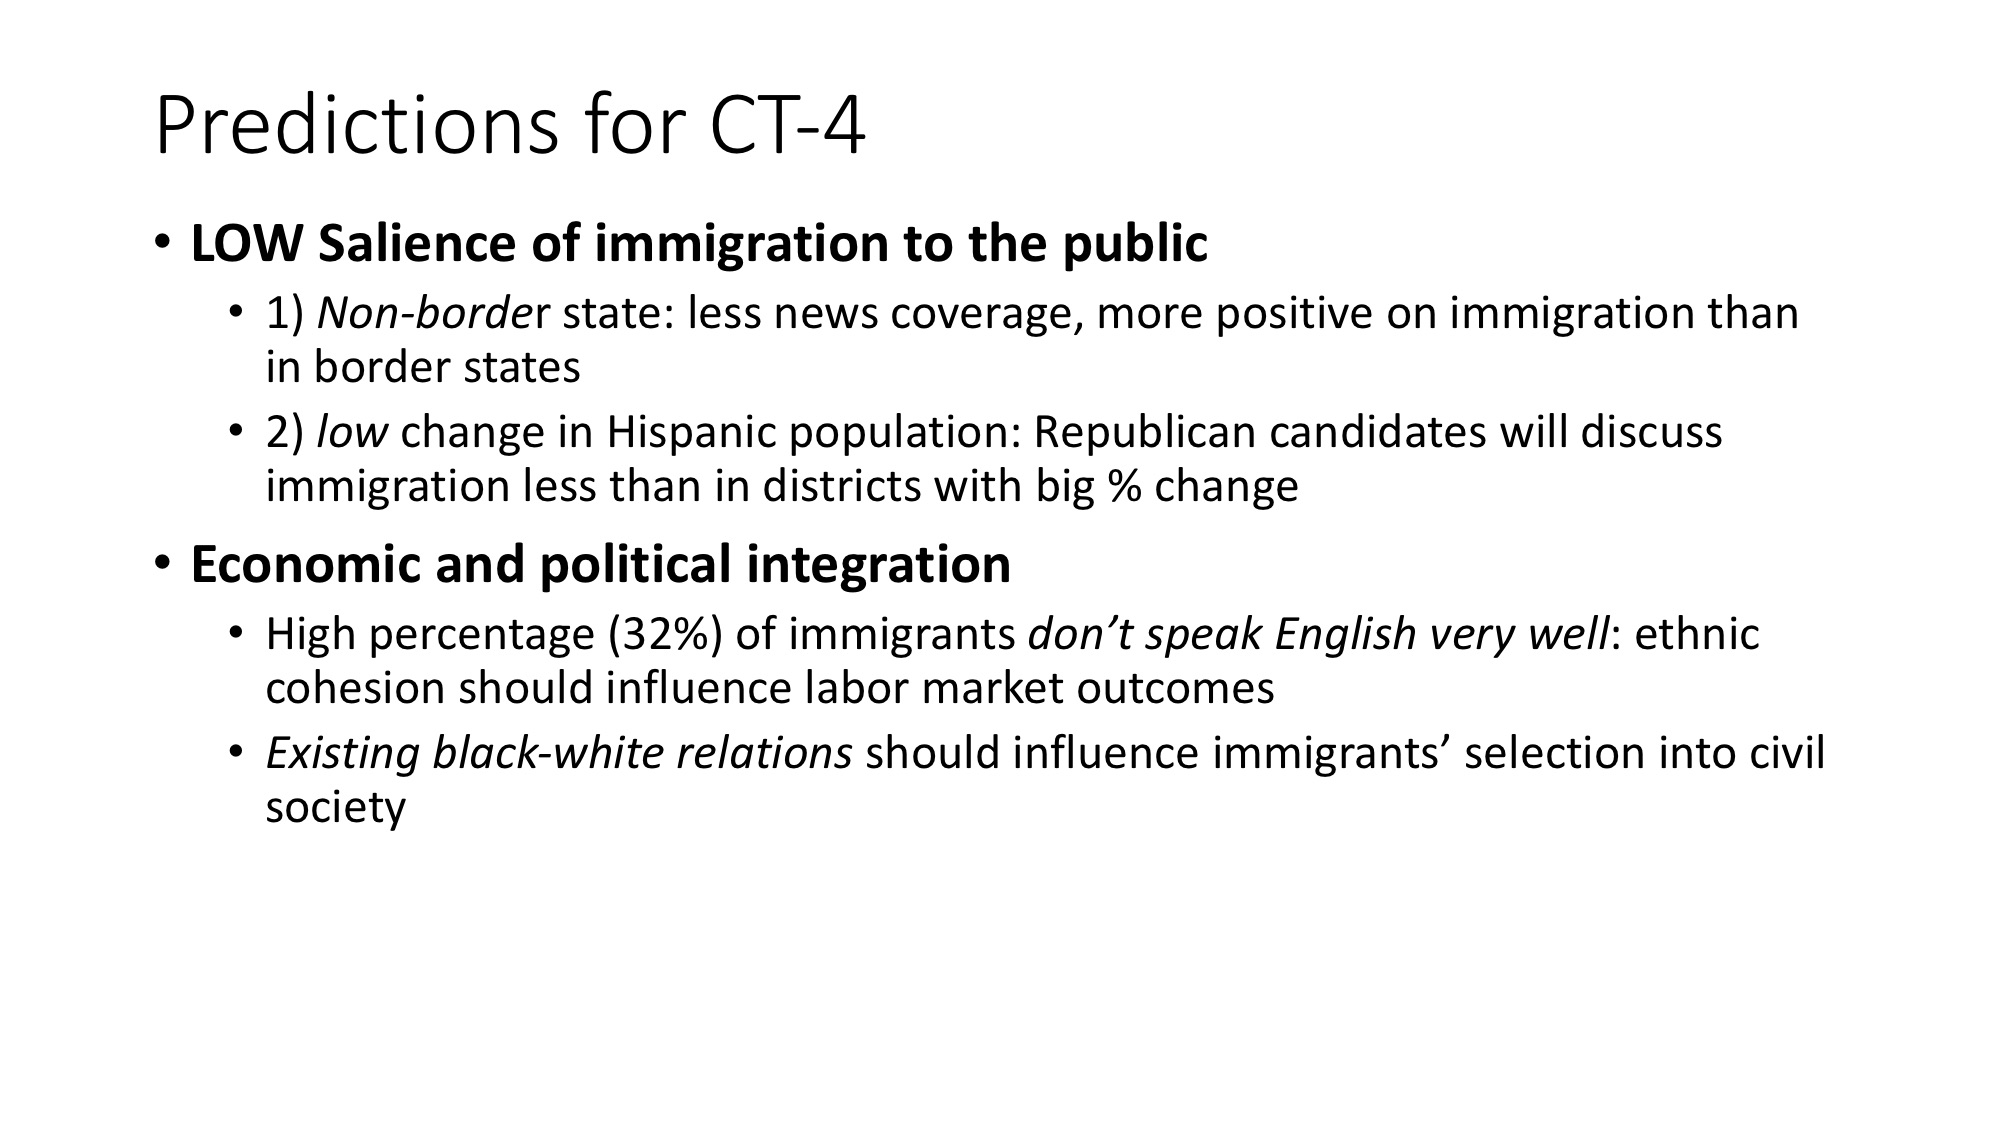
Because CT-4 has experienced greater-than-average Hispanic population growth since 2008, we might expect some white conservative shift in electoral outcomes. Such a finding would in fact fly in the face of the theories presented above because there is no activating mechanism like priming or a national emergency. Gathering data from the Cook Political Report (links below) and the American Community Survey (2008 3-year estimates, 2017 5-year estimates), I test the relationship between change in non-white Latino population (2008-2017) and change in Democratic vote share (2018 minus 2008), hypothesizing a negative relationship for majority white districts. Because CT-4 is majority white, but it did not experience “massive change,” it should fall above the line of best fit between these two variables. With respect to immigration salience, I use survey data from Harvard’s 2016 Cooperative Congressional Election Study. Using ACS data to identify very similar districts to CT-4, I ask if Dunaway et al.’s findings apply to districts like CT-4 in particular; if they do, we should witness a significant difference between respondents’ attention to immigration in matched districts in border states and their attention in CT-4.

III. Results: H1
I excluded all districts that had uncontested elections in either year, because electoral margins of 100% do not accurately reflect district-level partisanship. The bivariate plot in slide 3 shows the positive relationship between Democratic gains (∆pp) and percentage change in non-white Latino population growth (outliers mostly in FL and CA) for minority-white districts. This relationship is very significant (p < 0.005), but the coefficient for non-white Latino growth is not significant at any level for majority-white districts. Rather than the negative relationship we expected, it seems changes in Democratic vote share cannot be explained better by non-white Latino population changes than by a guessing the average. We do see CT-4 above the line of best fit as hypothesized, but that difference from the prediction is not due to the fact that its change in non-white Latino population was not sufficiently extreme; were that the case, the regression would be significant. Instead, I would ascribe that result to randomness, or even better to the massive number of other factors that influence electoral outcomes. Many traditionally Republican households in the northeast flipped blue in response to Trump, for example. In conclusion, we fail to conclude that a non-white Latino influx had any effect on district-level electoral outcomes, either for CT-4 or for non-majority-white districts in general.

IV. Results: H2
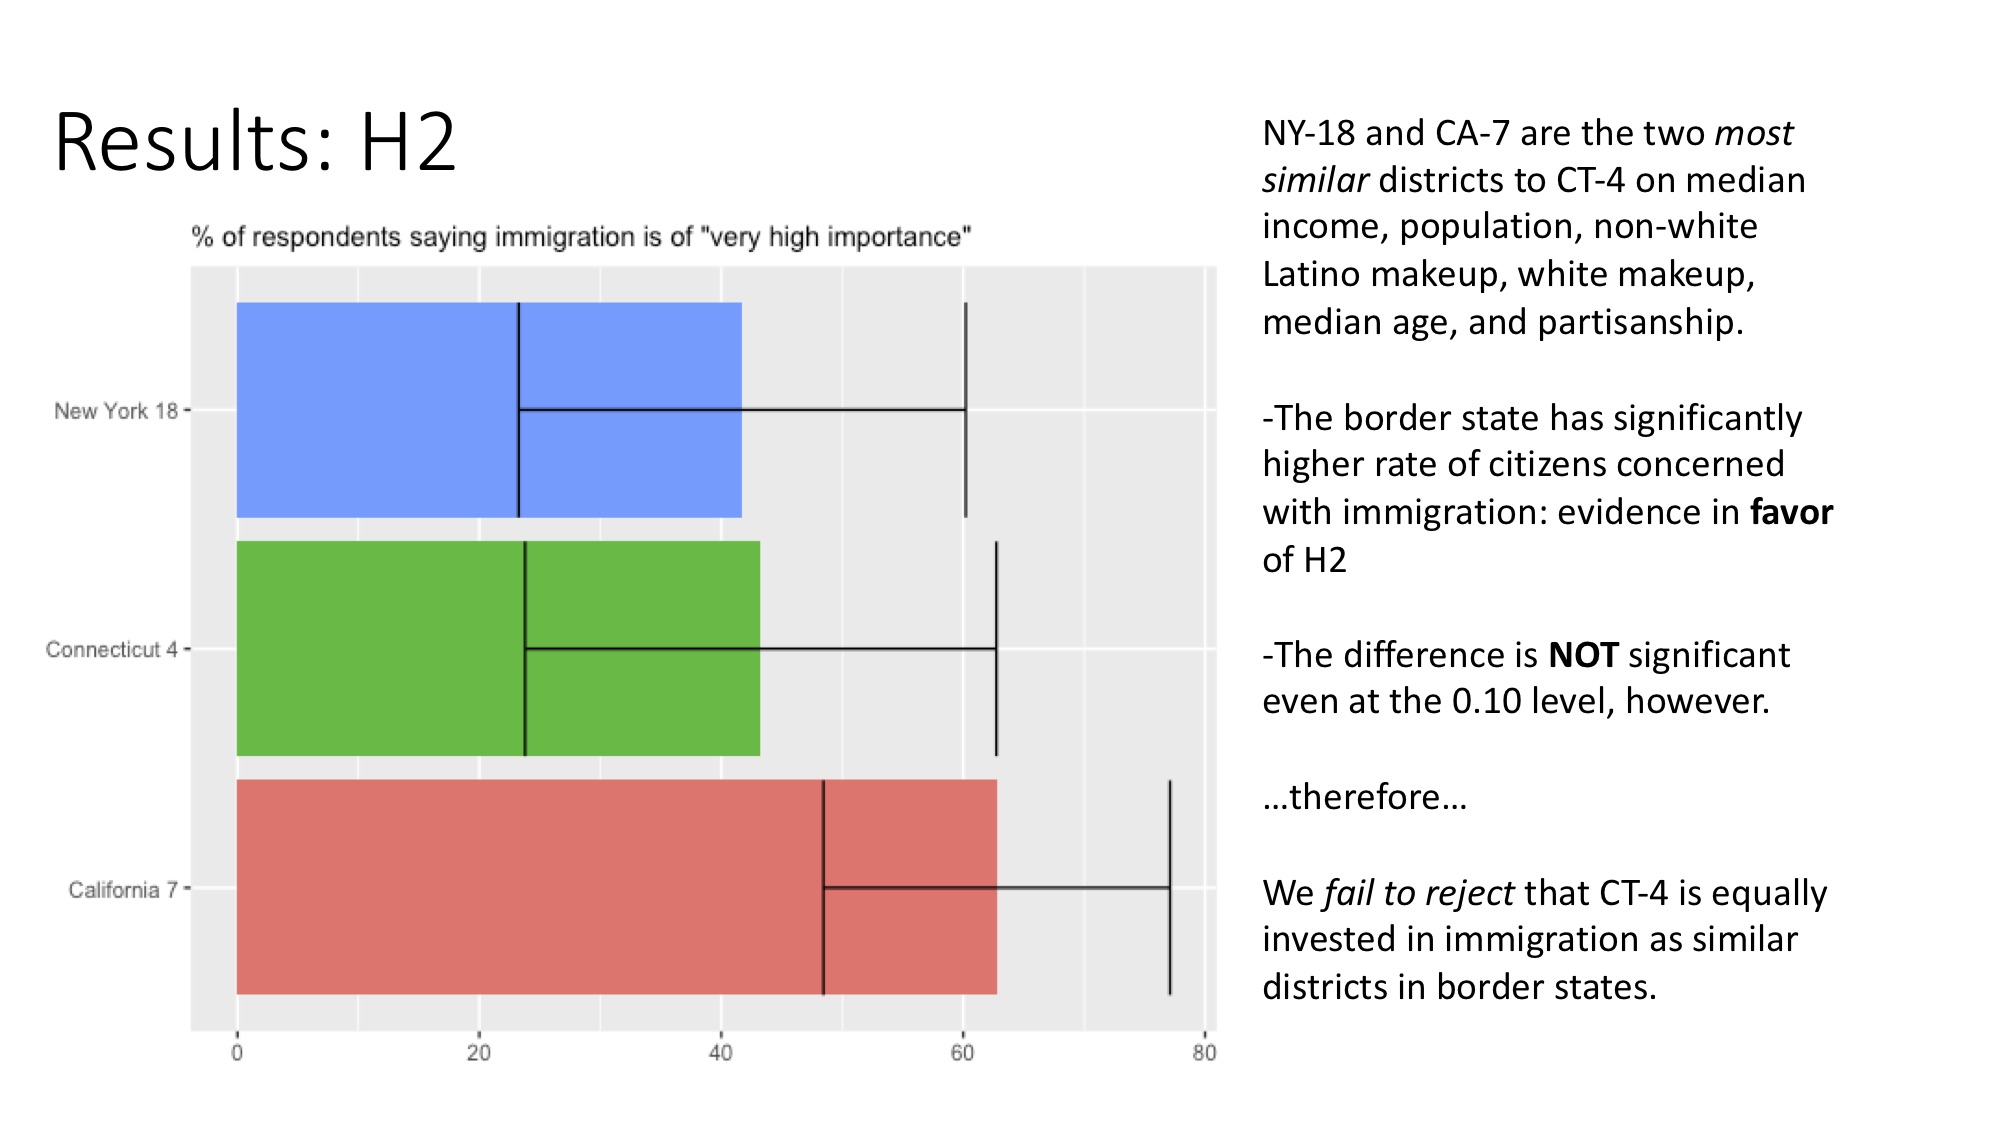
In general, aggregate estimates can mask heterogeneity; that is, an “average treatment effect” is an average and might miss interesting patterns. To know if border-state status causes higher immigration salience for districts like CT-4, or put another way, if CT-4 is less invested in immigration on account purely of its non-border status, I employ a matching scheme. Using the ACS 5-year “Selected characteristics of the native and foreign-born populations,” I identify all districts that are within half a standard deviation of CT-4 on the following variables: median age, median household income, percent non-white Latino, percent white, population, and Democratic vote share (measured from Cook Political Report data). This resulted in two other districts: CA-7 and NY-18, which is right next to CT-4! This “matching design” infers a causal effect of the “treatment” (being on the border vs not) on the outcome (survey respondents’ rating of immigration), on the assumption that we observe all other variables that could conceivably change the outcome. This is surely false, but we get a good estimate. The bar chart shows weighted means (using CCES “pre” weights), with 95% confidence intervals, of the percentage of voters who think immigration is “very important.” While CA-7 voters say so at higher rates than CT-4 voters, the difference is not significant. This difference might be significant if we had more than 99 responses (45 for CA-7, 26 for CT-4, and 28 for NY-18), but it is the data we have. We thus fail to reject the null hypothesis that immigration salience does not vary between medium-sized, liberal, wealthy districts on and off the border.

V. Links
Link to 2008 election data: https://www.fairvote.org/overview-and-data
Link to 2018 election data: https://docs.google.com/spreadsheets/d/1WxDaxD5az6kdOjJncmGph37z0BPNhV1fNAH_g7Ikp C0/edit#gid=0

VI. Works Cited
Craig, Maureen A., and Jennifer A. Richeson. 2018. “Hispanic Population Growth Engenders
Conservative Shift Among Non-Hispanic Racial Minorities.” Social Psychological and Personality Science 9 (4): 383–92. https://doi.org/10.1177/1948550617712029.

Dunaway, Johanna, Regina P. Branton, and Marisa A. Abrajano. 2010. “Agenda Setting, Public Opinion, and the Issue of Immigration Reform*.” Social Science Quarterly 91 (2): 359–78. https://doi.org/10.1111/j.1540-6237.2010.00697.x.

Hopkins, Daniel J. 2010. “Politicized Places: Explaining Where and When Immigrants Provoke Local Opposition.” The American Political Science Review 104 (1): 40–60.

Jones, Bradford, and Danielle Joesten Martin. 2017. “Path-to-Citizenship or Deportation? How Elite Cues Shaped Opinion on Immigration in the 2010 U.S. House Elections.” Political Behavior 39 (1): 177–204. https://doi.org/10.1007/s11109-016-9352-x.

Population Characteristics of CT-4

I. Population Changes since 2009

The first slide reports changes in each race’s representation in CT-4 from 2009 to 2017. We see that CT-4’s total population grew faster than the national average at an annualized rate of 0.92%. The share of residents born abroad is both higher and grew faster in that period than the national rate, as well.

The top-line numbers in the green box give the overall percentage point changes of each race both in total and among the foreign-born population in CT-4. Among the total population , we see marginal increases in representation across all races, with whites making up a smaller share. This difference is even more pronounced among the foreign-born population; Asians and Latinos are clearly driving immigration into the district.

II. Literature review

We know that both local and national characteristics drive immigrants’ integration experiences and public image. I consider the dependent variables in turn.

Immigrant experiences: Monica McDermott coins the term “bureaucratic integration” to describe one means by which immigrants get involved with their communities. She argues that immigrants choose to get involved in organizations like schools or local policing when there is not racial animosity between them and local whites; this is more likely when local black Americans are the existing outgroup. With respect to economic integration, we can expect a causal effect of the strength of ethnic communities on labor market outcomes. Specifically, Anna Damm finds evidence in Denmark that linguistic similarities allow a higher flow of information for immigrants in “ethnic enclaves.”

Media coverage: Literature has focused on tone and prevalence of immigration coverage in the media. Branton and Dunaway (2010) find that local media in border states “generate a higher volume of articles about Latino immigration, articles featuring negative aspects of immigration, and articles regarding illegal immigration.”

Public opinion: While we have seen in class that the salience of immigration can often depend on national-level features like big news stories, local-level characteristics matter too. Immigration is a more salient issue for citizens of border areas according to Dunaway et al. (2010). Also, big demographic changes can make immigration more important to voters; Jones and Martin (2017) identify defining features of areas with a big change in the Hispanic population. At the state level, states in the 75th percentile or above in change from 1990-2010 (~375%) count, and they use a continuous measure of district-level change. They find strong relationships between “large change in Hispanic population” and “influence of candidate cues on immigration,” meaning that in such areas, Republican politicians’ restrictionist cues generate more of a response than in other areas.

III. Predictions for CT-4

With respect to immigrant experiences, we need to interview citizens and immigrants in the area to understand the salience of race in both their decisions on how to integrate into civil society, as well as the extent to which they rely on ethnic networks to get economic information. The 2017 ACS estimates that 32% of the foreign born population speaks English less than “very well”  (compared to 3.7% of the native population), suggesting that ethnic cohesion may be a relevant variable.

With respect to immigration salience, we would expect Republicans not to emphasize immigration/restrictionism because Connecticut is not a border state. While CT-4 has experienced a 3 percentage-point increase in Latino population, which is much larger than the 1.2 pp increase in the US, it does not seem to get close to the 375% increase determined by Jones and Martin (2017). Furthermore, we should expect less local media coverage, and more positive coverage, of immigration than in similar border states. We next turn to measuring this effect.

IV. Testing the effect of location

I will ask the question whether Connecticut’s status as a non-border state causes its local- and state-level media coverage of immigration to be systematically less prevalent and more positive. I will employ a matching design, whereby I identify districts that are similar to CT-4 in every conceivable way that could influence media coverage of immigration, with the only difference being that the district is in a border state. That is, I will identify border-state districts similar to CT-4 in income, (change in) racial makeup, percent foreign-born, and partisanship. On the (very strong) assumption that we have observed ALL covariates that could conceivably influence media coverage, we can estimate the causal effect of border status on media coverage. After identifying these districts, I will acquire newspaper articles using the LexisNexis database, coding articles for their topic and their sentiment. I can then test the rate of immigration-related articles as well as their positivity/negativity, to test the border-state hypothesis of Branton and Dunaway (2009).

CT-4: Jim Himes (D)

Himes announced his candidacy on April 19, 2007, quickly receiving endorsements from several political action committees. His campaign was targeted by the Democratic Congressional Campaign Committee (DCCC) as a potential flip; indeed, he beat Republican incumbent Christopher Shays by a slim margin of 4 percentage points and has held the seat since. The figure in slide 1 shows vote counts by party in every election subsequent for this seat. Two patterns emerge that are consistent with broader literature. First, turnout was higher in presidential election years. Second, as a Democrat, Himes faced tighter races in Obama’s midterm years (2010 and 2014); we see tighter spreads in those years. (The President’s party typically underperforms in midterms.)

This slide cites literature that we have reviewed in class, mostly focusing on understanding systematic relationships between district-level characteristics and representatives’ propensity to vote for restrictive or permissive immigration policies. Multivariate analyses from Tom Wong and others find consistent patterns; members’ political party can predict these outcomes better than any other variable. However, party is downstream of properties of the district, and none of these studies directly measured constituents’ opinions on immigration. We might wonder then, whether it is in fact party, or instead these unobserved upstream properties, that are truly causing more or less restrictive floor votes. For that reason, we especially care about individual cases when investigating this question. Demographic characteristics like percentage of Hispanics or percent foreign-born are found to be significant, but with very weak point estimates, in Wong’s regressions (2014). This suggests these factors might retain salience in individual cases.

CT-4’s characteristics predict Himes to be quite liberal on immigration. The district is suburban and generally well-educated. It has a higher proportion of registered Democrats and a higher median income than the national average. Himes is nonetheless relatively conservative among House Democrats. His DW-NOMINATE score is -0.241, making him more liberal than 54% of the House, and more conservative than 84% of House Democrats. (source: Voteview) The relative wealth of CT-4 is perhaps the best explainer for this score; as former chair of the New Democrat Coalition, Himes has made clear his commitment to “pro-growth” policies including lower taxes. This neoliberal outlook would presume a preference for more open immigration policies, too.


Himes is active on Twitter, but not particularly so with respect to immigration. He has mostly criticized the President’s border wall proposal, arguing that it is ineffectual. On his website, he expresses a commitment to border security, along with a path to legalization for undocumented immigrants “in order to ensure that everyone pays their full and fair share of taxes.” Himes is not a legislative leader on the issue of immigration, as you can see in the top right hand corner of slide 4; his only sponsored bill was defeated in 2010. He has only broken with House Democrats a couple times on immigration votes: once in 2012 re: skilled immigration, and once in 2018 on a symbolic resolution about the voting enfranchisement.


Is Partisanship Eclipsing All Else?

This week’s readings are topically distinct, focusing on the process of border militarization, racial construction, and explaining floor votes, respectively. One thread I’ve noticed through this week, though, is that there doesn’t seem to be a direct line from voter preferences to Congressional floor votes to real-world outcomes; partisan politics and industry lobbying seem more relevant when explaining outcomes. Casellas and Leal (2013) find party to be the best explainer, and Massey’s article (and lecture) suggest[s] the prison-industrial complex may have had more influence on border policy than a careful analysis of the expected outcomes.

This FiveThirtyEight article from today (Wednesday) discusses the Trump Administration’s legal battles with the courts over sanctuary cities. The main point is that it is still politically advantageous for the President to fight losing policy battles because such fights are a signal to his base. The article details other occasions where this calculus has played out.

Thinking about political battles this way puts the whole border wall battle in a new perspective for me, and makes me wonder: is it all about signaling? (This applies for both parties.) More generally, under a paradigm where partisanship dominates floor votes (suggesting issues all cluster together), where is the line from constituents’ preferences to Congressional votes? How can we disentangle the various mechanisms in such a polarized environment?

The McGraw Center for Teaching and Learning
328 Frist Campus Center, Princeton University, Princeton, NJ 08544
PH: 609-258-2575 | FX: 609-258-1433
mcgrawect@princeton.edu

A unit of the Office of the Dean of the College

© Copyright 2025 The Trustees of Princeton University

Accessiblity | Privacy notice