Data Journal:
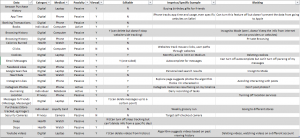
Above is a spreadsheet, which is how I chose to record my data journal: as a list of some of the ways I generated data this past week.
Data simply describes the data; some are specific, like Amazon purchase history, whereas some are more general, such as Browsing History. I attempted to categorize the data into ‘types’, as seen in the Category column. For example, location data was classified as Privacy, whereas my steps seem to be health data. Medium is the technology or method by which my data is collected, the container, or the transmitter, so to speak. Passivity tracks whether the data is generated automatically, or if I choose to track or type up my own data (Active). Notably, only the two sources of data that I choose to track myself are guaranteed to be private to only me; other sources are able to be leveraged as part of larger datasets, such as my google searches or email statistics.
I addressed the question of access in two different ways: the columns of Viewable and Editable. Viewable means that I can view the data, whereas Editable means that I can choose to delete (most important!) or change the data in some way.
Impetus/Specific Example is a column for me to note what incidents prompted me to write them down in this data journal, and Blocking is a column for me to note down how I can create gaps or otherwise disrupt the recording of my data, if I choose to do so.
Notably missing from this log are interactions with non-digital things, or in-person conversations. If I wanted to create maps or visualizations of this data, I think I would have to more clearly define categories (problematic in and of itself, since categories never encompass a full range of information), and have some way of locating physical locations or relationships to conduct geographic or concept mapping.
Also problematic was the Editable column; for example, I marked Google searches as editable because I can delete them, but are they truly deleted, or do they continue to exist on Google’s servers somewhere?
I found that two loci of digital data were my laptop and my phone. This data journal presents an incomplete version of my interests filtered through these two mediators; me as a pixelated person fails to include aspects of my life that do not interact with the digital, like what I eat for dinner or the way my room is set up.
Google’s Pixelated Me:
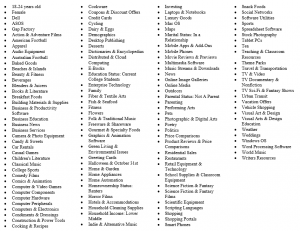
In addition, I also wanted to explore a different way that I’ve been represented as a pixelated person, by Google. As I search things and visit websites through their search engine, my data was being collected and analyzed, to better target ads. Google provides this data in the Ad Personalization section of my user bio, and they offer the option to turn it off.
Below is a list of what Google thinks I’m interested in or who Google thinks I am, based on my past search history and interests. Notably, some demographics and interests are wrong (e.g. I’m not in a relationship, and I’m not interested in all American Football, just college), but just as unerringly, some demographics are correct (age, status as current college student, for example). In contrast to some of the other data that I noted in my Data Journal, Google’s pixelated ad-version of me is ahistorical – there’s no sense of time. Google thinks I’m interested in Hotels and Accommodation, although that’s probably an interest specific to when I was searching for places to live last summer. Additionally, there’s no sense of place: this pixelated version of me is also interested in Australian football, although that’s likely just a remnant of my time studying abroad. While this pixelated person is a fairly comprehensive list of my interests, it only represents those that have been filtered first through Google (and thus, the digital).
Edit: For some reason, the photo of my personalized ad interests isn’t showing up, so here’s a link to the list as a Word document: https://drive.google.com/file/d/1Jq9q-fKko4uH6n0_M8yBoH3Wxwbn2OLk/view?usp=sharing
Hi Rei,
I really like that way that you put together your data journal, and I think it shows both your thoroughness and thoughtfulness. In particular I was interested in your self-selection of categories. The “editable” and “blocking” categories were really interesting–thinking about ways in which you can edit, delete, or disrupt both the generation of your data and its recorded form suggests that you can manipulate your own data such that you can create an alternate version of yourself to present to sites that gather your data. On some level, we already do this unconsciously in our everyday lives, when we make choices like whether or not to post a picture to Instagram or Facebook. Our digital presences are already highly curated. But I am intrigued by the possibility of misrepresenting yourself through the manipulation of your own data after it has been generated.
I also thought that your analysis of Google’s Ad Personalization was interesting, although I was unable to view your attached Word document. I think the fact that Google’s algorithms did not take into account a sense of time and place and assumed that your interests were all-encompassing lends well to our discussions about the pixelated person in class. Even if we manage to gather all the aspects and traces of a person that might exist in digital spaces (which I think is an impossible task–although you’ve done a fantastic job of looking for it, your “editable” category is just one example of why some of this digital data might be inaccessible), would the person we come up with really be who we think they are? The goal of advertising data is to sell you things, and Google does an adequate enough job of understanding what you want or like in order to successfully complete this task. But I don’t believe that this or even the fantastic data table you’ve put together is necessarily enough to understand the whole of someone’s identity and personality. This brings up questions about how we might begin to define, quantify, or categorize something abstract like “identity”.
The post has a broad definition of data and a broad range of gathered data—really makes a point that, in some ways, the digital can be thought of as a relatively smooth continuation of data-gathering processes that have long been a part of life (keeping track of the books we read, the contents of our days, the quality of our health, our finances).
However, your post also clearly delineates what is so different about digital means of data collection. In your spreadsheet, it looks like the data sources that are categorized as “digital” are more likely to be passively collected, non-editable, and non-blockable.
It’s interesting that you pointed out that Google’s pixelated portrait of you is ahistorical—this makes me wonder about the idea of prediction that was brought up in yesterday’s class. Given that individual people change, how much pixelated data is necessary to predict the ways in which individual people change? I wonder if Google has any sort of predictive algorithm that it applies to individual users based on their changing preferences (which they may or may not track—it seems like they just aggregate preferences over time, judging by your personalized ad interests).