(All data was from the past week October 25th – November 1st)
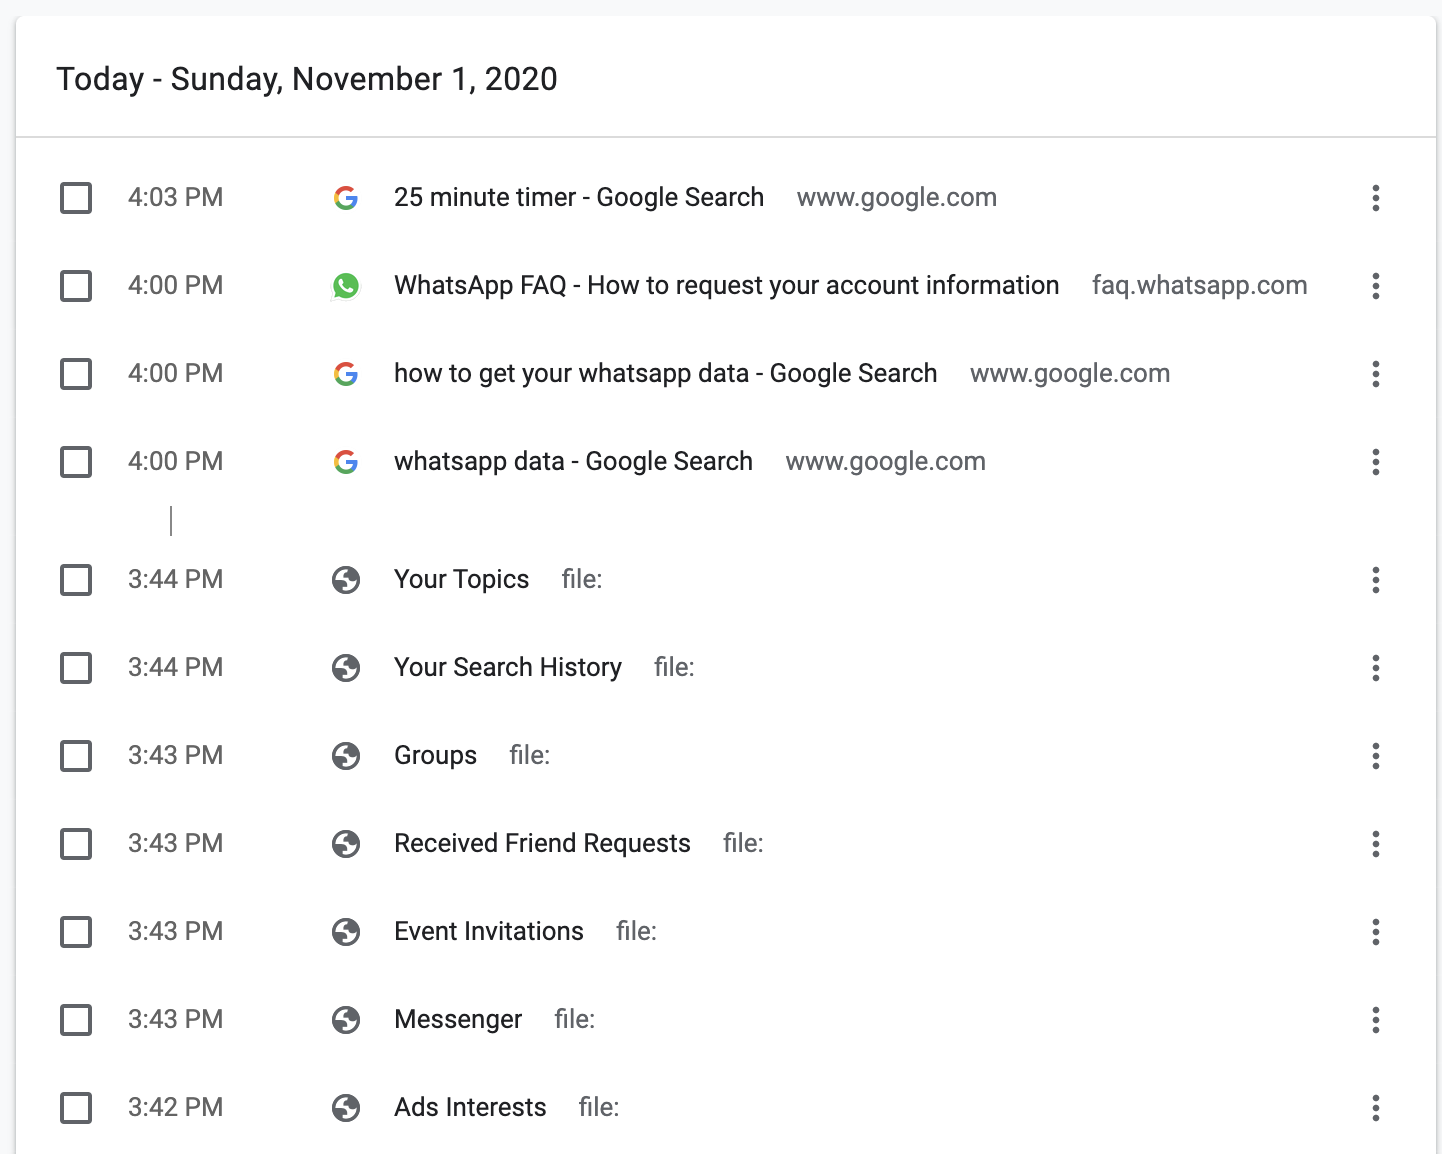
The data “exhaust” that not only generated the most data but was also the source that I most readily had access to was my browsing history. Though my browsing data belonged to Google, I was able to access and see it. However, the form (see google browsing history below) it was in was predetermined by Google, was not available to download in another form, and perhaps most importantly, did not tell me anything about the greater trends and patterns of my browsing history. In other words, the raw, singular pieces of data were there for me to access and see but what was not evident was what these individual pieces of data meant when they were aggregated together.
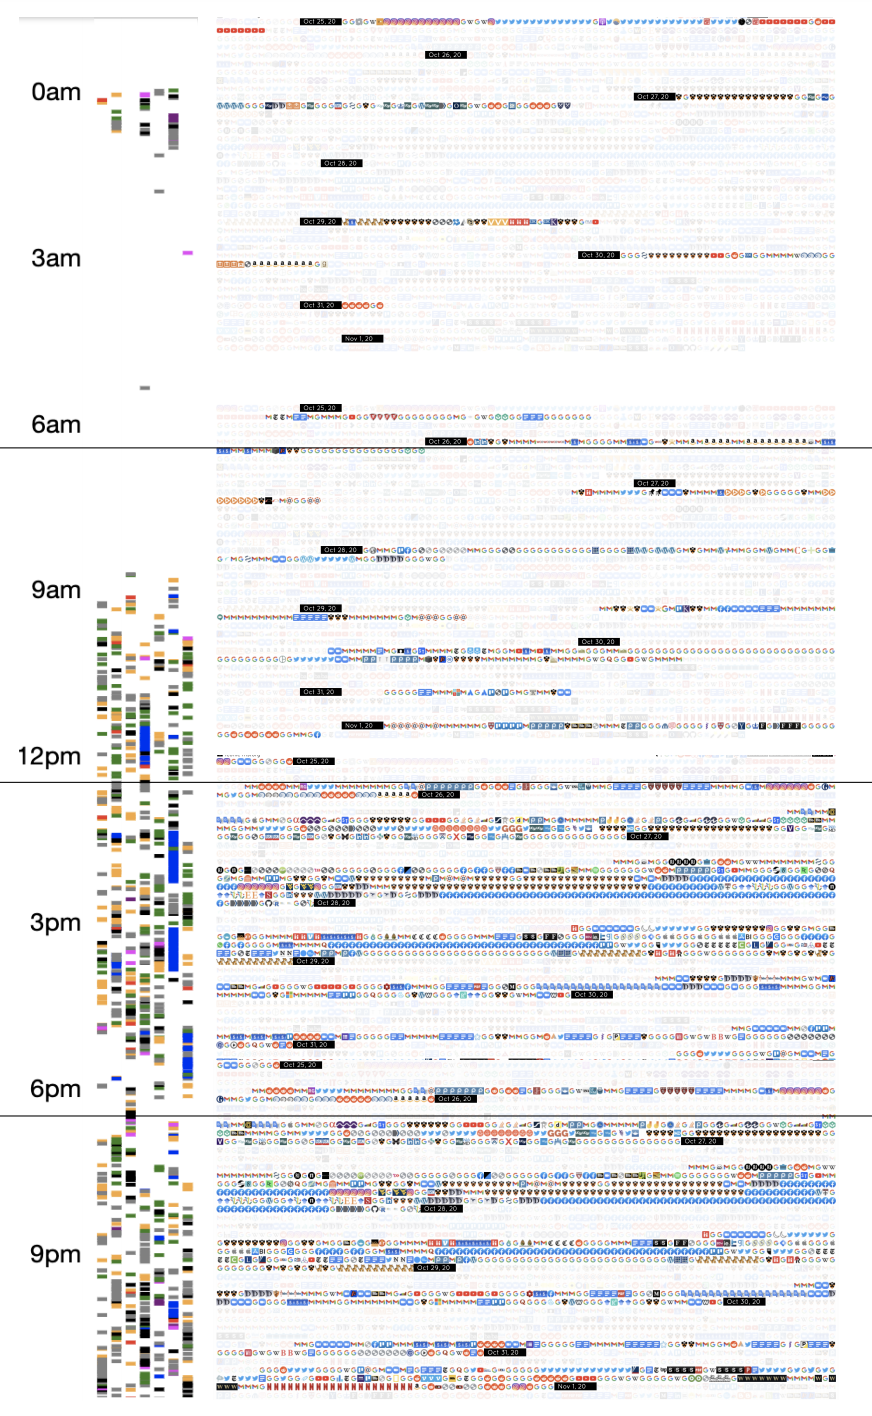
It was only after using several tools to create data visualizations that my browser history began to take on more meaning as larger trends and patterns emerged. The first data visualization (browsing history #1) gives an overview of how many sites I visited within a one-hour chunk as well as which sites I visited the most. The second data visualization (browsing history #2) was another way to visualize time and browsing activity. The images on the right corresponded to four six-hour periods of time (12AM – 6AM; 6AM-12PM; 12PM-6PM; 6PM-12AM) and the order of links that I clicked within those six-hour windows. These visualizations were able to show me not only when I tended to browse the Internet, but also where and how often. Scarily enough, I think I spend way too much time on a few, select websites (Blackboard, Facebook, any Google product, Reddit) where I am passively consuming information rather than actively and consciously engaging and creating information to share.
-
- google browsing history
-

- browsing history #1
-
- browsing history #2
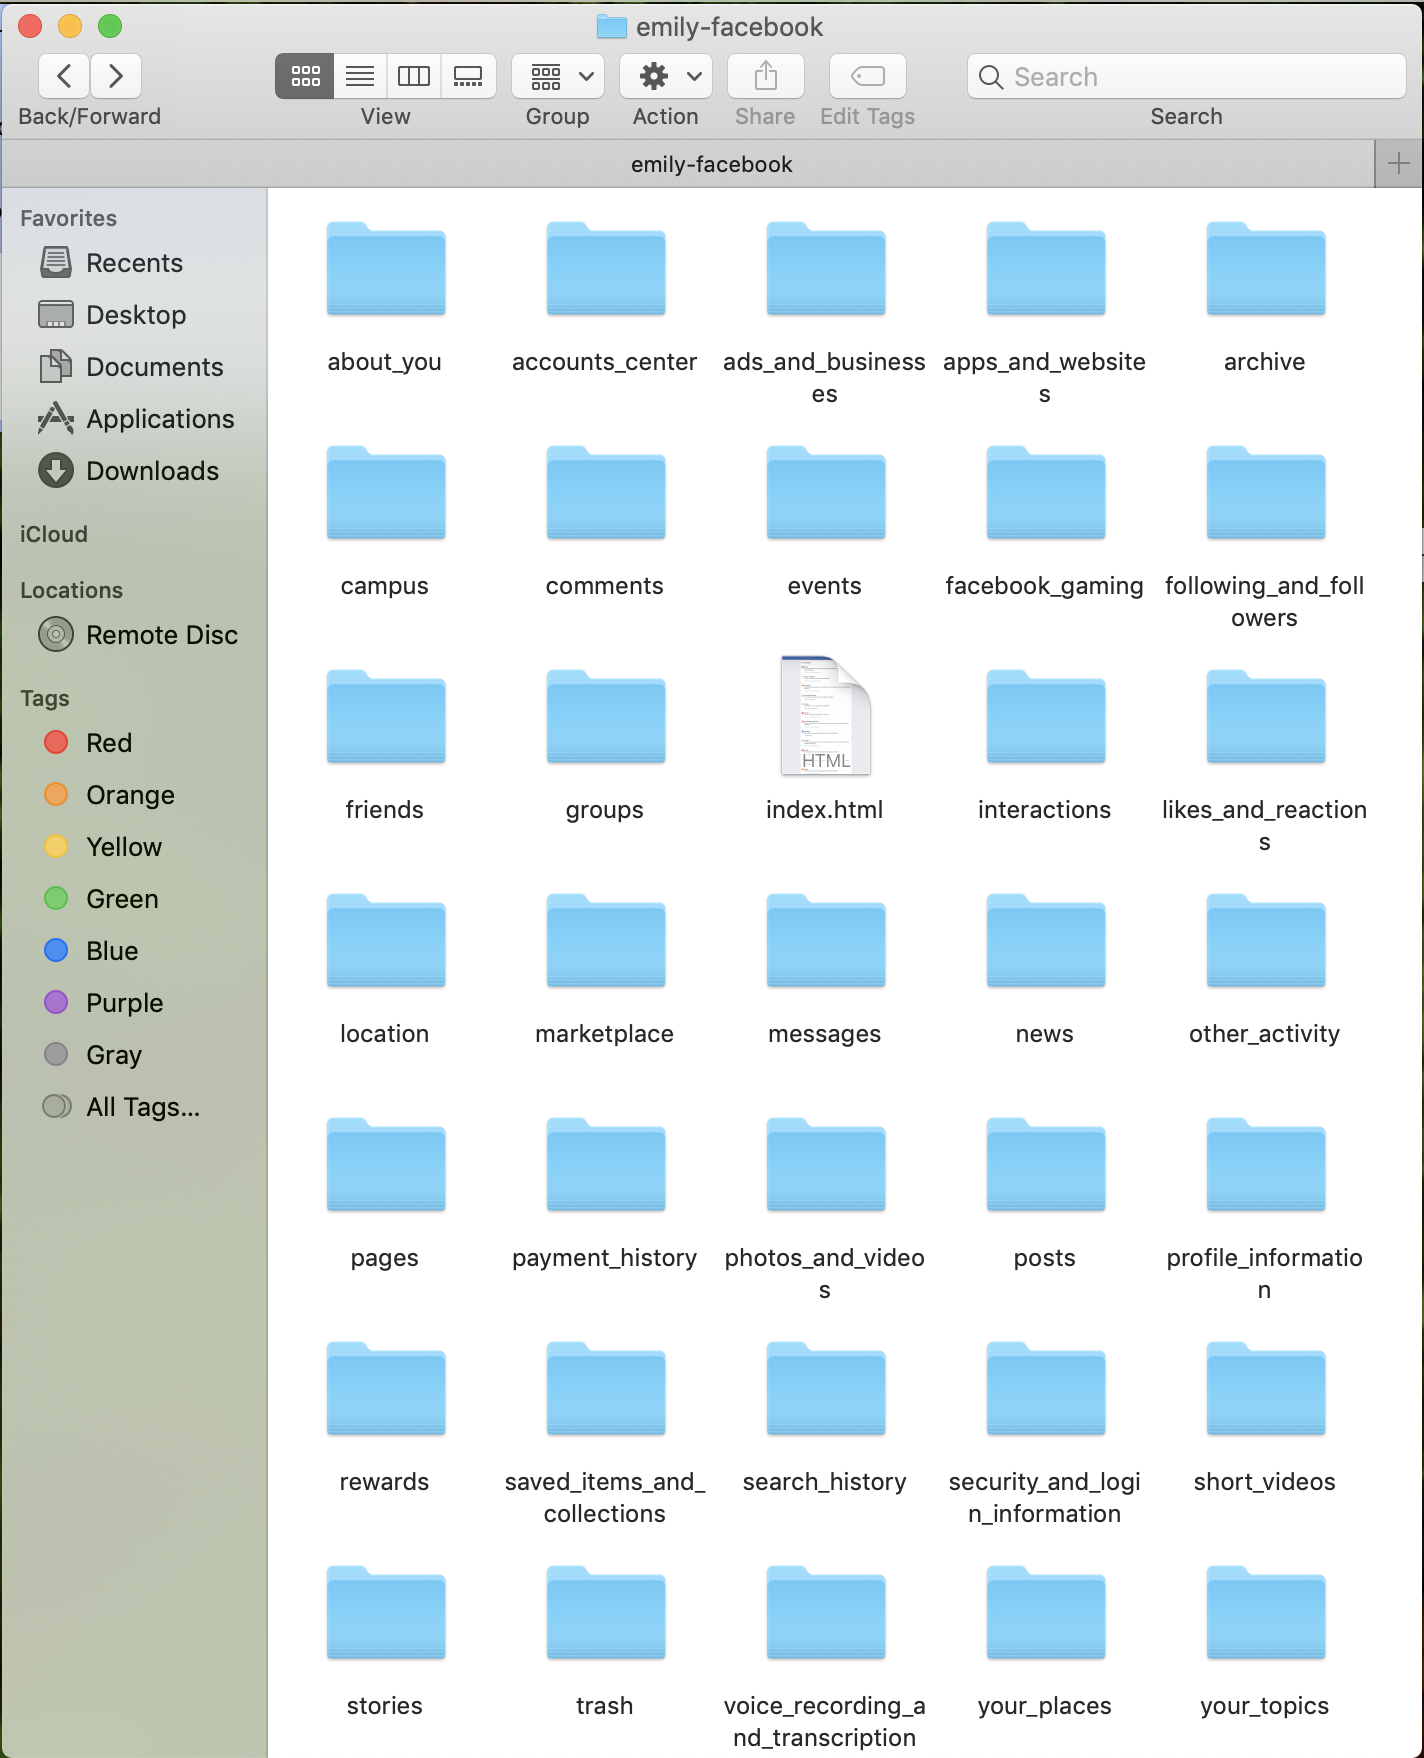
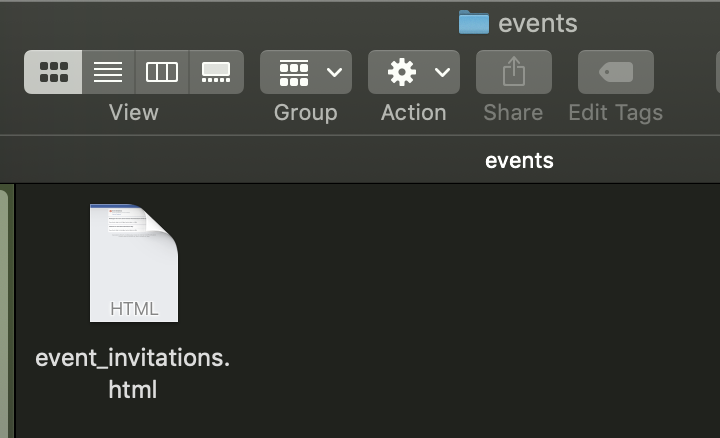
I also wanted to dive a little deeper to see what my “pixelated self” looks like on Facebook. They allowed me to download “me,” aka my past engagements from the past week in data. Something that stood out immediately was little data was available to me ( see facebook data and filtered facebook data ). The data was already separated for me in discrete folders and categories. That data was embedded within individual html files that opened up to a webpage where, similar to my Google browsing history, I could see raw, singular pieces of data, but wasn’t allowed to access a form of that data that would let me visualize larger and patterns and trends (see html example and html opened).
-
- facebook data
-

- filtered facebook data
-
- html example
-
- html opened
In conclusion, neither small nor big data that Boyd and Crawford refer to are available to me in the form of digital data. The digital data that is available is in singular, concrete units that can’t be easily aggregated and cross-referenced with other forms of digital data (i.e. I can’t use some sort of programming language to reformat the data and form some sort of relationship between my browsing history and my Facebook data). By not allowing the relationship between pieces of data to form, the meaning and ability to contextualize singular, pieces of data as well as multiple datasets across my virtual self is taken away.
I also think back to the Editor-in-Chief of Wired’s comment: “Who knows why people do what they do? The point is they do it, and we can track and measure it with unprecedented fidelity (666).” After collecting this data, it’s clear that the what I am doing on the Internet is clearly available, but what is clearly lacking and immeasurable is the why. What does the data available say about me as a person beyond just merely describing my actions? Will having more data lead to me to cross some line that will tell me something more about myself as a person or are those qualitative aspects of me as a person just inherently immeasurable? Or perhaps is it that the data that is necessary for me to understand the why just unavailable to me as a user because that’s where the value of the data is and is thus purposely kept unavailable?
Hi Emily! Super interesting post, and very cool visualizations. How did you make the browsing history one?
Your conclusion that “neither small nor big data that Boyd and Crawford refer to are available to me in the form of digital data. The digital data that is available is in singular, concrete units that can’t be easily aggregated and cross-referenced with other forms of digital data” reminds me of the three classes of people identified by Manovich (and found in boyd and Crawford): “those who create data (both consciously and by leaving digital footprints), those who have the means to collect it, and those who have expertise to analyze it” (675).
It seems like your experience, and all of our experiences, seem to challenge these categories slightly, depending on the medium of data and the types of analysis. For example, we might have the means to collect data from Google, but Facebook, or vice versa. However, this data is completely personal; it almost seems that if you have the means to collect this data from multiple people, you would be able to then analyze it. There’s a wider gap in power between ‘those that create data’ and ‘those that can collect’ than between ‘those that can collect’ and ‘those that can analyze’.
I can’t insert this into a comment, but I made a really rudimentary graphic trying to represent this relationship, where the arrows represent a skill/access gap: https://commons.princeton.edu/ant347-f20/wp-content/uploads/sites/221/2020/11/data-groups-of-people.png