For my data, I decided to look at the data that was generated through my use of the app Instagram, but more specifically, looking at the insights section of the app, which provides data on my follower demographics, their actions, and my content reach. Here is the first data page that I looked at:
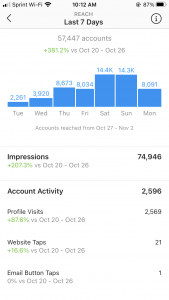
This page shows me my content reach (the amount of people who have seen my content whether or not they’ve clicked on it or not) within the past week (Oct 27 to Nov 2). The number at the top says 57,447, meaning that my account has reached about that many accounts this past week, which appears to be a 381.2% increase from the week before. Now, these numbers are very very large and, though they give me a rough a idea of the scope of my audience or at least how many people have seen my content, it is not the kind of data that tells me exactly who the users are that can see my posts — I simply do not have access to that unless someone actually interacts with my post by liking/commenting on it. Is this large categorization of data by instagram an example of what we’ve talked about as Big Data? The rest of my screenshots of the insights section do a similar thing of grouping binary data into categories, which make it appear more accessible. This insights page seems to act as a compression of my raw data, which makes it more accessible to user — who would want to scroll through the hundreds of thousands of accounts that come into contact with your content in some form or another? In this situation, it appears that compression of data may equal accessibility. Unlike the essay on mp3 encoding which compresses data into something that appears to sound exactly the same from the human ear, this type of compression in instagram insights is much more visible and generalizing. Also, though it’s being “compressed”, which is synonymous with making something smaller/more compact, it is rather ironic that, in fact, this is possible turning into Big Data, as you will go on to see that that further generalized categorization of this data. Also, keep in mind that these terms above, such as impressions, content reach, etc, are rather vague, and so to a regular user like me, was not exactly clear–I had to search up online separately to understand what each category actually meant- it was not the most intuitive and intelligible in familiar language. I think that this page could have benefitted by providing the definitions for the categories, since most people do not have the patient to look up their exact meanings separately.
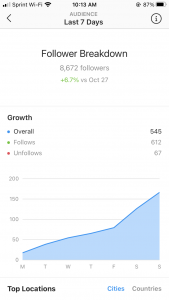
Next on the insights page, we have data on my audience, and specifically on my follower growth over the past week. This is yet again, another example of a categorization and generalization of my data. I cannot see who exactly has followed or unfollowed me, but I get an overall sense of my growth. This is an example of data that has already been measured for me– I wouldn’t say that there is much else that I can do to analyze or generate new data for myself.
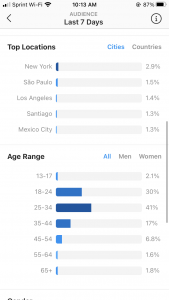
This next screenshot shows what cities/countries are particularly seeing my content from the past week, and what age ranges (both men and women) are seeing my content. To me, it is very fascinating that my content would be seen in Sao Paulo, Santiago, and Mexico City. I would love for this insights page to show me the data trail that leads to my content being shown in these cities. This made a little more since when I went to look at my top countries, and Brazil and Mexico were just below the US.
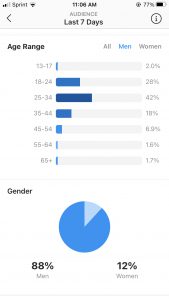
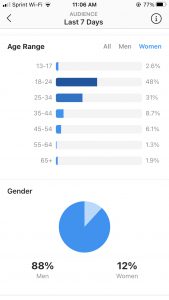
This next page shows the overall gender breakup by age. It made sense to me that 88% of my audience is men and 12% women, since I post a lot of drum videos, and the drumming industry has been historically dominated by men. However, it is particularly fascinating the way in which the age range of men and women particularly highlights this issue. The more I have grown my account, the more my page has come into contact with professionals in the drumming community who are likely to be particularly in the age category 25-34 and 35-44. As you can see, the age category of 25-34 is dominated by 42% of men, while a similar number, 48%, is dominated by younger women in the 18-24 category. I really do believe that this piece of data points to the great disparity in gender in the drumming community– and it so interesting that this small piece of data from an instagram insights page can point and give evidence to this larger issue.
What’s also interesting about this form of data, is that it is less about creating a “pixelated” form of myself that was discussed in the Schull and Ruckenstein reading, but more about a possible pixelated version of the audience that my content is targeting. Does this data give an authentic picture or identity of the current drum community? Is this kind of data about an audience more accurate in curating an identity of a community than of one’s individual personhood? I think that this is possible, since it’s probably easier to understand that generalizations of a large community than it is to understand the complexities of a single person. I am also wondering if that data page which focuses on my content and the users I reach can still tell me anything about myself. To be perfectly honest, so far my Instagram page itself has been mainly used for the career side of my identity, therefore, I would say that these insights do not say much about anything personal to my identity other than that I am a musicians. Possibly the artistic choices and the song I choose to play to might certainly say something about my taste and music and could affect who my audience is. Having Los Angeles and New York City (2 of the mainstream music capitals of the country and the 2 cities I hope to live in after school) as my top cities certainly indicates the type of scenes I would like to find myself in. However, do a person’s audiences really tell them anything about their own personal identity? I think, certainly not. I believe that external response is completely separate from individual identity, however, it can certainly affect a person’s perception of themself if they let it.
Hi Maya! I thought your post asked several important, thought-provoking questions that I’d love to dive into a little. While I was writing my data journal, I was also struck by this issue of the perceived audience and how they factor into this production of the “pixelated person”. While I think you’re definitely on the right track by questioning whether “a person’s audience tell them anything about their own personal identity”, I’m not completely sure I agree with your total dismal of its analytical value. Although I understand that some of these insights might be considerably superficial, I still have to hang on to the belief that who follows you is a personal reflection to some extent. However, I suppose this hinges on whether or not you choose to make your account public, as that determines the selectiveness of the audience. That said, that decision, in itself, could lend insight into the values and anxieties that define your identity. For example, someone with a public account will likely value socialization over personal privacy. As such, I still contend that audience-oriented analysis can yield some useful insight into the account owner. I definitely agree that information discerned from the audience of public accounts is limited, but I think there might be some nuance there. How does your conclusion apply to “finstas” or private main accounts? I’d be super interested in examining the audiences of more personal accounts to see if they are a more direct reflection of the owner’s identity. Overall, a well-written, super impactful post- I hope everyone reads it!