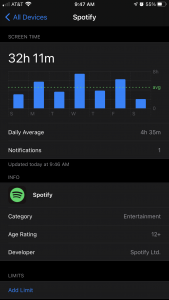
I’m not very good at data/technology stuff in general, so I went to Settings on my iPhone and visited the “Screen Time” page for the first time ever to see what kinds of habits I could track for myself. As many of my friends could tell you, I’m an avid Snapchatter and I’m pretty responsive over iMessage at all times, so I was STUNNED to see that my most used app in a week- by far- is Spotify According to Screen Time, my daily average last week (10/25-11/1) for using Spotify alone was 4 hours and 35 minutes. This added up to a total of 32 hours and 11 minutes of usage over the course of 7 days with my second most-used (Snapchat) being only 10 hours and 44 minutes.
I decided to “track” my Spotify usage over the course of a few days to see what kinds of patterns I would find: when do I listen to music the most? Is it active listening? What are the ways in which I interact with the app that I didn’t really notice before? Where do these 32 hours come from? I created an Excel sheet where I could input time stamps for when I started and stopped a listening session, and I added in some columns where I could describe the listening experience. I recorded playlist name(s) as well as the physical activity/tasks I was doing while listening. Since Spotify is a pretty portable app that can be synced across multiple devices, I also included a column for what listening “medium” I was using during a given session.
Tracking my Spotify data turned out to be a very hands-on- at times tedious- but reflective process. Because turning on music (very apparently) seems to be an unconscious habit for me, I had to constantly remind myself to be aware of what playlists I was selecting when I got in the car, when I started and stopped listening, and what my general mood was during the experience. I relied primarily on an app called Life360 (glorified Find My Friends that me and my family use to keep track of each other) to tell me when I left the house and for how long I drove so that I could figure out the approximate duration of a listening session. I also used my call log and my text messages as reference points (a certain listening session would end when Anna called, I started a listening session after responding to a text from Renie, etc.) I also took note- when I could- of how I was feeling and why I may have chosen a particular playlist. Sometimes I just needed background music on a drive throughout which I was accompanied by my friends, but other times I deliberately turned on music I could sing to or would enjoy at a given moment.
Some general things I noticed from tracking this data is that…well, first: I drive a lot. My primary listening device is Carplay, which means that the majority of time I spend using Spotify is when I’m on the go. The descriptions for these listening sessions consistently state the locations to which I’m traveling, indicating that I don’t just drive to…drive. There is always an objective, or a purpose beyond just listening to music. It reminds me a lot of the MP3 article; the portability of music is more valuable than the music itself, as my activity indicates.
Looking at the correlation between my playlists and the activity descriptions was perhaps the most interesting aspect of the data…to me. I could immediately tell from my choices what I was feeling at the time, or for what purpose I was listening in the first place. For example, Friday, the first day I started tracking data, was a very rainy and cold day. I also have no swim practice on Friday’s, no class, and I was actually fighting with my best friend on this particular day as well. I see that I listened to 4 Coldplay albums all the way through on that day. I know Coldplay pretty well, so this data to me suggests- no, screams– that I needed to keep myself busy by not only going on drives to run random errands, but also to keep my mind busy with singing lyrics. On the other hand, on Sunday, I hosted a little post-Halloween party at my house. I can clearly tell that the music served as social filler, as I quite literally only listened to “Swim Vibezz,” an upbeat and primarily modern pop/EDM playlist, and “On Repeat” which is a Spotify-curated playlist that throws your 100 most listened to songs at the moment together. Most of the songs on “On Repeat” are from “Swim Vibezz,” so I think of the two playlists as interchangeable. My listening time on Sunday was during car rides to pick up/drop off my friends, so clearly I was paying more attention to interacting with them than to the music itself.
I know by all means that my data isn’t the most quantitative or even intelligible in any way to probably anyone other than myself, but my main takeaway from this exercise was that- as Renie said in her post- there is a lot of data consistently being recorded even when we don’t realize it. My “On Repeat” playlist is a perfect example of this unconscious interaction/user participation: although it seems crazy, I interact with Spotify for 32 hours a week literally just by turning on my car and choosing music that I don’t even end up REALLY listening to. From this data, Spotify figures out what songs I tend to skip, what songs I listen to all the way through, what songs I select as the “starting point” for my seemingly mindless listening sessions and feeds this data back to me in a neatly packaged “On Repeat” playlist. It’s all very clever, really. I think a major hole in my methodology is created by my subjectivity. I don’t think anyone else would be able to interpret and to draw the same conclusions about my active listening habits, let alone decipher the playlist names, because they simply just…weren’t there. And here is where I start questioning the “objectivity” and the portrayal of lived realities in ethnography again…
Here is the link to my spreadsheet and also a few screenshots showing my insane Spotify usage! (Note: my Carplay data is also included in my iPhone data because it’s Bluetooth that is connected to my phone.) Truly learned a lot from this activity, like how my iPhone storage is probably always full because all of the cached data on Spotify…
https://docs.google.com/spreadsheets/d/1-Yt22O_hUlhuFP0X1nHPJxU4GjO-kpYThb07_brkZYQ/edit?usp=sharing
Ailee, I think that is so interesting that we don’t really realize how much time we spend on a specific app or how much data we are producing at every minute of the day. Like you, I spend so much time on Spotify. I even leave the app open on my computer and I never have to even look at it… I can literally just press play on the keyboard and the right playlist starts playing. I even do it while doing the weekly readings (apparently my bilingual brain can block out song lyrics and focus on the words my eyes are reading).
Before today, I actually never thought about how automatic this data gathering process was. Today, Professor Himpele mentioned how the software he was using was automatically refreshing the data and the visualization connected to it. This got me thinking about how much we unknowingly produced data while listening to music. For example, I always play the same playlist (country rock) when I open Spotify and the app knows and will often recommend similar music. Like you I am rarely actively listening to music yet it is always playing.
Another interesting aspect that I noticed is that our brain is constantly creating visualization that our eyes are seeing and we aren’t really conscious that it is happening. We can translate visual data and extract a meaning from its context (which relates to Geertz’s thick description reading). I have to say that because of this class, I am more aware of the data we constantly produce and process and it is starting to feel a little overwhelming…