Simple Maps
If you simply want to embed a map in your posts, go to Google Maps, navigate to the area you are interested in, click the three-line ‘hamburger’ menu icon in the upper-left corner of the screen, and select ‘Share or Embed Map’. Choose the ‘Embed a Map’ tab, copy the HTML, and paste it into your post. (Make sure the text tab is selected when you paste in the code.).
Annotated Maps
Google MyMaps
Create custom maps to share and publish online. You can add multiple layers of locations, annotation, photos, videos, and images. Data can also be imported, mapped and color-coded.
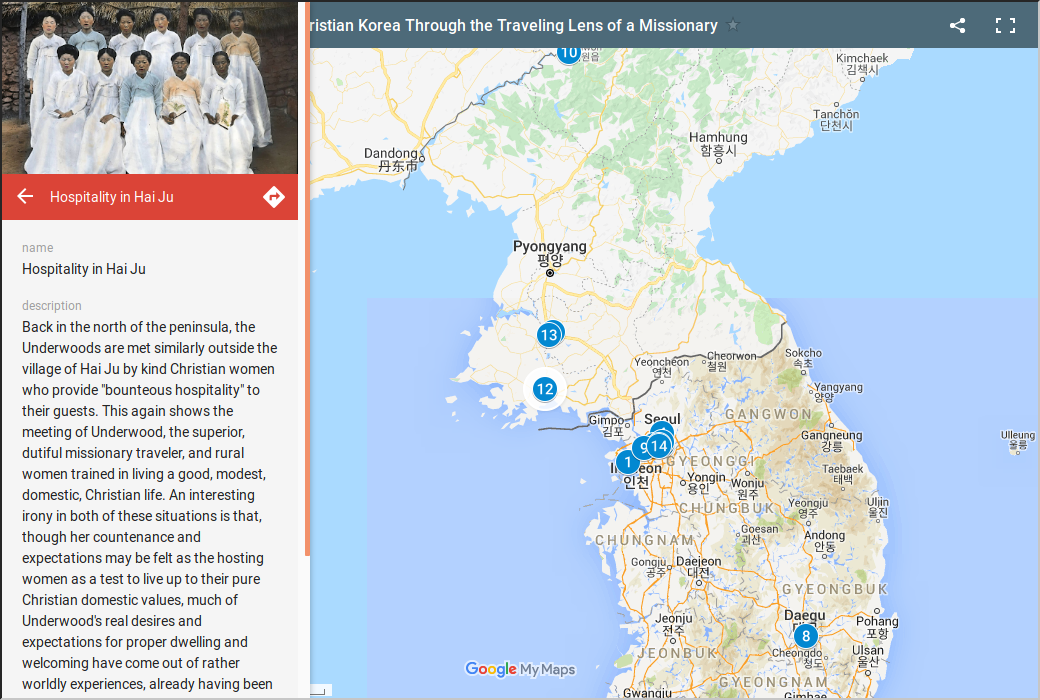
StoryMapsJS
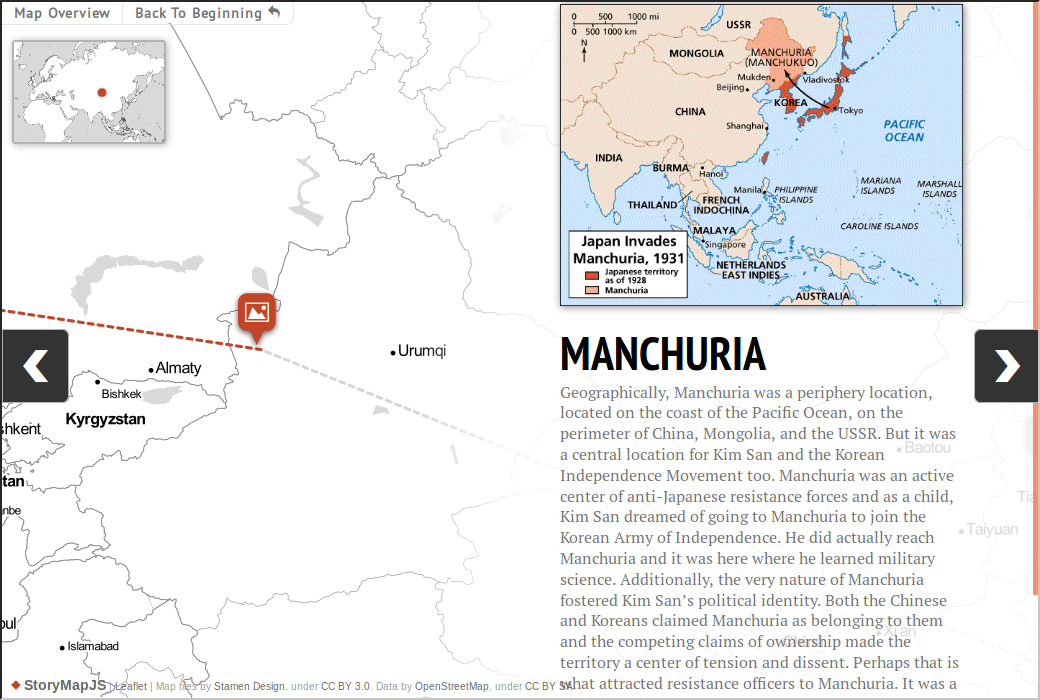
Create slides including text, images and accompanying map locations, then generate an attractive display of the sequential narrative.
http://commons.princeton.edu/korean-travel-narratives/2018/05/22/a-walk-in-kim-sans-shoes/
http://commons.princeton.edu/korean-travel-narratives/2018/05/22/following-underwood/
ArcGIS Online, StoryMap Tool
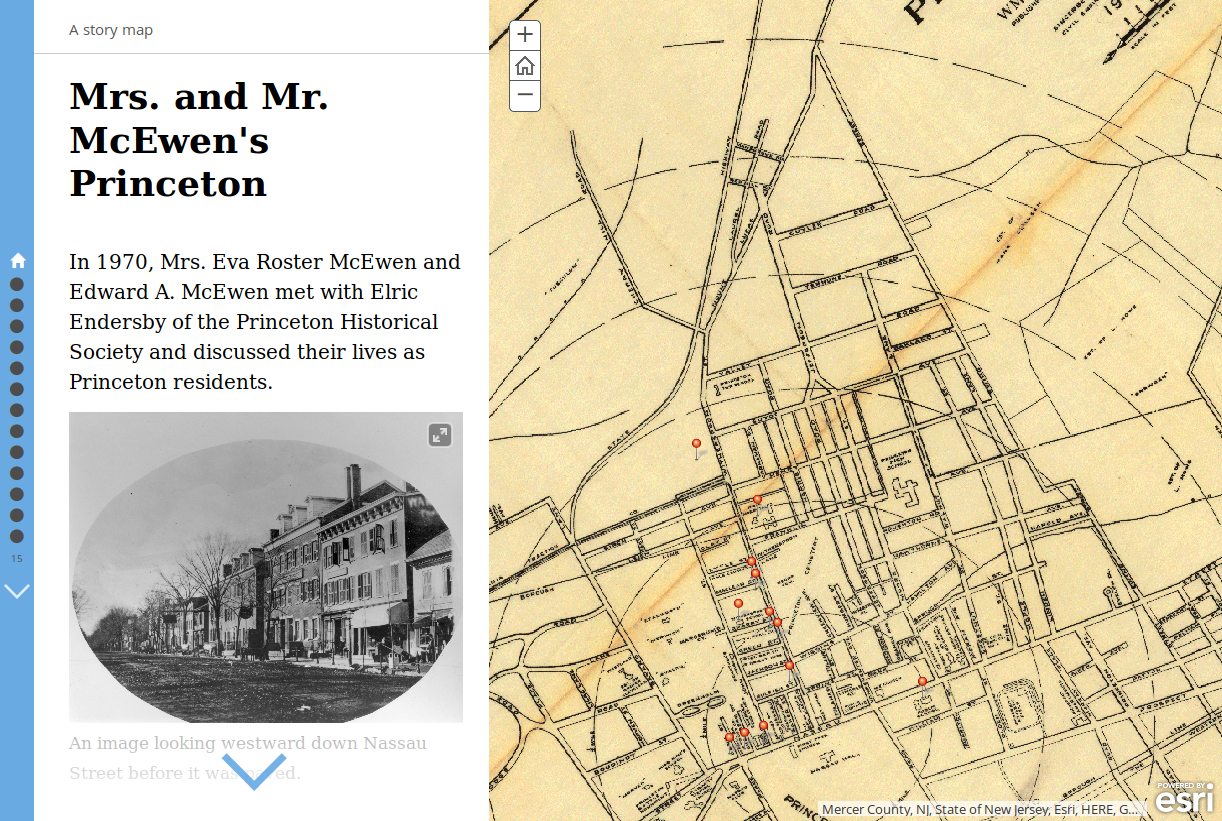
A tool included in the online version of ArcGIS (of which the desktop version is considered the most comprehensive GIS platform). Story Maps combine text and images with maps that pan and zoom to locations to tell stories.
https://pumagic.maps.arcgis.com/home/signin.html
https://gisportal.princeton.edu/portal/home/
A tutorial for using Princeton’s ArcGIS Portal can be found here.
MapHub
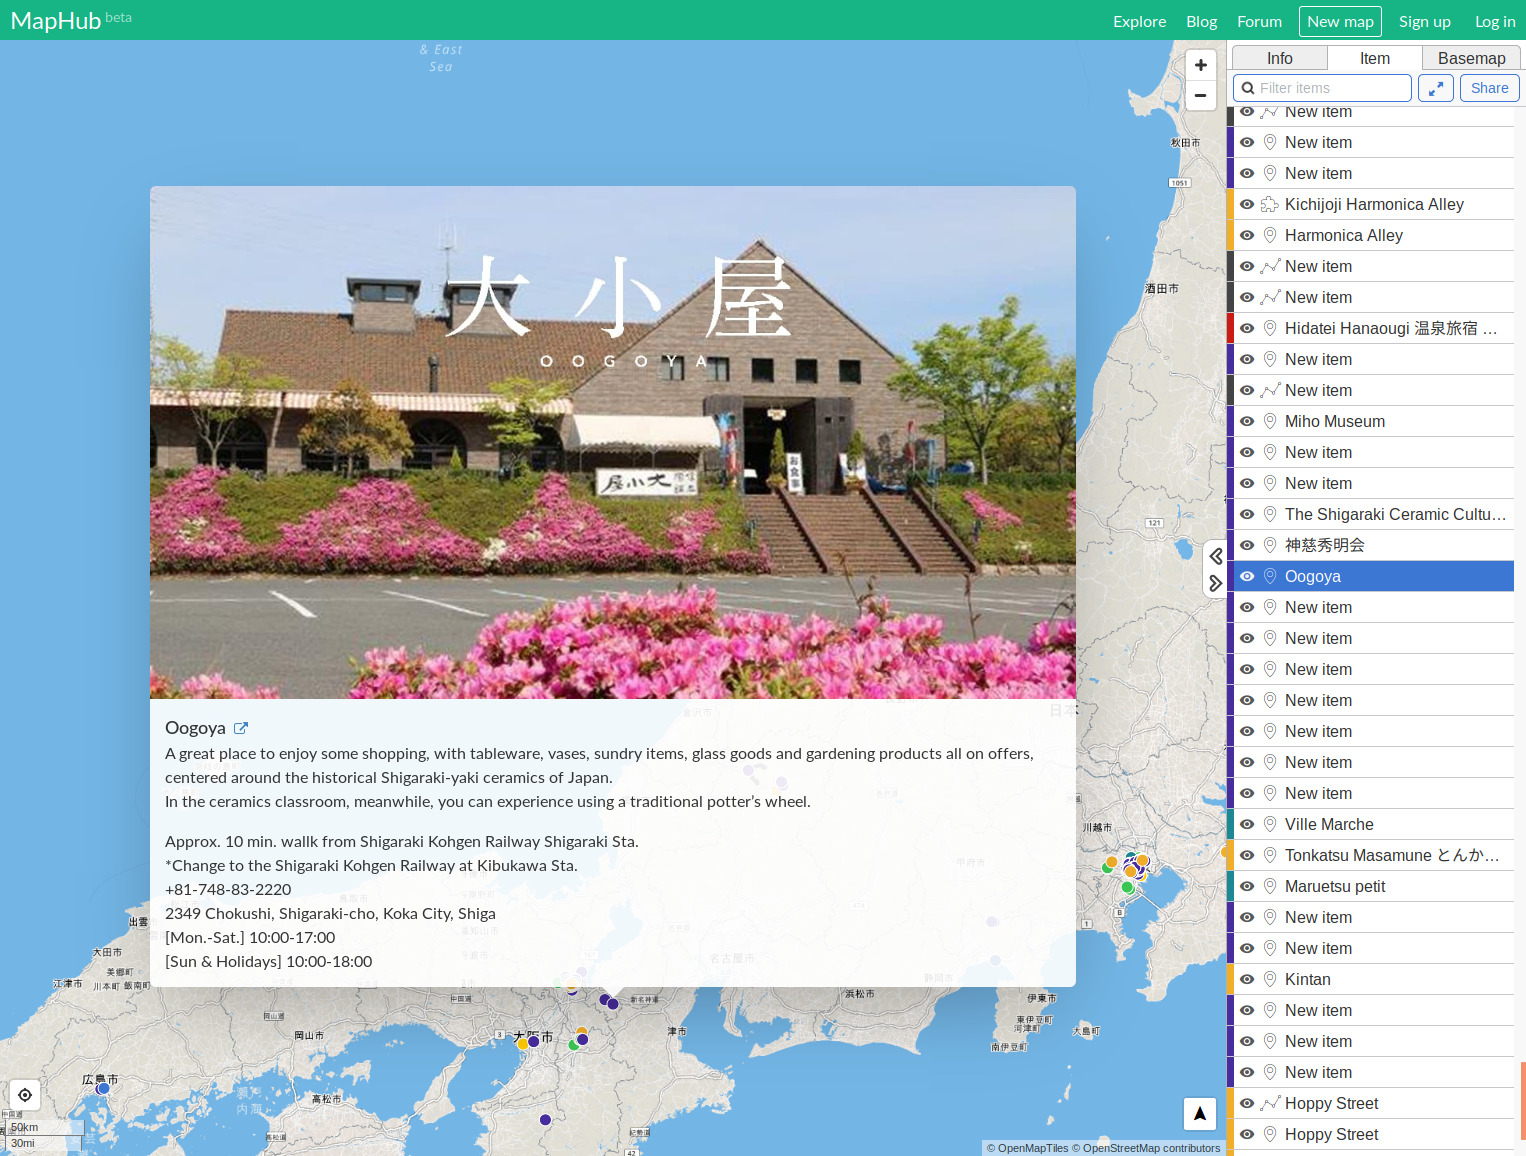
A tool for creating custom maps with markers, lines, and polygons, much like Google MyMaps but using the open source OpenStreetMaps. A wide variety of basemaps are available, data can be imported, and the platform is very easy to use.
Brief tutorial: https://www.journalism.co.uk/news/how-to-create-interactive-maps-with-maphub/s2/a634898/
CartoDB Odyssey.js
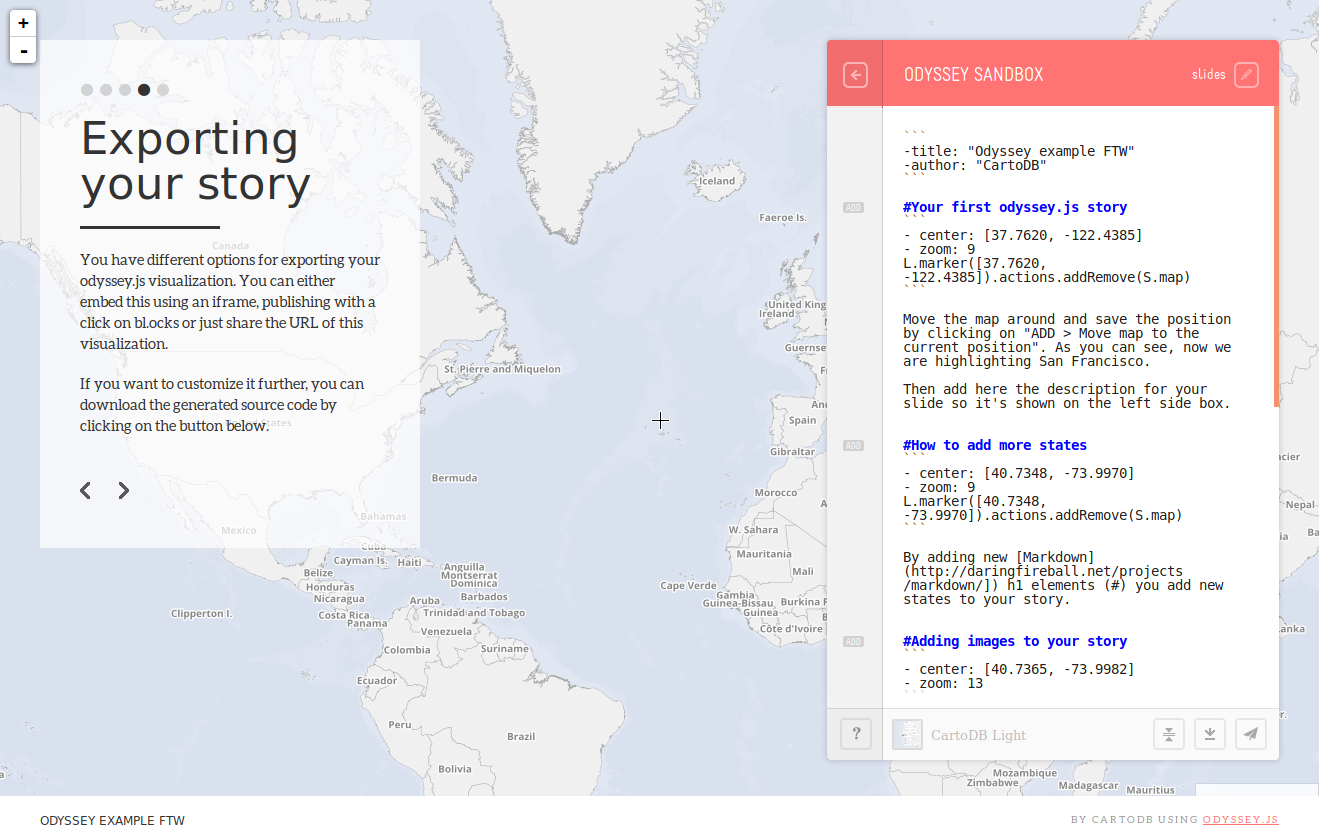
A little bit difficult to use because the project is in development (change https in the URL to http to get it to work). Create slides using Markdown and associate with locations on a map. When complete you can download a single, HTML file of the project or embed on other sites in an iframe.
https://cartodb.github.io/odyssey.js/
Combining Maps and Timelines
TimelineJS
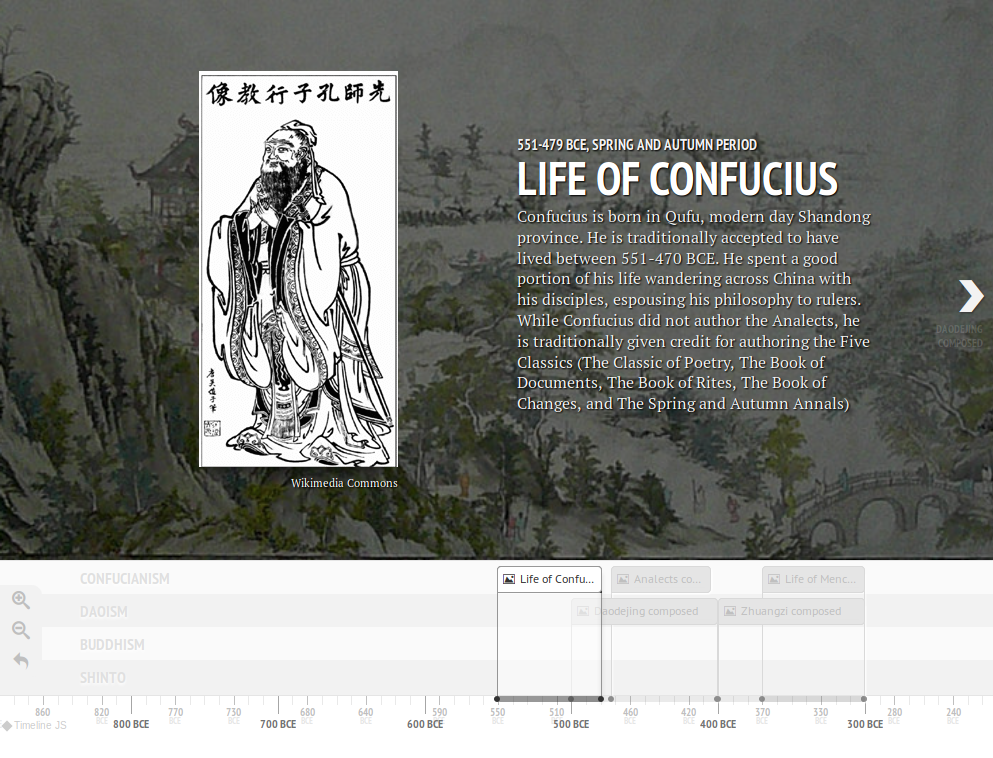
Catalog your data in a Google Sheets spreadsheet and import it as your data source. Date or time-associated data can include photos, videos, audio, maps and links. TimelineJS generates an attractive sliding timeline.
TimeMapper

http://timemapper.okfnlabs.org
Combine text and images with a map and a timeline, all in one display.
http://timemapper.okfnlabs.org/aaptis331/mapdatatimemap#8
https://www.dwrl.utexas.edu/wp-content/uploads/2015/10/timemapper-all-handouts.pdf
Google Tours
Google Tour Creator
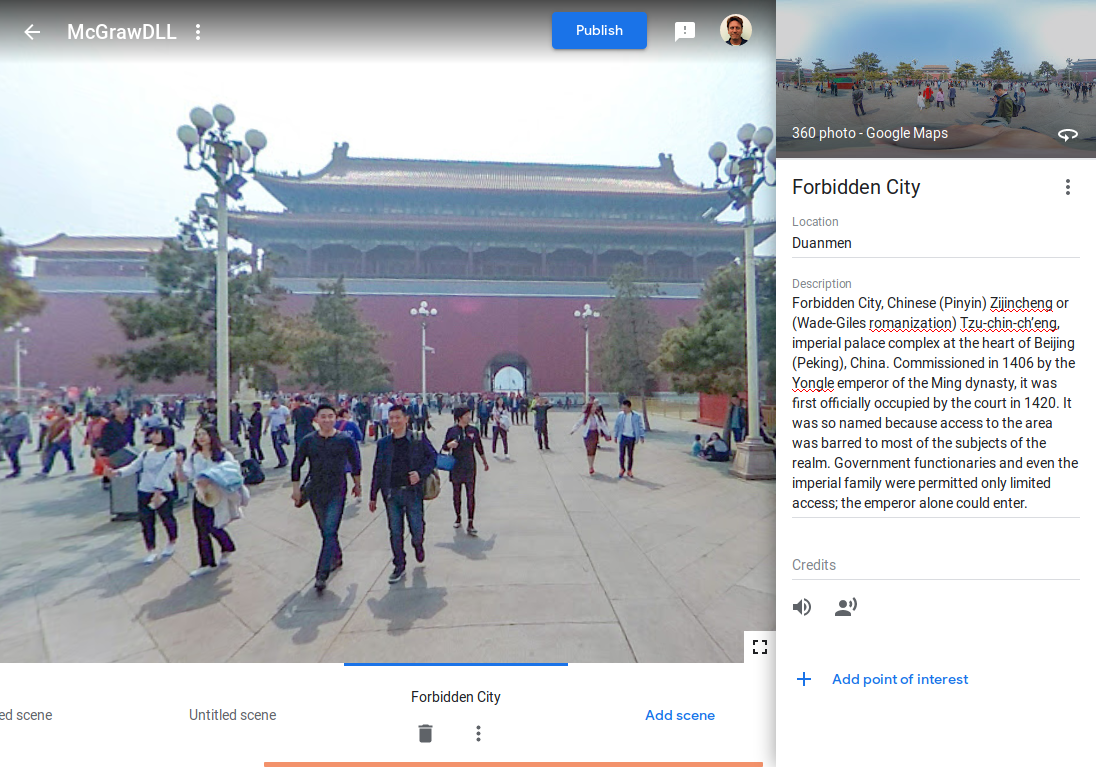
Create interactive virtual-reality tours using Google Street View. “Scenes” are culled from the street view and 3D photos found in Google Maps. Highlight points of interest and add 2D images for additional information. Support brief scene descriptions and voice narration.
https://vr.google.com/tourcreator/
Google Tour Builder

An older but fully functioning, 2D relative of Google Tour Creator. Add ‘slides’ with text and images and associated with points along a pathway on a map.
https://tourbuilder.withgoogle.com/
Websites
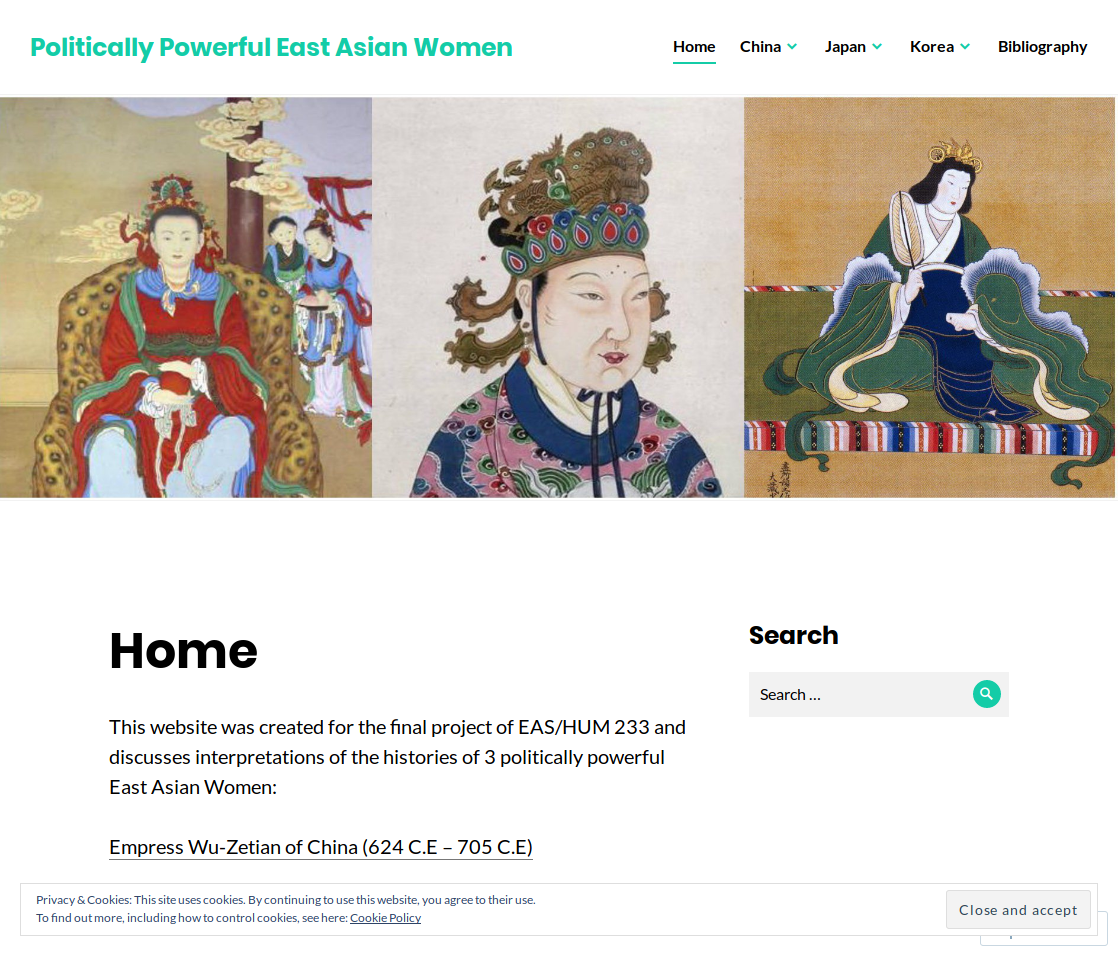
Many free website building tools exist, including:
Wix https://eunicelee621.wixsite.com/eas369-eunicelee
WordPress.com https://powerfuleastasianwomen.wordpress.com/
SimpleSite https://www.simplesite.com
Exposure.so http://www.exposure.so/
Audio & Video
Many tools will allow you to combine images, music, audio narration, and video, incorporating transitions, pans, zooms (ala Ken Burns) to produce a video. All the available presentations tools, such as Powerpoint, Keynote, and Google Slides, allow you to incorporate animations in your slides. Powerpoint and Keynote allow you to record voice-over narrations (If you are able, use Keynote for this. The recorder is much simpler to use.). Presentations can then be exported as a video using Powerpoint or Keynote. You can also record a narration outside of Powerpoint or Keynote in the excellent, and free, Audacity audio recorder and then combine with the video using video editing software such as iMovie, Windows Movie Maker, or Adobe Premiere. Alternately, perform and record your presentation ‘live’ using a screen capture program such as Screenflow. Adobe Premiere and Screenflow are not free, but are available in the University’s Digital Learning Lab in the Lewis Science Library Building or in J. Street Library in Wilson College.
Charts and Graphs
RAWGraphs
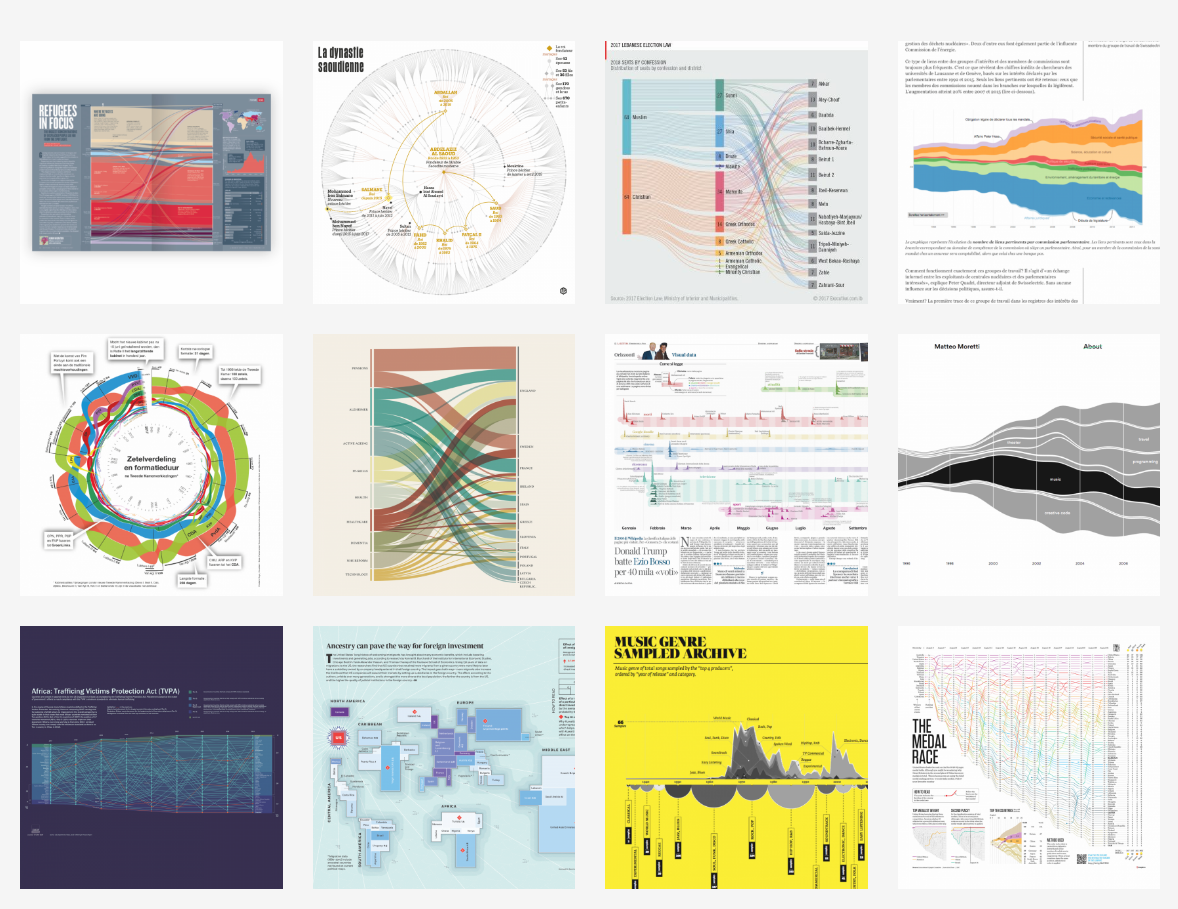
An easy to use, completely online tool for generating a wide range of beautiful charts and graphs from your data. Simple paste the data in comma-separated (CSV) format and select from over twenty types of graph and chart formats.
Palladio
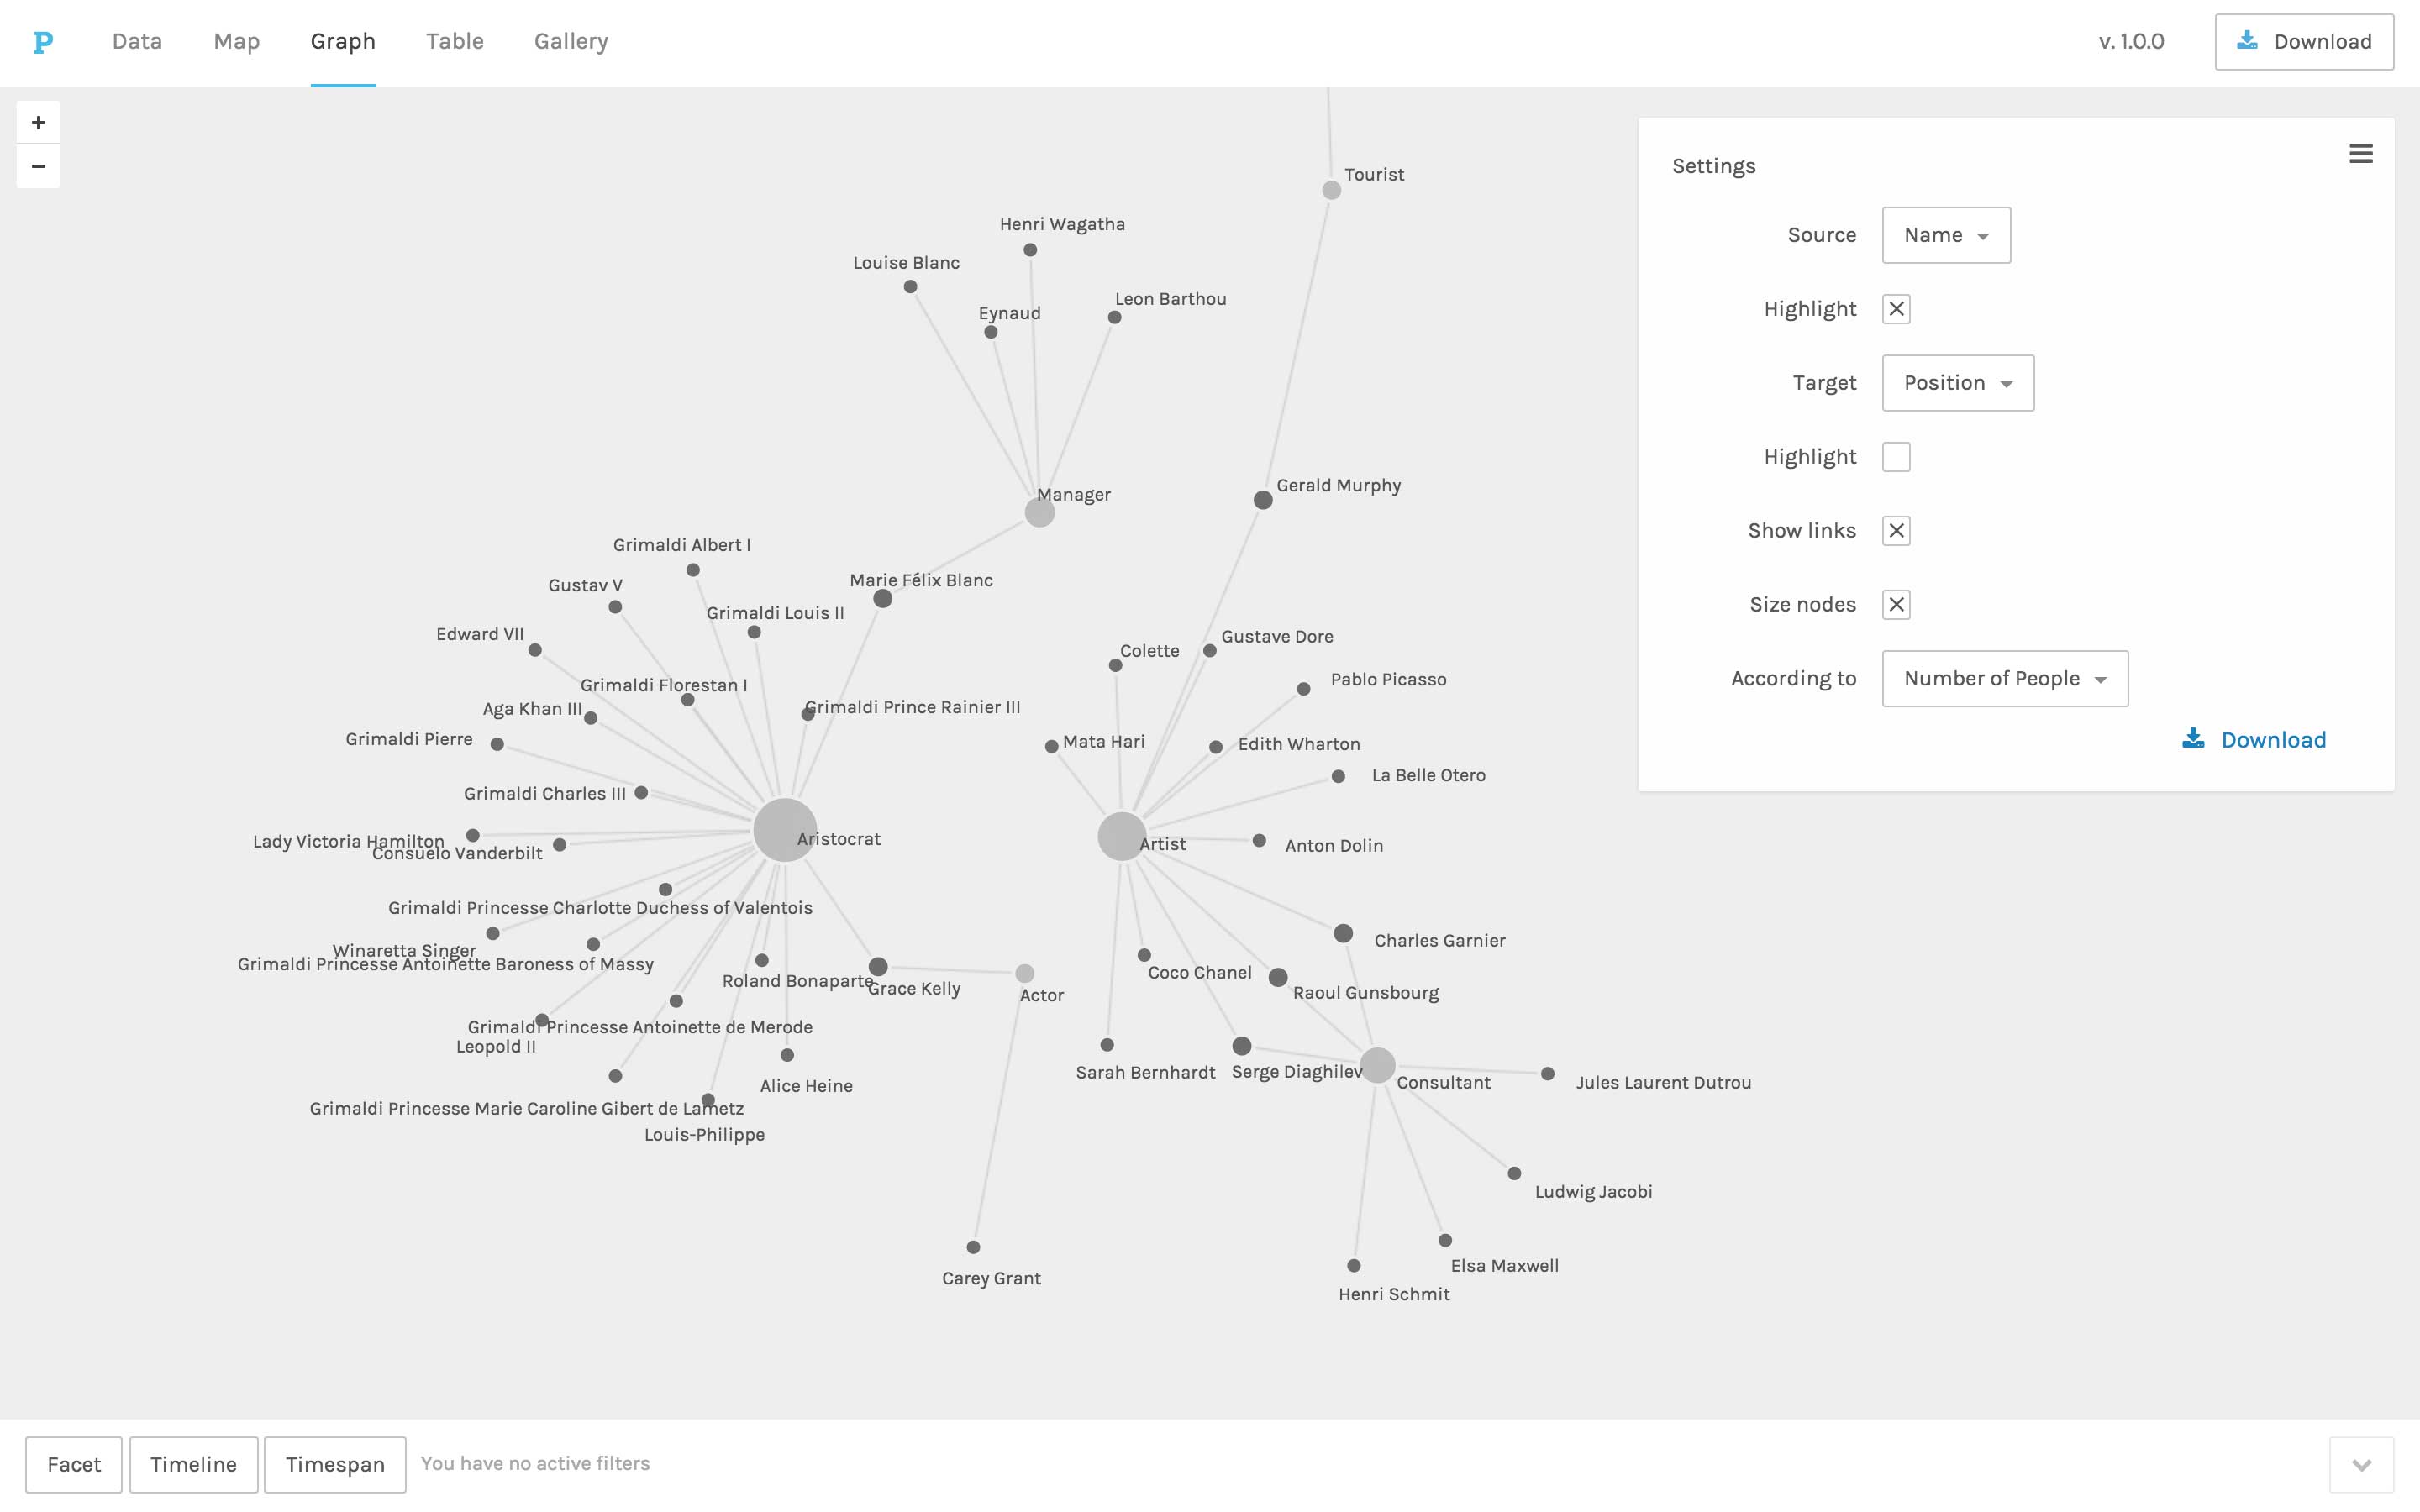
From the Stanford Humanities + Design Lab, Palladio is an online, free tool for generating maps and network graphs based on your data. Paste your data into the site in comma-separated (CSV) format, configure the relationships between data points and visualize the data on a map, network graph, or in a image gallery.
