Title Slide
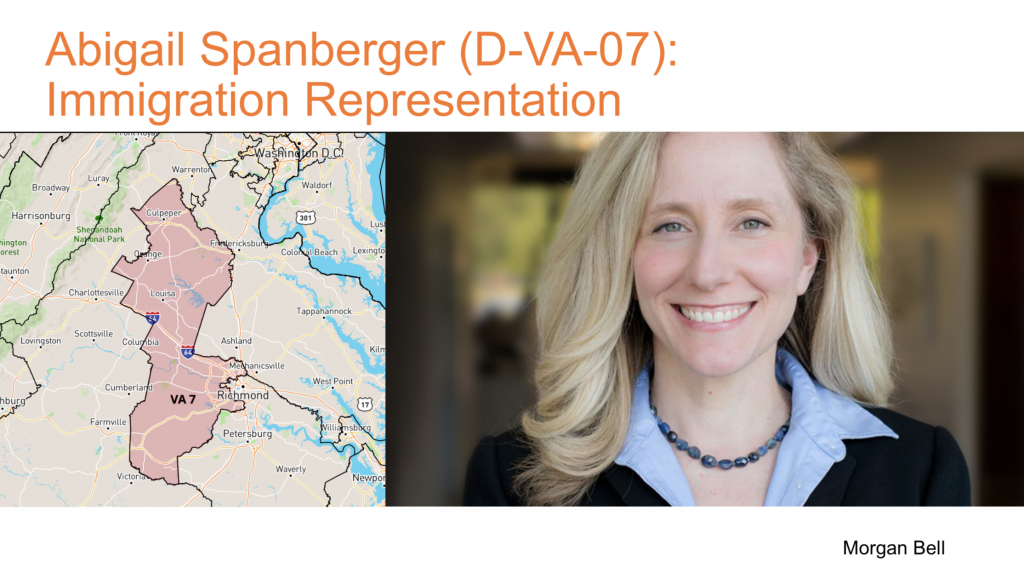
Abigail Spanberger represents Virginia’s seventh congressional district in the U.S. House of Representatives. The district is located in the suburbs of Richmond, VA, and its representative is a member of the Democratic Party.
Map from: https://www.govtrack.us/congress/members/VA/7
Photo from: https://abigailspanberger.com/
Slide 1
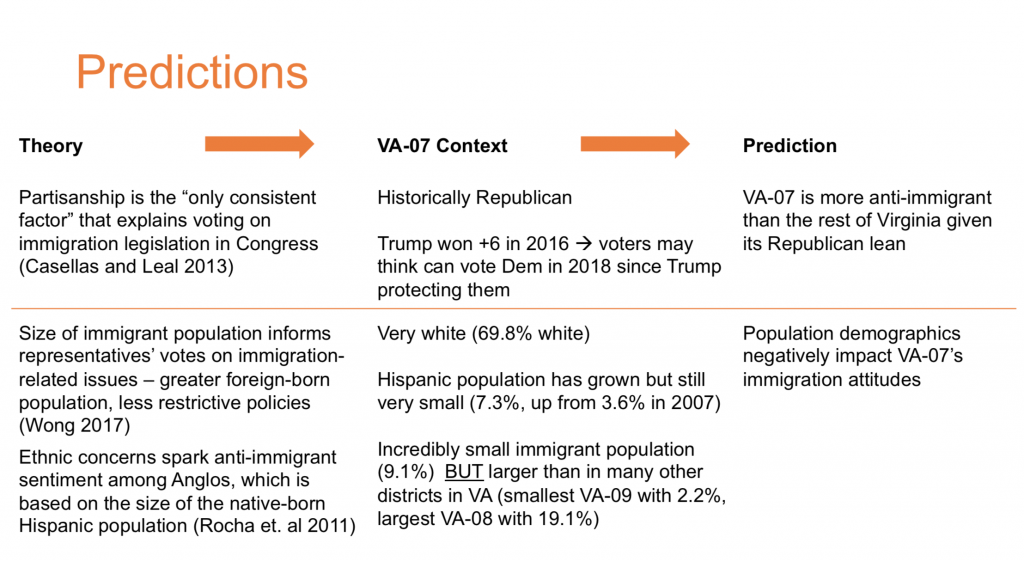
My main prediction going into this research was that I would find respondents in VA-07 to be more anti-immigrant than respondents in the rest of Virginia given the district’s Republican lean. In 2013, Casellas and Leal showed that partisanship is the “only consistent factor” that explains voting on immigration legislation in Congress, which really relates to the district’s representatives. However, the link between Republican representatives being anti-immigrant and their constituency is likely that the district favors a Republican representative, thus indicating their anti-immigrant sentiment, as is the case historically in VA-07. In 2018, VA-07 elected a Democrat, but the district has a long history of leaning Republican with Trump achieving a victory in the district in 2016 by +6 percentage points. In 2014, the district voted out incumbent Congressman and Republican Party leader Eric Cantor in the Republican primary election and eventually replaced him with an even more conservative Tea Party Republican Dave Brat. Perhaps then, with Trump in the White House in 2018, the district felt it could elect a Democrat because without many immigrants in the district, the voters felt their immigration concerns were being addressed by Trump. In addition, with such a small immigrant population, it is likely Spanberger would not betray the constituency’s wishes and support more restrictive immigration policies. Therefore, the districts attitudes on immigration would still be negative and likely more negative than other parts of the state. Also, it is likely that the district’s demographics negatively impact the residents’ immigration attitudes. Given that the greater the immigrant population in an area the less restrictive the policies are (Wong 2017), here the policies are likely to be restrictive given the minority immigrant population, thereby creating an anti-immigrant sentiment in the district. Additionally, as Assignment 2 showed, the district has been becoming less white, and the Hispanic/Latino population has doubled in the last decade. As Rocha et. al (2011) showed, ethnic concerns spark anti-immigrant sentiment among Anglos, which is based on the size of the native-born Hispanic population. Therefore, even though Hispanic/Latinos are still a minority in VA-07, the population increase likely sparked more anti-immigrant sentiment in the district.
Election info from: https://www.politico.com; https://www.newyorktimes.com

Slide 2
I used data from the 2018 Cooperative Congressional Elections Study (CCES) to analyze public opinion around immigration in VA-07 and compared it to the rest of VA. This survey is unique in that it aims to study midterm congressional elections, which in 2018 proved to be pivotal in VA-07 with the election of Abigail Spanberger in such a traditionally Republican district. Therefore, the 2018 CCES is useful for testing my predictions here since it studies attitudes around important issues such as immigration during an important midterm election for VA-07. My first step was cleaning the data to include only potentially relevant variables such as the question numbers from the pre-election questionnaire, Hispanic origin/descent, and race. This took the data from 60,000 observations down to 1,749 in VA and 190 in VA-07, specifically. The top section of this slide shows the question numbers from the pre-election questionnaire with a short description of the policy the question asked if respondents supported or opposed, and the full text is available online in the pre-election survey on Harvard’s Dataverse website. The bottom section of this slide includes the relevant variables I created from the data in order to see what affects support for increased border wall funding in VA. For instance, I made a dummy variable for whether or not the respondent is from VA-07 to see if living in VA-07 makes an individual more likely to support increased border wall funding. The first phase of my analysis though was that for each of the immigration policy questions in the pre-election questionnaire, I studied the percentage of respondents from VA-07 who supported or opposed the policy and compared this to the percentage of respondents from the other VA congressional districts who supported or opposed the policy. I then conducted a logistic regression to see which independent variables affected support for increased border wall funding.
Slide 3
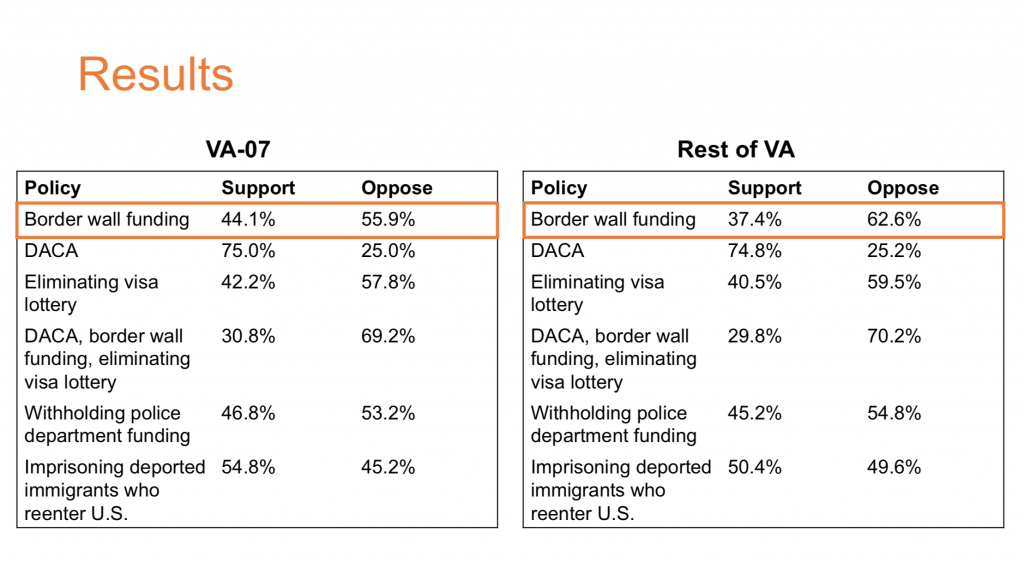
This slide presents the results of my analysis of the support and opposition to the immigration policies asked about in the 2018 CCES pre-election survey. Overall, there is not a great difference between VA-07 respondents’ immigration policy attitudes and those of the rest of Virginia respondents. The greatest difference between VA-07 and the rest of VA came in support for increasing border security by increasing spending to $25 billion and building a wall at the U.S.-Mexico border. 44.1% of respondents in VA-07 supported the policy compared to only 37.4% of respondents in the other Virginia congressional districts. This is interesting given the fact that the percentage of the Hispanic population in VA-07 is a fraction of the white population. Perhaps then VA-07 is a bit more anti-immigrant than the rest of Virginia, but the information here is insufficient to make such a claim. It is likely that when it comes to some policies, like the one here, which Donald Trump has pioneered, VA-07 is more anti-immigrant than the rest of the state. I therefore decided to zoom in on support for border wall funding in order to see what characteristics, or variables, impact respondents’ support for the proposed policy.

Slide 4
Here I show the results of my logistic regression in which I hoped to study if living in VA-07, gender, being Hispanic, being non-white and non-Hispanic, the size of the Hispanic population in respondents’ district, being a Democrat, or being a Republican affected support for increased border wall funding. The only statistically significant variables were gender, non-white and non-Hispanic, Hispanic population in respondents’ districts, being a Democrat, and being a Republican. This then shows that being a man, being non-white and non-Hispanic, the larger the district’s immigrant population, and being either a Democrat or Republican makes respondents more likely to support increased border wall funding. The fact that being a Democrat or a Republican is related to support for increased border wall funding is particularly interesting given the Republican Party’s reputation for being anti-immigrant and the Democratic Party being known as the political party that protects immigrants. A possible explanation for this finding could be that Democrats in VA-07 are more conservative than the overall Democratic Party. This cannot be verified here, but it is a possible explanation and an interesting path to study in future research. A central finding here though is that living in VA-07 is not a significant predictor of support for increased border wall funding, and therefore, my original prediction cannot be supported in full. The regression shows that living in VA-07 does not make a person more anti-immigrant, at least on the issue of border wall funding, but based on the percentage of respondents in VA-07 who supported/opposed various immigration-related policies, especially border wall funding support, respondents from VA-07 do tend to be slightly more anti-immigrant than the rest of the state. Perhaps this is due to the ethnic concern based on the percentage of the population that is Hispanic/Latino. The regression shows that the greater the percentage of the population in a district that is Hispanic/Latino, individuals are more likely to support increased border wall funding. While the Hispanic/Latino population in VA-07 is small, it is larger than about half of the other districts in the state, and its growth over the last decade could have sparked ethnic concerns and in turn anti-immigrant sentiment. Considering all of this, it is clear then that Spanberger should continue to be the quiet immigrant-rights supporter she has been since entering the U.S. House of Representatives in January. Given the Republican lean of the district which corresponds to the greater percentage of respondents who supported increased border wall funding, this is the best approach for Democrat Abigail Spanberger to support immigrants while protecting her seat.
Honor Code:
This assignment represents my own work in accordance with University regulations. – Morgan Bell
