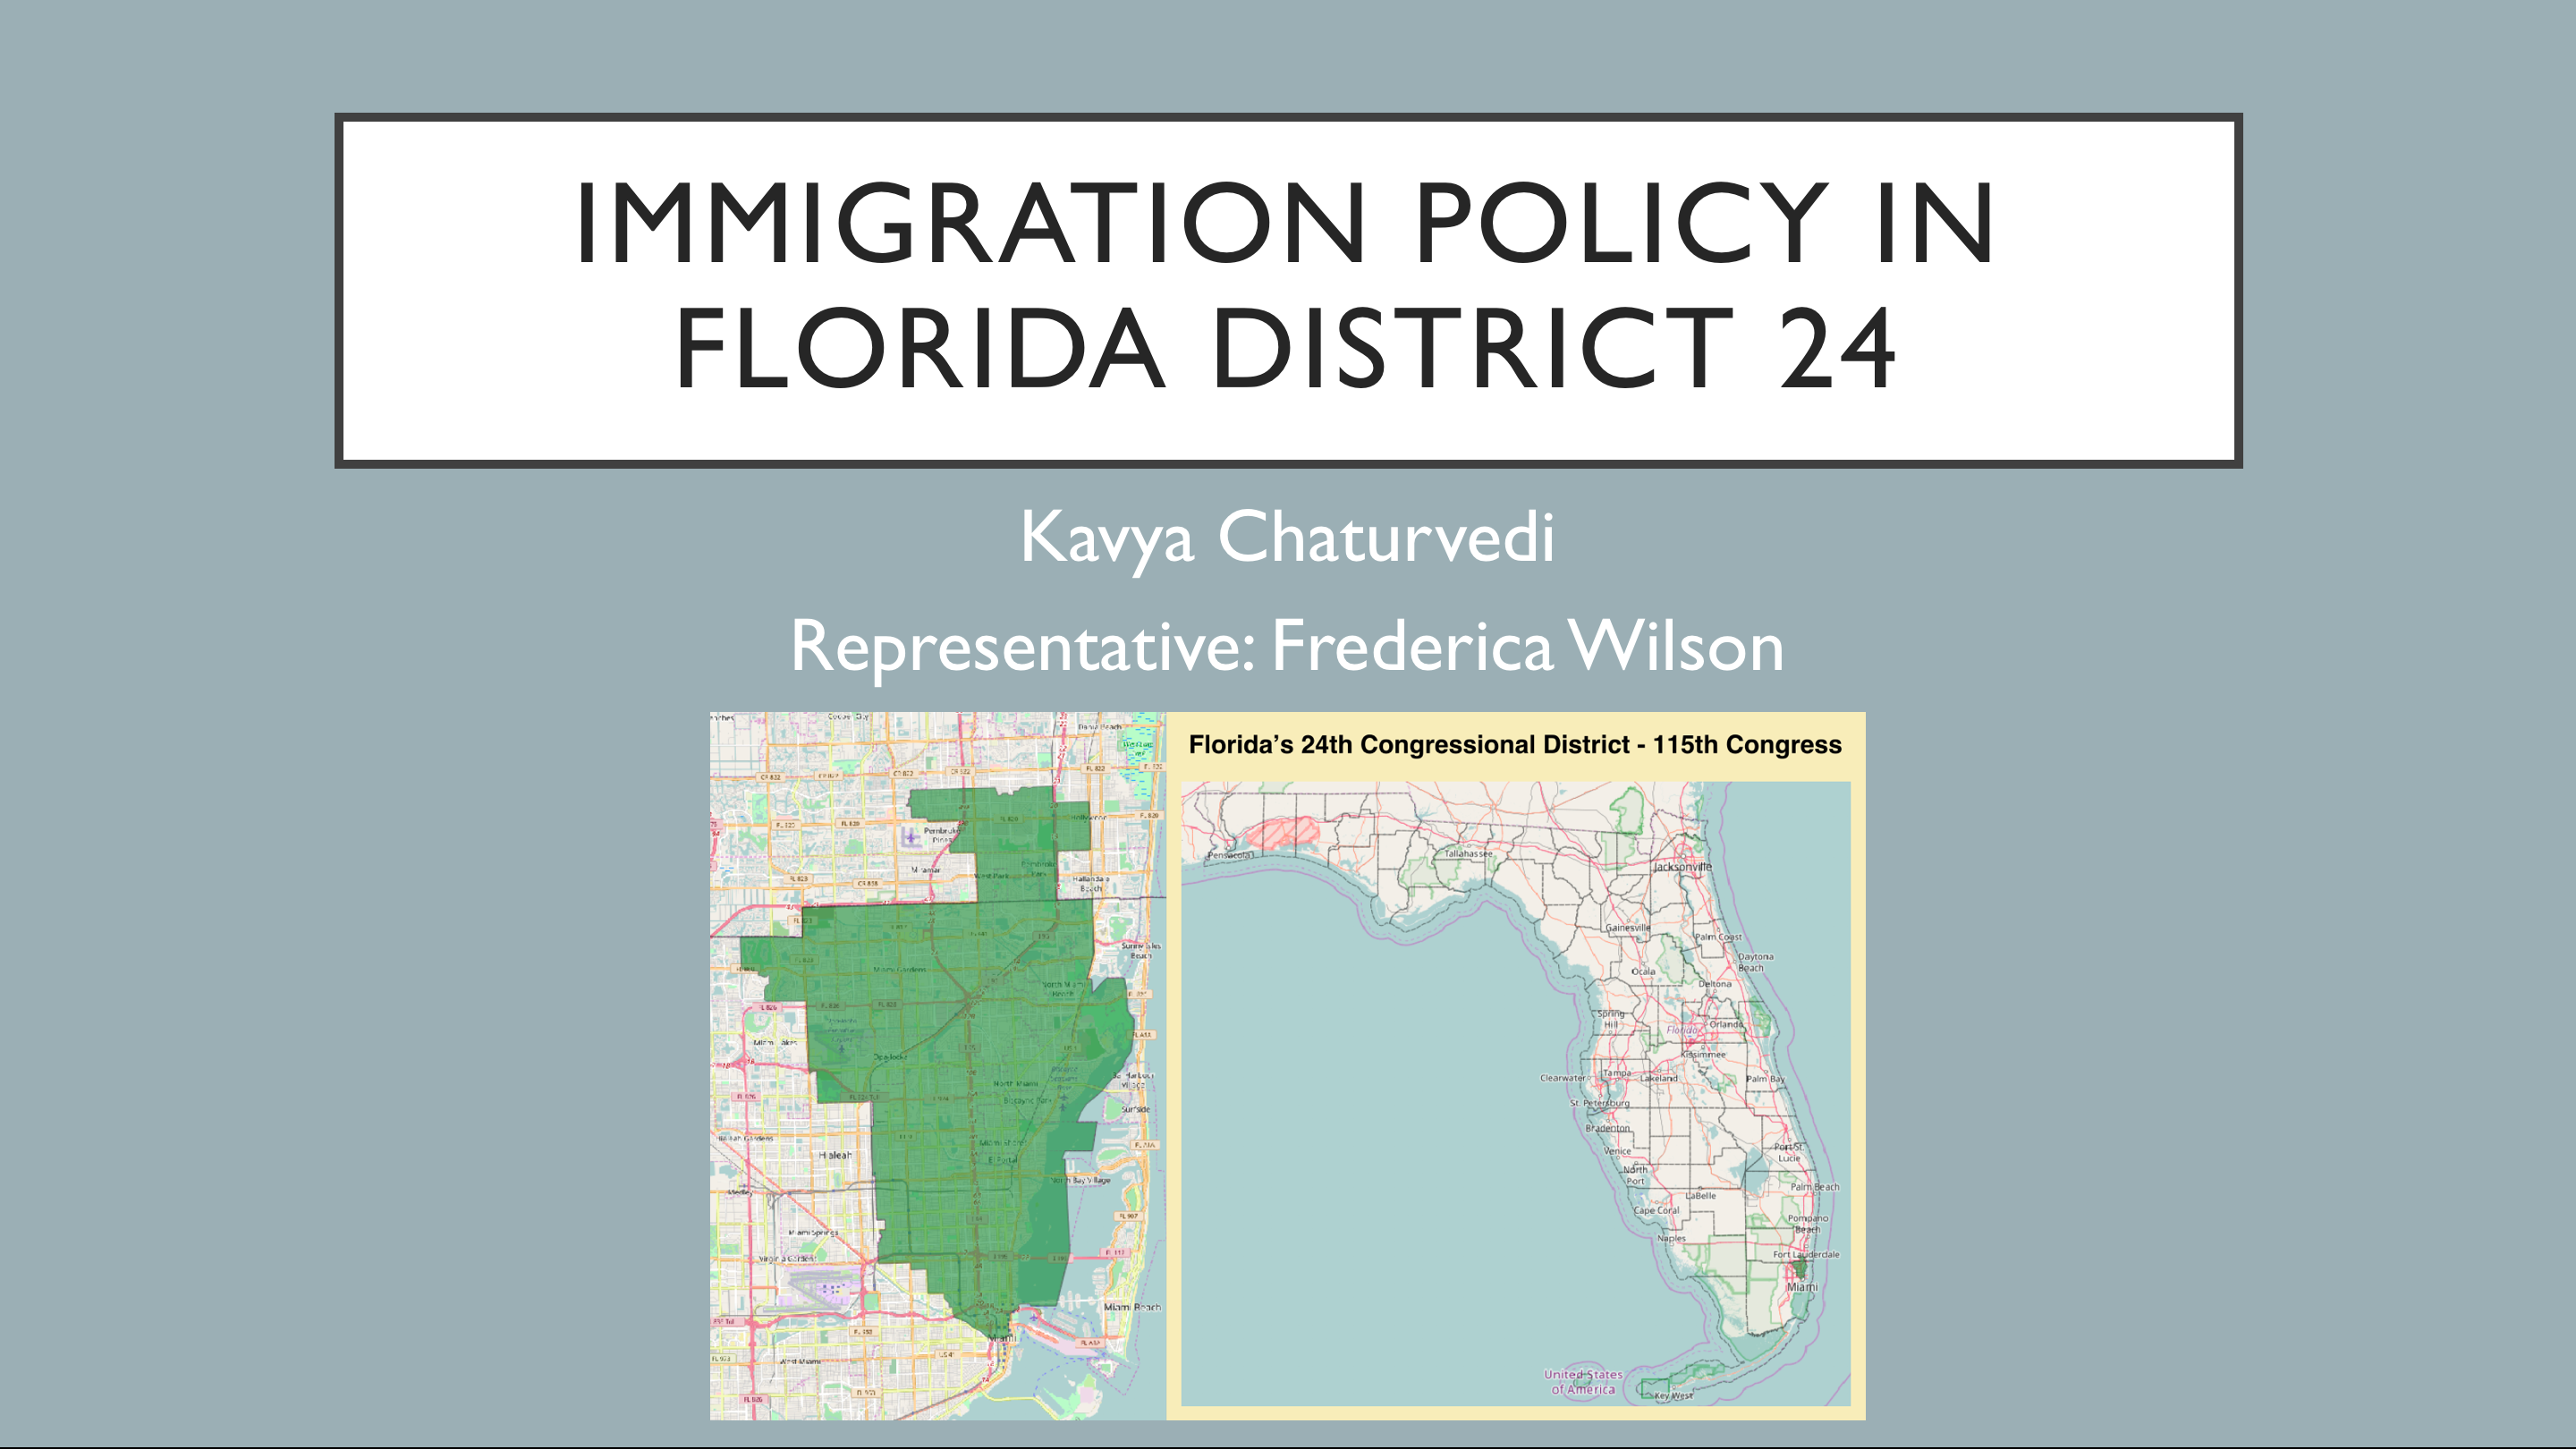
Slide 1: District Demographics: Naturalized Citizens and Hispanics Increase Over Time
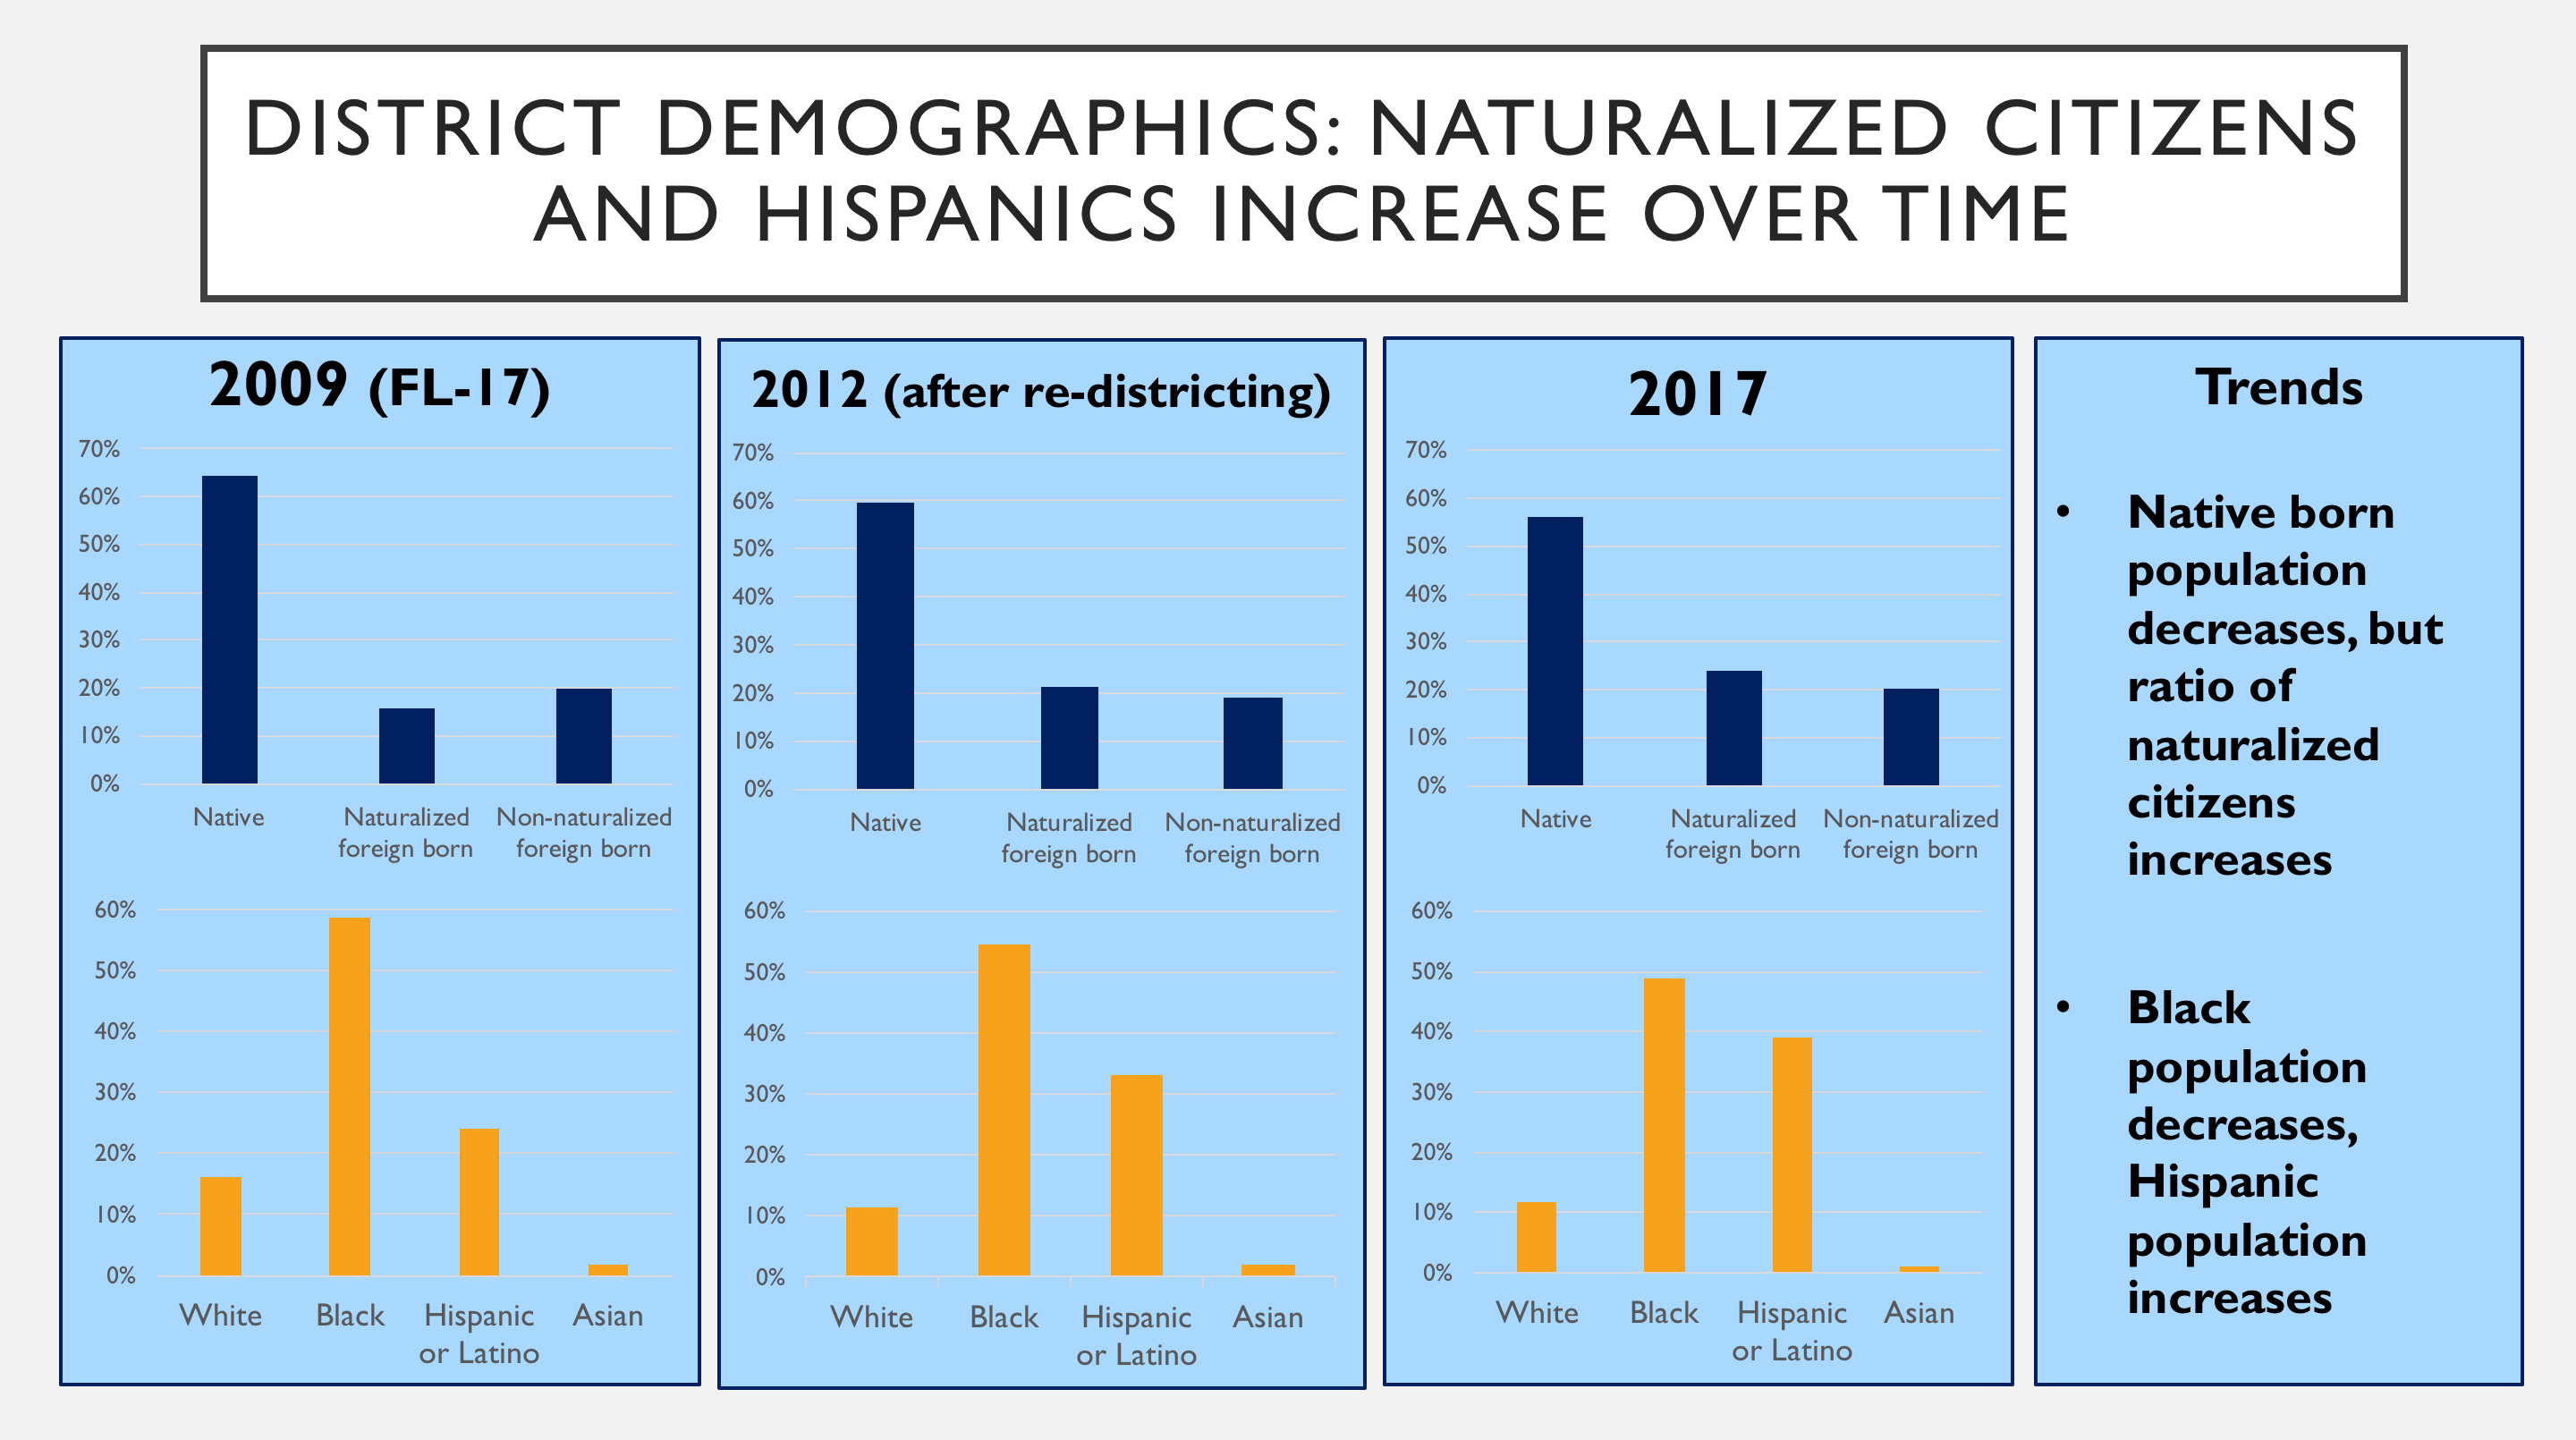
This slide compares two different sets of bar graphs over time, in the same area, from 2009 to 2017. The 2009 column is data from the former FL-17 to account for redistricting that occurred in 2010. The current 24th district is composed of 82% of what was the 17th congressional district before redistricting. The top row of bar graphs, in navy blue, compares the number of native, naturalized and non-naturalized foreign-born population within the district. As can be seen from this data, the percentage of native born citizens in the district decreases over time by approximately 8 percentage points, from about 64% to 56%. Conversely, the percentage of naturalized foreign-born citizens has increased by this amount, going up 8 percentage points from 2009 to 2017. The percentage of non-naturalized foreign-born population remained the same, around 20%, throughout this time period.
The second row of graphs illustrates the racial makeup of the district over time. The previous FL-17 had a large black population of 59%, which has decreased 10 percentage points over time to 49% in 2017. While the white population has always been far lower than the national average, the white population decreased by 5 percentage points after redistricting, and was 12% in 2017. The notable increase in racial groups is the steady increase of Hispanic or Latino over time, by 15 percentage points over time. In 2017, the district was 39% Hispanic or Latino.
Slide 2: Effects of Latino Population Growth
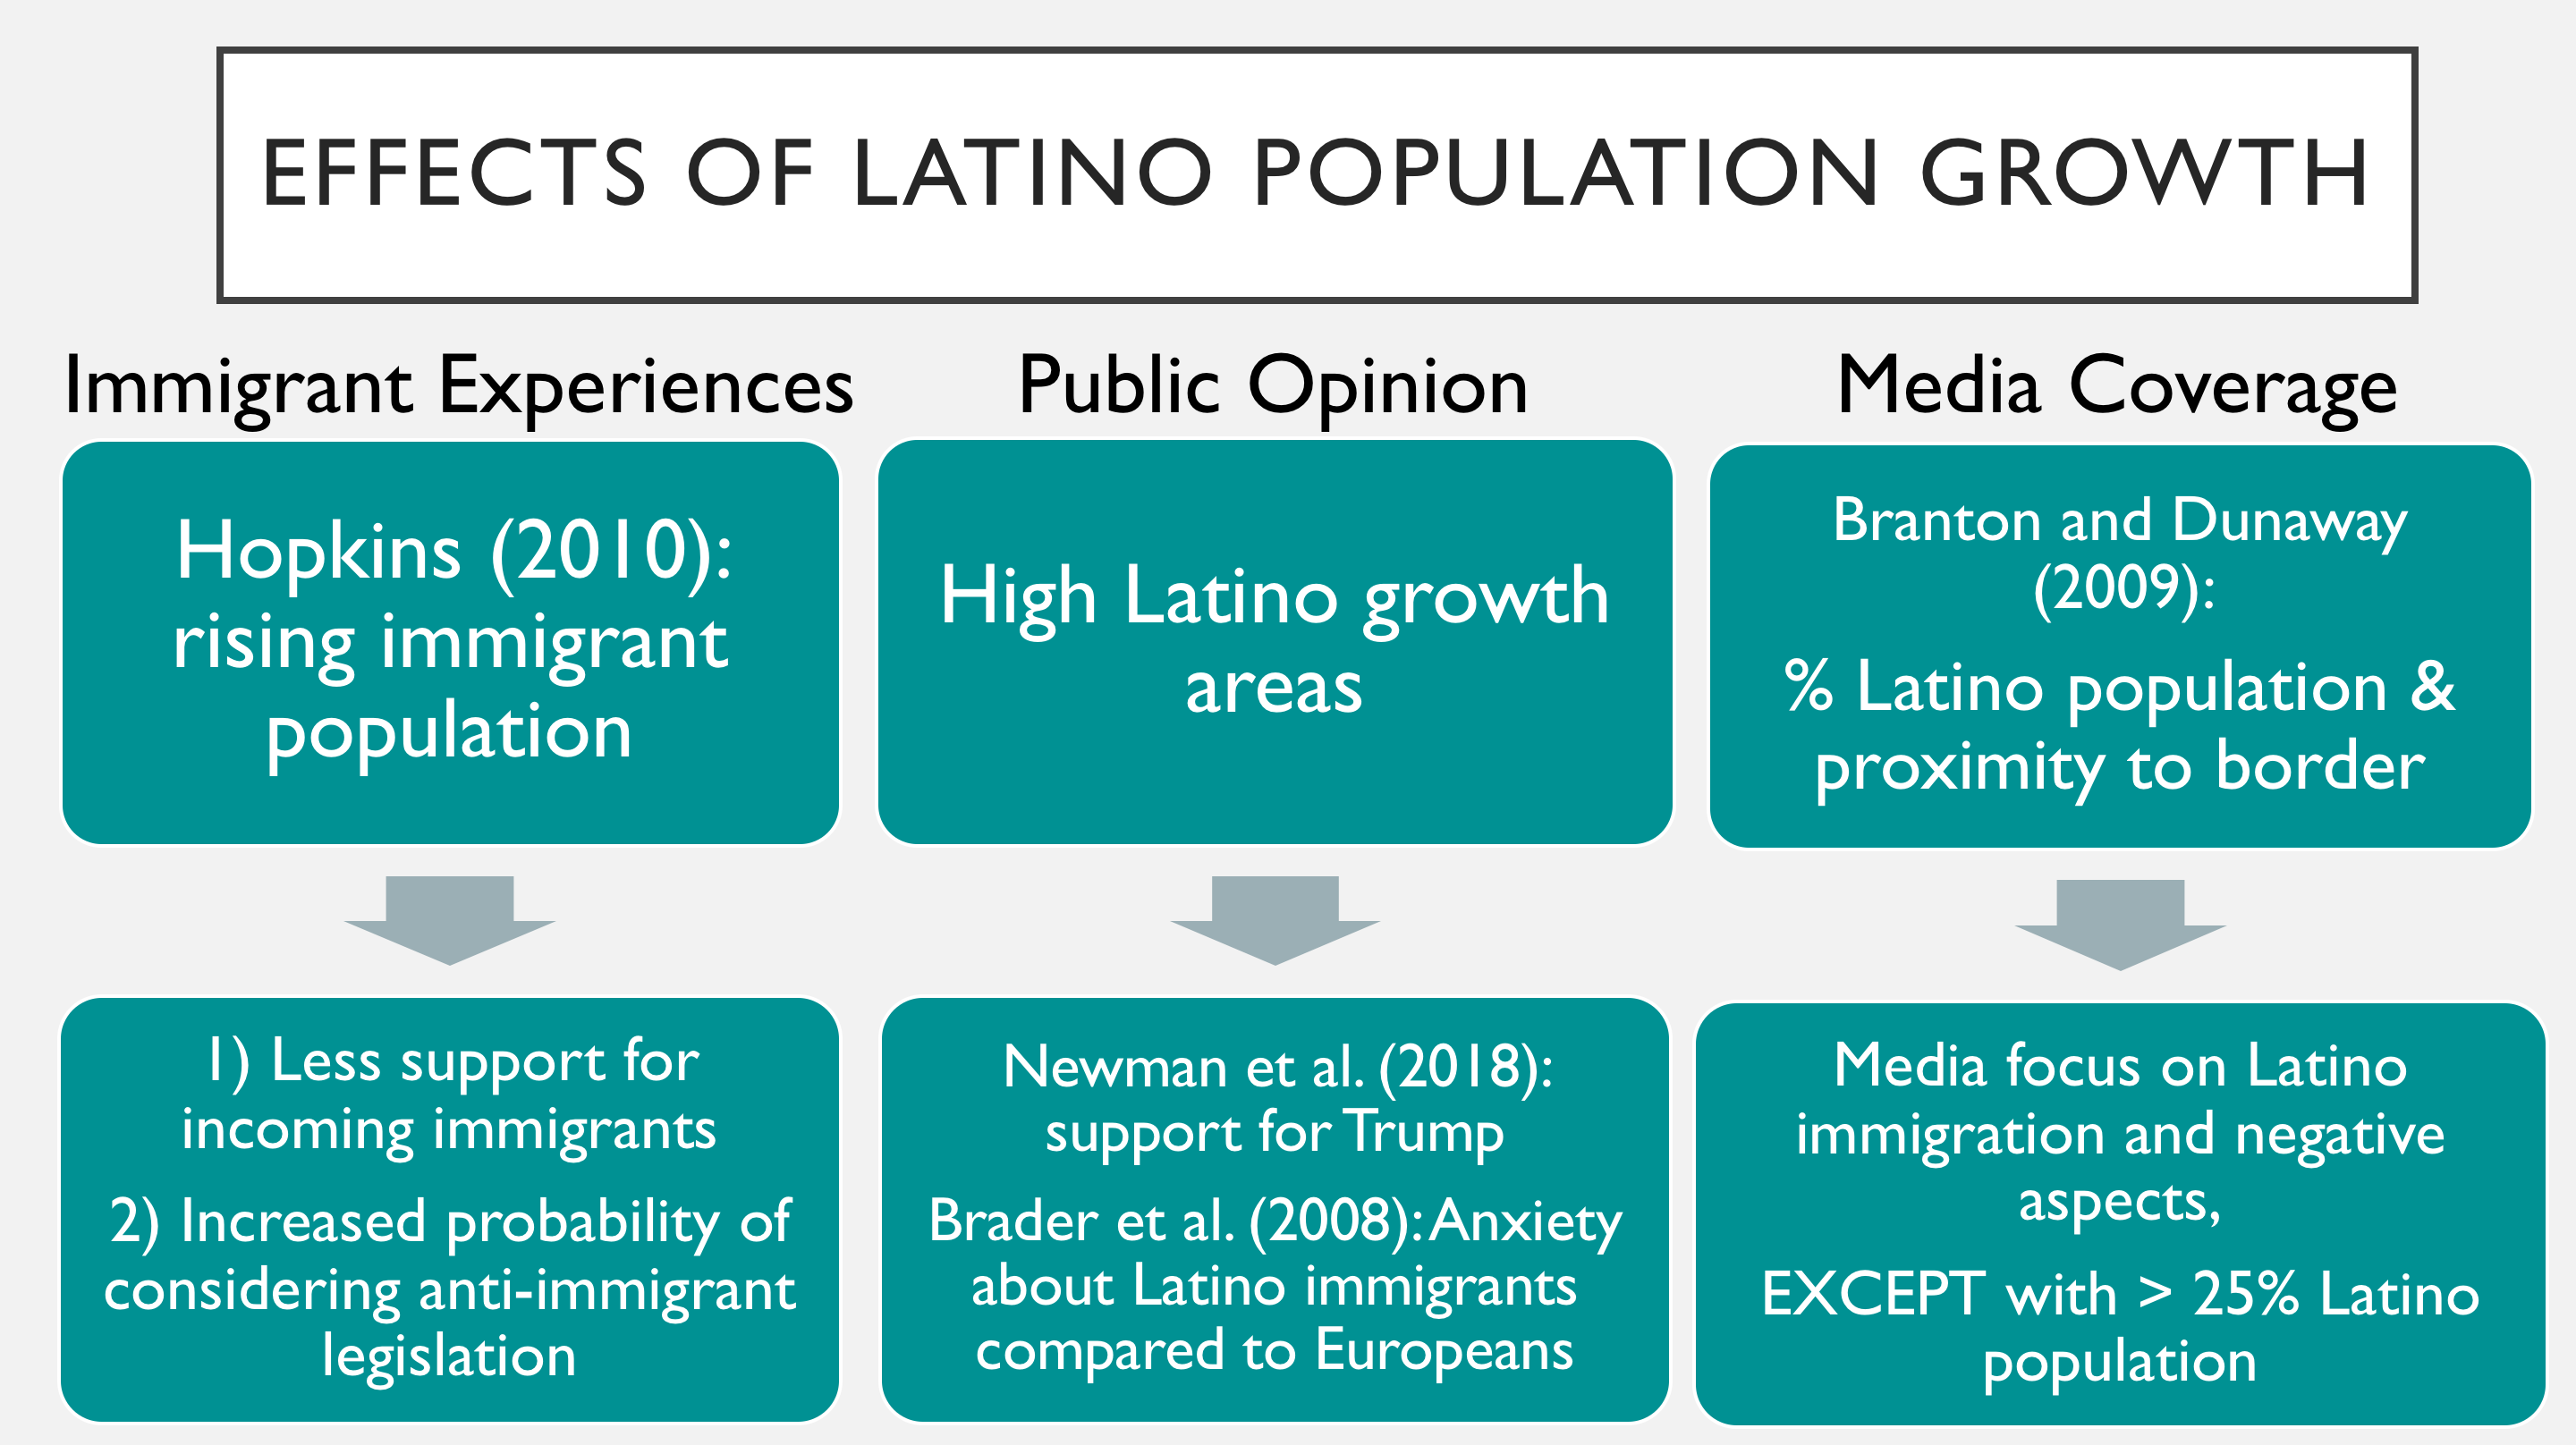
Much literature exists describing the effects of both a rising immigrant population and the percent Latino population on a variety of dependent variables. First, for immigrant experiences, Hopkins (2010) argues that rising numbers of immigration reduces support for these immigrants and for immigration in general. Further, he argues that this immigration growth also affects policy outcomes. A growing number of immigrants greatly increases the probability of a locality considering anti-immigration legislation. Hopkins even states that the probability of an anti-immigrant proposal being considered doubles from 34% to 66% as the share of immigrants increases by 8 percentage points. Second, looking at the effect of public opinion, two studies examine the effect of living in a high Latino growth area on different aspects of public opinion. Newman et al. (2018) show how the marginal effect of Latino growth increases significantly after inflammatory comments about Latino immigrants, suggesting that support for Trump increased when citizens had lived experience with Latino growth. Brader et al. (2008) similarly find that Latino immigrants lead to anxiety and feelings of threat in a way that European immigrants do not.
Finally, for the media coverage on immigration, Branton and Dunaway (2009) show that news organizations closer to the border publish more articles about Latino immigration that focus on the negative aspects of immigration, and this also correlates strongly with the percentage Latino population. However, these authors do note that as the percentage Latino population exceeds 25%, the volume of coverage on Latino immigration declines, most likely because news networks do not want to alienate the local demographics.
Slide 3: Literature’s Predictions May Not Extend to FL-24
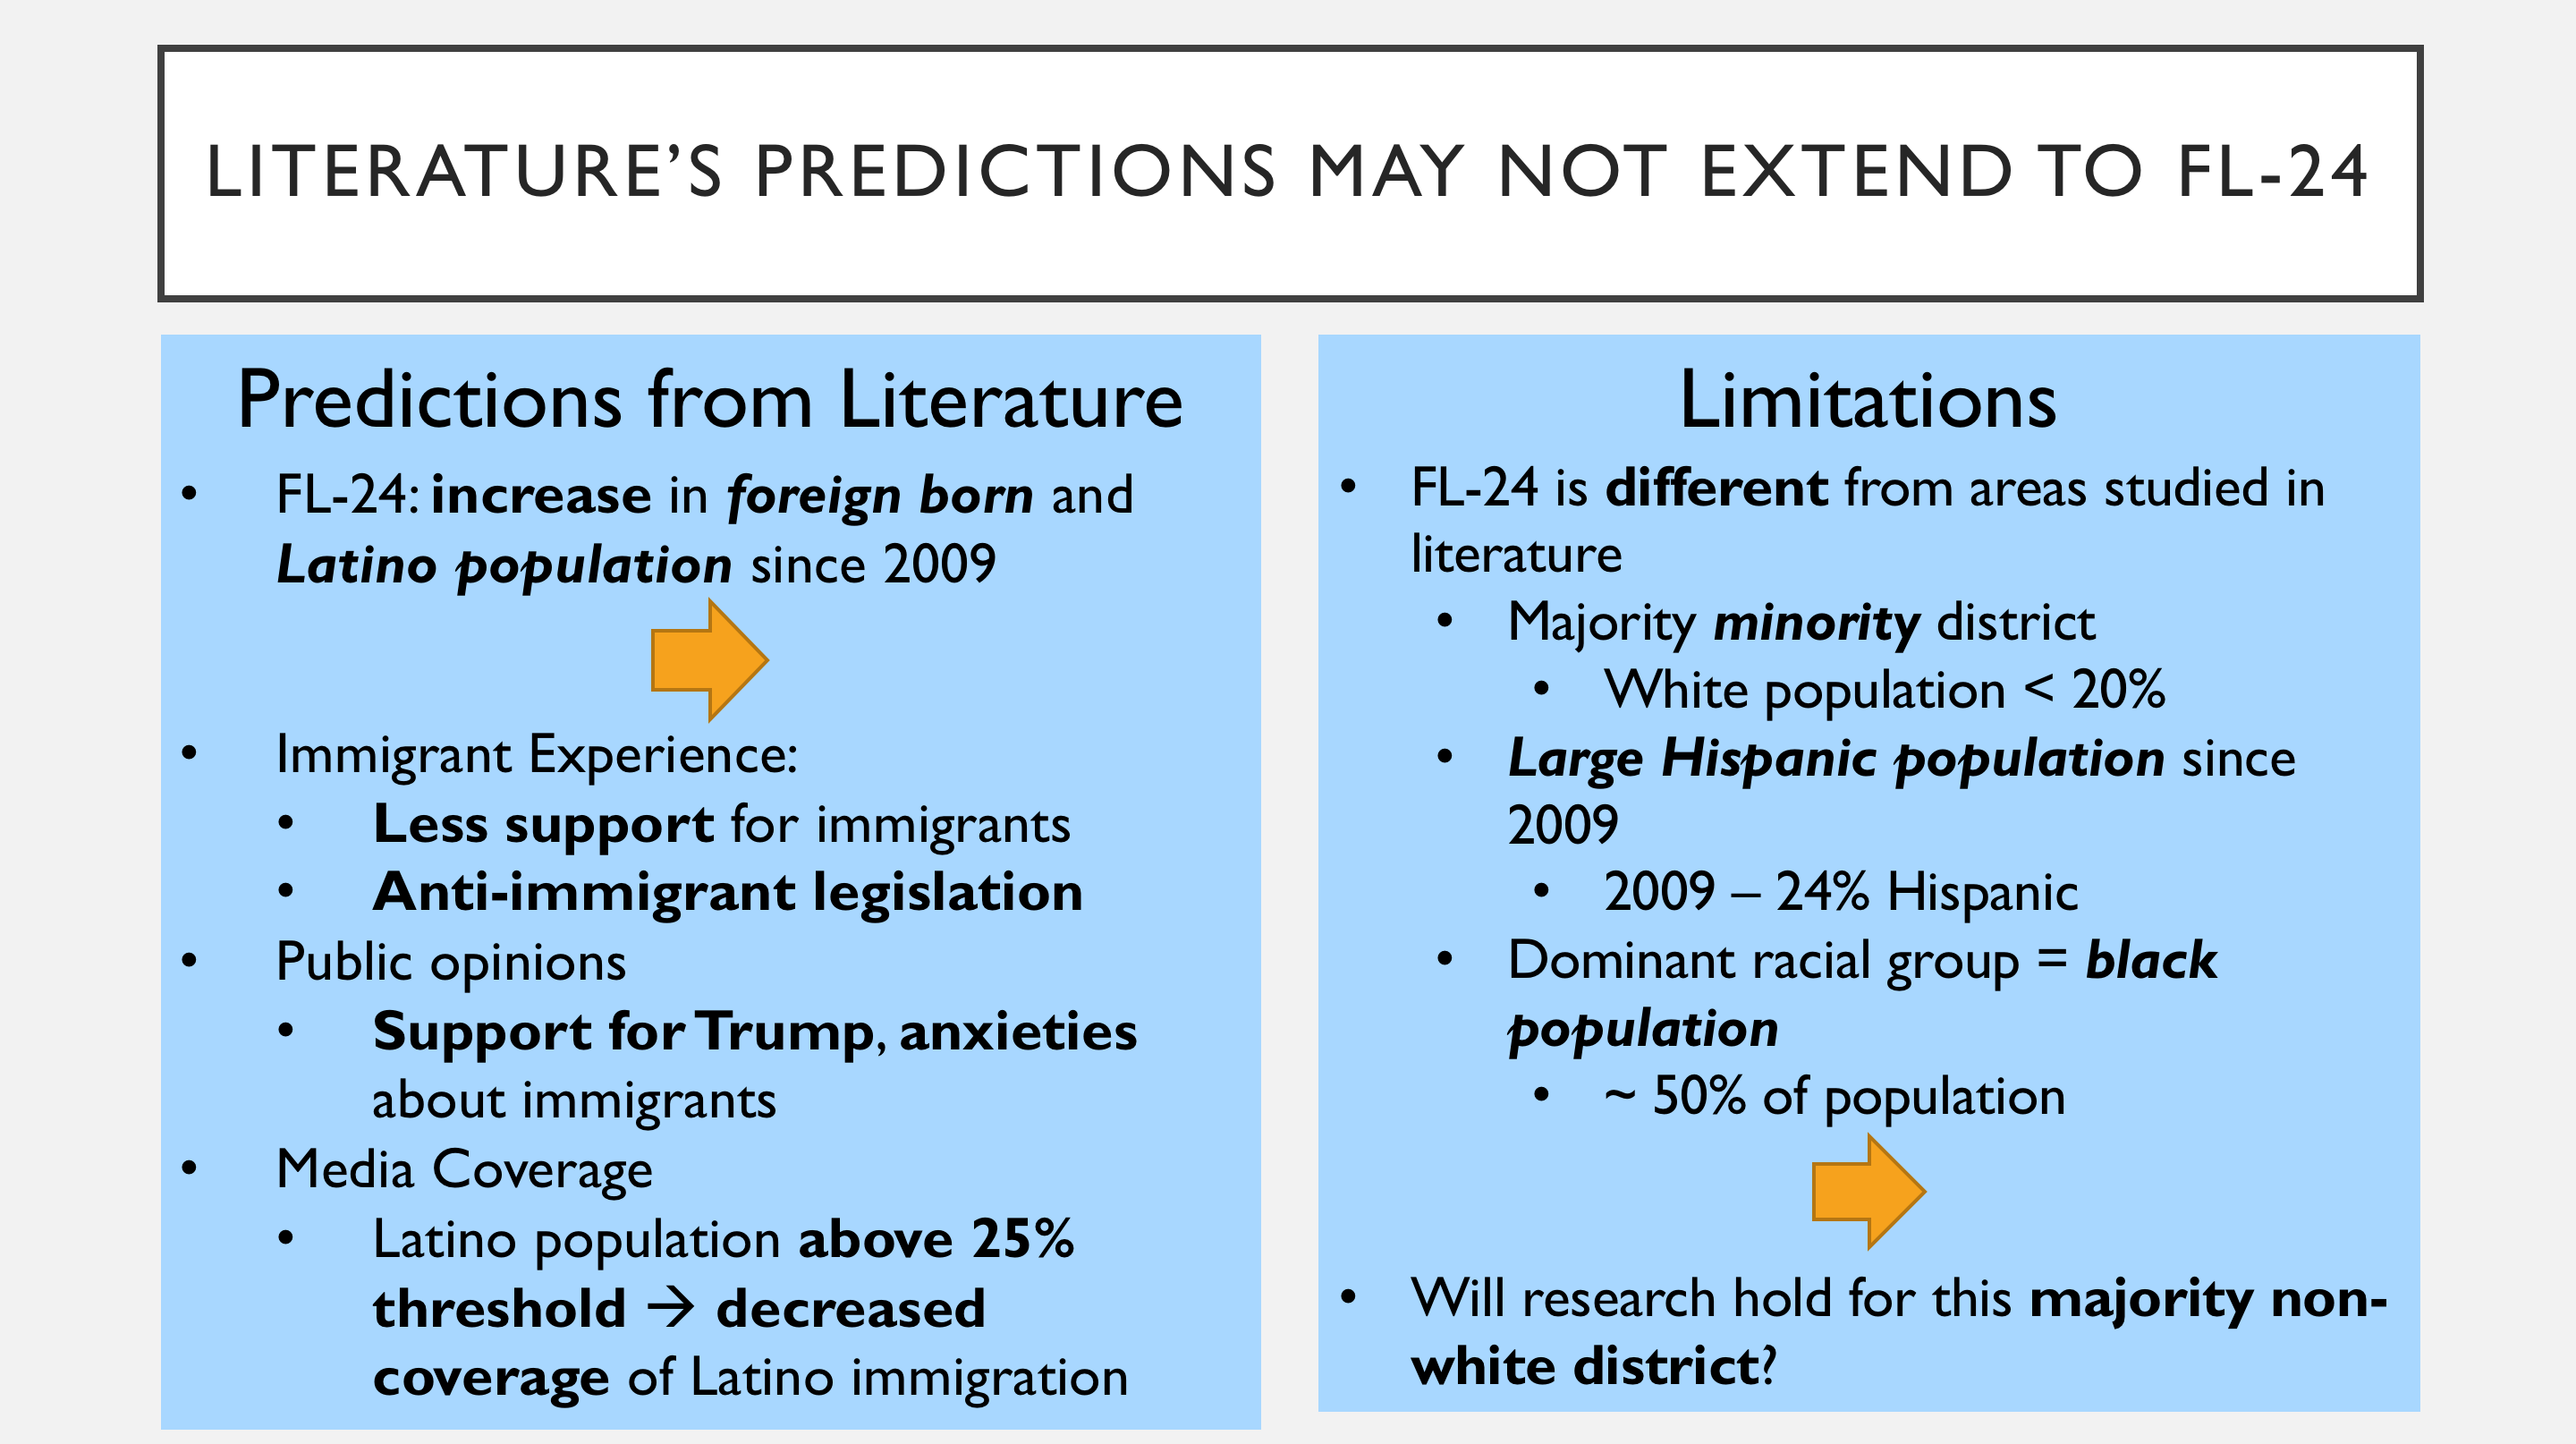
Based on the research presented above, the recent growth in the Latino population and immigrant population within FL-24 should predict less support for immigration almost entirely across the board. First, in terms of the immigrant experience, there should be less support for incoming immigrants and a stronger consideration of anti-immigration legislation. This is especially true because FL-24 had an increase of the immigrant population of 8 percentage points, the same number that Hopkins cites as leading to an almost doubling of anti-immigrant proposals being considered. In terms of public opinion, the Latino growth should have a large positive impact on support for Trump and increase anxieties about these Latino immigrants. Lastly, according to the predictions from Branton and Dunway (2009) about media coverage, because the immigrant population is well above 25%, coverage of Latino immigration will decline. Thus, with FL-24’s nearly 40% Latino population, Latino immigration will most likely not be heavily covered in the news media.
Most of the existing research does not account for unique situation that FL-24 is in. While there has been growth of the Latino population and immigrant population within the past 10 years, the district has remained a majority minority district, in which the white population is never more than 20%. In addition, the Hispanic and Latino population started very high in 2009 compared to national averages, at 24%. Further research thus needs to analyze whether existing research holds up in a majority black district and whether the anti-immigrant sentiment is as strong with such a large Latino/Hispanic population.
Slide 4: Analysis of How Hispanic Population Affects Media Coverage on Immigration
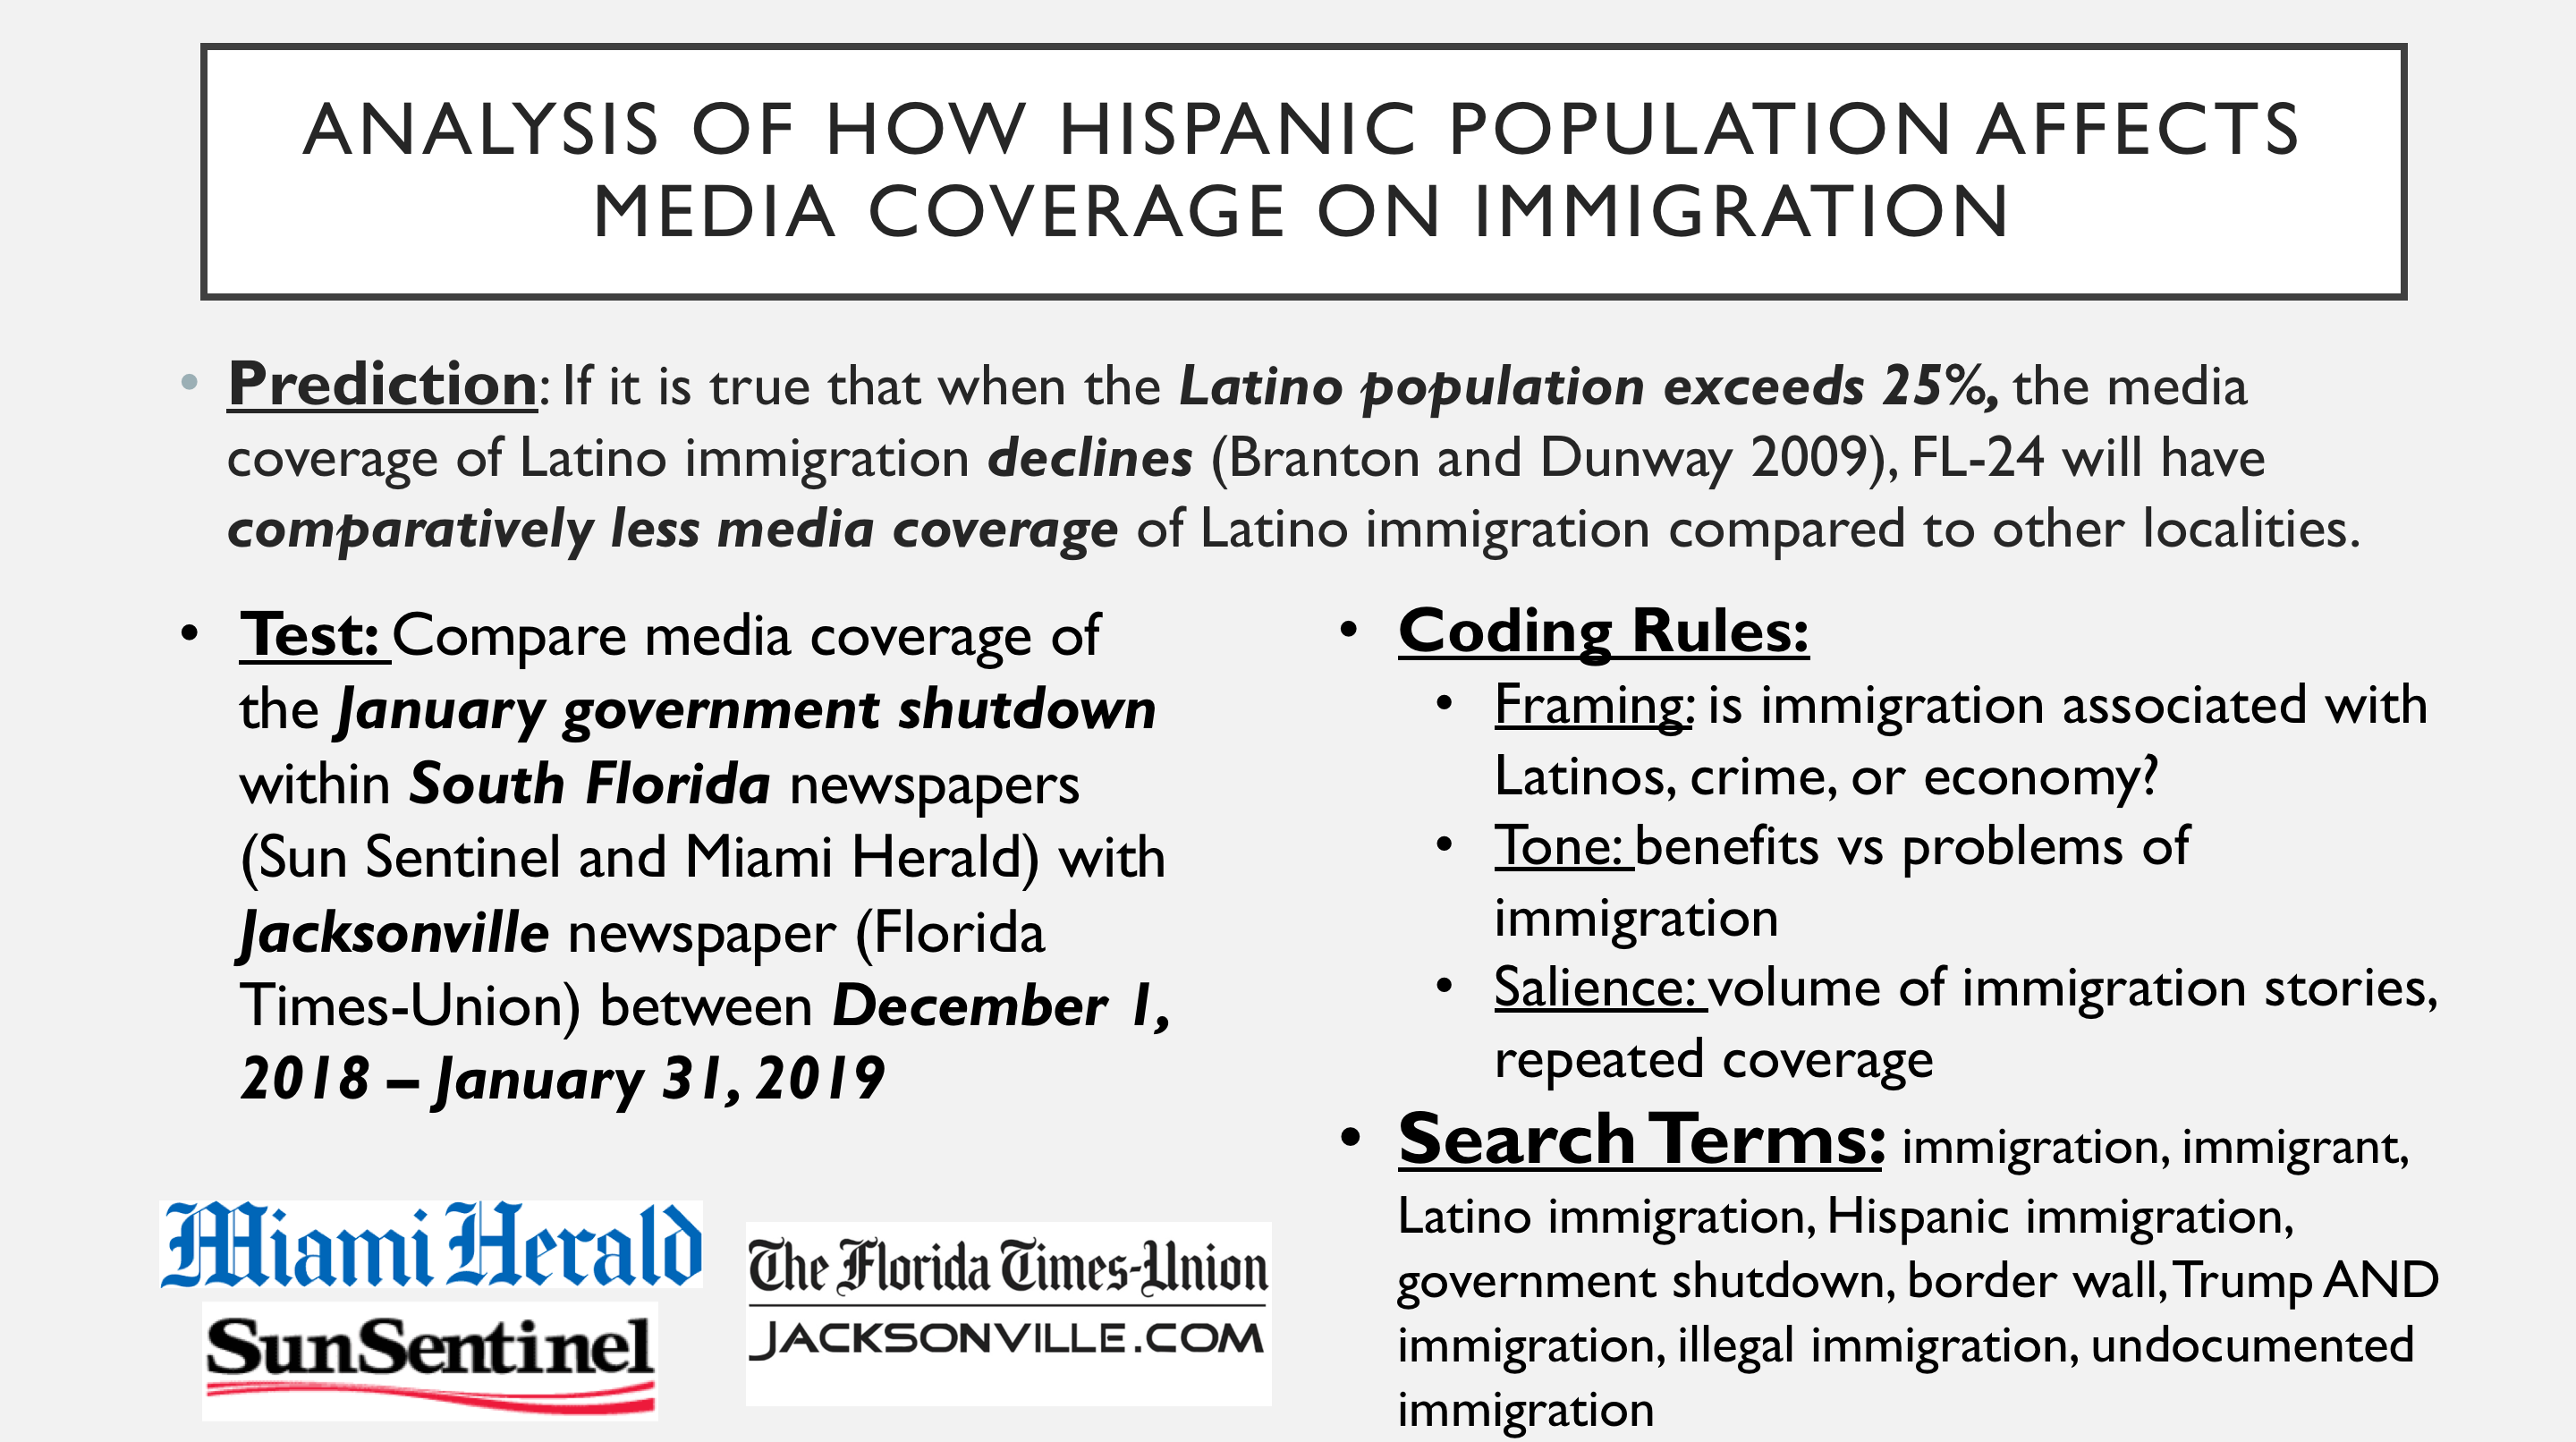
My research plan will test the application of the findings of Branton and Dunway (2009) to FL-24 – that at the point at which the Latino population exceeds 25%, the coverage of Latino immigration declines. To do so, it will be necessary to study more than just FL-24, which has a Latino population of nearly 40%, but also the media coverage of the area to another area with a Latino population of less than 25%. I have chosen Jacksonville as this area, because Florida’s 4th district, the district including Jacksonville, has a Latino population of just 8%. However, Jacksonville is a large enough city to have its own media to study. Thus, my research will compare the coverage of South Florida newspapers, The Miami Herald and the Sun Sentinel, with the prominent Jacksonville Newspaper, the Florida Times-Union. For South Florida, I have chosen to look at both The Miami Herald the Sun Sentinel because together these newspapers cover both Miami-Dade and Broward County, both of which are included in FL-24.
With these sources, I will compare media coverage surrounding the January 2019 federal government shutdown and border wall debate. Given that the government was shut down from December 22, 2018 until January 25, 2019, I will examine the time period from December 1, 2018 to January 31, 2019. I will compare these sources on three metrics: framing, tone and salience. To measure framing, I will assess whether the issue of immigration is associated with Latinos, crime, or the economy. To categorize tone into positive, negative, or neutral, I will assess whether the individual news stories discuss the benefits or problems of immigration, or whether no preference is given. To measure salience, I will measure the volume of immigration coverage throughout the time period and see if there is repeated coverage of the same issues. Finally, the following will serve as my search terms: immigration, immigrant, Latino immigration, Hispanic immigration, government shutdown, border wall, Trump AND immigration, illegal immigration, undocumented immigration.
