Category: Assignment 3 (page 4 of 4)

CA 40- Immigrant Interviews

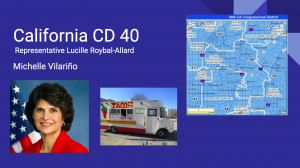
Slide 1: California’s 40th congressional district is a largely Hispanic district that contains the areas of Downey, Mayhood, Vernon, East Los Angeles, Los Angeles, Bell, Bell Gardens, and more. In the last 10 years, the Hispanic population has increased by 7.3 percentage points. Due to this large Hispanic population and its increase, I predict that California 40’s immigrants are more likely to have a feeling of belonging and will be able to socially integrate better. This is based on the research from Fernández-Kelly 2019, who studied the integration paradox in Princeton (where there are lots of opportunities for immigrants but a smaller immigrant population) and in Trenton (where there are less opportunity but a larger immigrant population). Here she found that a large Latino presence can create a feeling of belonging to other Latino immigrants, this would help them socially integrate better. In the research done by Abrajano and Hajnal 2015, who studied the consequences of negative attitudes towards immigration, they state that in a large Hispanic population, whites are more likely to think immigration is a serious problem. Based on this, I also predict that whites in California 40 are more likely to think immigration is a serious issue.

Slide 2: To test my prediction I interviewed two immigrants that live in California’s 40th congressional district, Sandra Vilariño and Erick Vilariño. I asked them individually where they immigrated from and when, as well as why and what the process was like. The interview questions were as following: What are the different population or ethnic groups in the area and have you noticed any changes in them over the last 10 years, or since you arrived in the US? What impact would you say these demographic shifts have had on the community? Has this affected your daily life activities or political participation? What are the major issues immigrants face in this area? What could be done to fix this? Would you generally say there is widespread acceptance and openness to immigrants by non-immigrant or white American population? What do you think their opinion is and has it changed in the last 10 years? Do you feel represented in politics? Do you and other immigrants you know participate in voting or have high levels of participation? What would help you vote or feel better represented in your district? Do you feel you belong in your district? I believe these questions will help me see how the impact of California 40’s population change on the immigrant experience.

Slide 3: Both immigrants are from Cuba and immigrated to California 40 in 1995. Erick Vilariño said that the immigration process for him was simple because he qualified for a visa lottery and won a visa to the U.S. He wanted to come to the U.S. for better opportunities and a better life. All of his friends are immigrants. He believes that the district contains majority Hispanics and a few white non-Hispanics. In the last 10 years, he has noticed a drastic increase in the Hispanic population. He’s noticed that in the last 10 years, the district favors Democrats much more. He doesn’t think there’s any change in daily life activities or political participation, but he has noticed an increase in crime. He thinks the biggest issue immigrants must face in the district is the language barrier which he thinks there should be a better program in place so that immigrants could learn English. He thinks whites have a negative opinion about immigrants and that this has increased in the last 10 years. He sometimes feels represented in politics and he does participate in voting, he thinks that political participation has increased in the Hispanic community. He thinks that there should be more information about what’s going on in the politics of the district. He feels like he belongs in some way in the district because this is where he’s lived the longest. Sandra Vilariño said that she wanted to immigrate to the U.S. because it was her dream since she was 5 but that the immigration process was long and embarrassing because her aunt filed for family reunification since 1980 and she was only able to immigrate in 1995. She says she knows a lot of immigrants mostly Hispanic, some European and Asian. She has noticed a drastic increase in Hispanics in the last 10 years. She thinks this change is mostly negative than positive. She thinks the city is dirtier and that there’s a lot more crime, violence, and gangs. She believes that the biggest issue immigrants face in the district is that non-immigrants believe that they are all the same, criminals and gang members. She thinks whites believe that immigrants don’t belong, that immigrants steal their jobs, their cultures, and their homes. She doesn’t feel represented in politics but she does vote and have high levels of participation. She hopes to see a change and more acceptance of immigrants. She does feel like she belongs in the district because she identifies with the city, the culture, and its problems.

Slide 4: The results align with my predictions. Both immigrants have integrated politically and socially, seen in their high levels of political participation and voting as well as their participation in the immigrant community. Both immigrants feel a sense of belonging in their district. Both immigrants also feel that whites have a negative opinion of immigration and that this sentiment has increased in the last 10 years. This research is limited by only two immigrant participants but I believe that it is accurate to what is happening in the district.

TX-18 – Public Opinion Analysis

Hypothesis Based on TX-18 Demographics

Abrajano and Hajnal discussed in White Backlash (2015) that Whites who live in areas with higher immigrant populations are typically more conservative, vote Democrat less, are less supportive of general social welfare expansion, and more punitive of illegal immigrants. Based on this theory and the demographics of TX-18 – namely, that it has a large foreign born population (23% compared to the general US foreign born population of 13.5%) – I predict that TX-18 will be emblematic of this theory. To test this, I will compare the relevant views of Whites in TX-18 to those in another congressional district in Texas that has a low foreign born population. I choose to compare TX-18 (which comprises much of Houston) to TX-12 (which comprises much of Fort Worth); I made this decision because the districts were similar on covariates (besides the Fort Worth district having higher median incomes) yet had starkly different foreign born population sizes.

Data Collection and Methods

To test my prediction I need a big dataset that asks election/politics style questions to a large and representative audience; the CCES (Cooperative Congressional Election Study) dataverse is a great choice for this. From this dataset I pulled a total of eight variables that included relevant ID variables, the Respondent’s race, and four variables that directly related to the four public opinion focuses I am interested in exploring, given Abrajano and Hajnal’s theory, which includes the Respondent’s vote in the 2016 presidential election, their view on the expansion of social welfare, their view on finding and deporting illegal immigrants, and their political ideology. To compare TX-18 and TX-12 I will conduct a statistical contrasting of group means between the relevant focus variables of public opinion to try and detect any difference. The appropriate method for such a comparison is a Student’s t-test. This method requires quantitative data; the CCES variables I chose were coded, however, on qualitative scales. For example, the political ideology question has response options such as very conservative, slightly conservative, moderate, slightly liberal, and very liberal. I transformed this instead onto a numeric scale from -2 (very conservative) to 2 (very liberal). I similarly transformed the other variables onto numeric scales or changed them into dummy variables (for example, for the 2016 presidential election vote, I made it a binary variable for if the Respondent voted for the Democrats or not). After this data cleaning and transforming was done, I conducted a Student’s t-test in Rstudio for each of the opinion variables – i.e. I compared the average value for each opinion question between Whites in TX-18 and Whites in TX-12.

Findings

In my analysis I found multiple statistically significant differences between TX-18 and TX-12. Firstly, if we look at political ideology, we see that the average White person in TX-18 is more liberal than their counterpart in TX-12 (a difference of 0.5 points on a scale between -2 and 2), which is a statistically significant difference. Secondly, looking at punitive views concerning illegal immigrants, I found that 34% of Whites in TX-18 agree with finding and deporting illegal immigrants, compared to 56% of Whites in TX-12 (this difference is statistically significant). Thirdly, when observing 2016 voting patterns, I found that 52% of Whites in TX-18 voted Democrat compared to 38% of Whites in TX-12, however, these group values are not statistically distinguishable from one another. Finally, looking at views on social welfare (where the responses range from wishing to reduce welfare to wishing to increase it – on a scale from -1 to 1), I found that Whites in TX-18 were, on average, supportive of expanding welfare, while Whites in TX-12 were, on average, in favor of reducing it (a difference of 0.4 points on the scale, that is statistically significant). Overall, this suggests that the two districts are quite different with respect to public opinion among their White populations.

Discussion

My results are the opposite of what I had originally predicted. Based on Abrajano and Hajnal’s theory, TX-18 should have a White population that is more conservative, more punitive of illegal immigrants, more supportive of reducing social welfare, and votes Democrat less than the Whites in TX-12 – since TX-18 has a much higher foreign born population. However, as discussed, I found the opposite. Besides the voting habits between the two districts, which didn’t carry any statistical significance, TX-18 is exemplary of more liberal positions than TX-12. These findings suggest that perhaps Abrajano and Hajnal’s theory does not apply to TX-18, or perhaps even to urban congressional districts in the Southern, and more conservative, states in general. Further exploration into Southern locales would need to be done to see where Abrajano and Hajnal’s theorem holds regarding Whites’ views that are supposedly dependent on the size of the local foreign born population. One significant limitation of my study is that the CCES dataset only contained 32 observations after I restricted for Whites in TX-18 and 102 observations for those in TX-12. This calls into question the generalizability of my findings to the broader White population of TX-18 and TX-12 and, thus, the difference between the two. Further work would do well to find data sources with more observations in order to ensure the statistical rigor of further studies. In conclusion, White public opinion in  TX-18 appears to be inconsistent with extant scholarship – instead of being more conservative and anti-immigrant they actually demonstrate more liberal and pro-immigrant views, as compared to Whites in an area with a lower foreign born population. This finding bodes well for the state of immigrant affairs and immigration more broadly in TX-18.

VA-07 Public Opinion Analysis

Title Slide

Abigail Spanberger represents Virginia’s seventh congressional district in the U.S. House of Representatives. The district is located in the suburbs of Richmond, VA, and its representative is a member of the Democratic Party.

Map from: https://www.govtrack.us/congress/members/VA/7

Photo from: https://abigailspanberger.com/

Slide 1

My main prediction going into this research was that I would find respondents in VA-07 to be more anti-immigrant than respondents in the rest of Virginia given the district’s Republican lean. In 2013, Casellas and Leal showed that partisanship is the “only consistent factor” that explains voting on immigration legislation in Congress, which really relates to the district’s representatives. However, the link between Republican representatives being anti-immigrant and their constituency is likely that the district favors a Republican representative, thus indicating their anti-immigrant sentiment, as is the case historically in VA-07.  In 2018, VA-07 elected a Democrat, but the district has a long history of leaning Republican with Trump achieving a victory in the district in 2016 by +6 percentage points. In 2014, the district voted out incumbent Congressman and Republican Party leader Eric Cantor in the Republican primary election and eventually replaced him with an even more conservative Tea Party Republican Dave Brat. Perhaps then, with Trump in the White House in 2018, the district felt it could elect a Democrat because without many immigrants in the district, the voters felt their immigration concerns were being addressed by Trump. In addition, with such a small immigrant population, it is likely Spanberger would not betray the constituency’s wishes and support more restrictive immigration policies. Therefore, the districts attitudes on immigration would still be negative and likely more negative than other parts of the state. Also, it is likely that the district’s demographics negatively impact the residents’ immigration attitudes. Given that the greater the immigrant population in an area the less restrictive the policies are (Wong 2017), here the policies are likely to be restrictive given the minority immigrant population, thereby creating an anti-immigrant sentiment in the district. Additionally, as Assignment 2 showed, the district has been becoming less white, and the Hispanic/Latino population has doubled in the last decade. As Rocha et. al (2011) showed, ethnic concerns spark anti-immigrant sentiment among Anglos, which is based on the size of the native-born Hispanic population. Therefore, even though Hispanic/Latinos are still a minority in VA-07, the population increase likely sparked more anti-immigrant sentiment in the district.

Election info from: https://www.politico.com; https://www.newyorktimes.com

Slide 2

I used data from the 2018 Cooperative Congressional Elections Study (CCES) to analyze public opinion around immigration in VA-07 and compared it to the rest of VA. This survey is unique in that it aims to study midterm congressional elections, which in 2018 proved to be pivotal in VA-07 with the election of Abigail Spanberger in such a traditionally Republican district. Therefore, the 2018 CCES is useful for testing my predictions here since it studies attitudes around important issues such as immigration during an important midterm election for VA-07. My first step was cleaning the data to include only potentially relevant variables such as the question numbers from the pre-election questionnaire, Hispanic origin/descent, and race. This took the data from 60,000 observations down to 1,749 in VA and 190 in VA-07, specifically. The top section of this slide shows the question numbers from the pre-election questionnaire with a short description of the policy the question asked if respondents supported or opposed, and the full text is available online in the pre-election survey on Harvard’s Dataverse website. The bottom section of this slide includes the relevant variables I created from the data in order to see what affects support for increased border wall funding in VA. For instance, I made a dummy variable for whether or not the respondent is from VA-07 to see if living in VA-07 makes an individual more likely to support increased border wall funding. The first phase of my analysis though was that for each of the immigration policy questions in the pre-election questionnaire, I studied the percentage of respondents from VA-07 who supported or opposed the policy and compared this to the percentage of respondents from the other VA congressional districts who supported or opposed the policy. I then conducted a logistic regression to see which independent variables affected support for increased border wall funding.

Slide 3

This slide presents the results of my analysis of the support and opposition to the immigration policies asked about in the 2018 CCES pre-election survey. Overall, there is not a great difference between VA-07 respondents’ immigration policy attitudes and those of the rest of Virginia respondents. The greatest difference between VA-07 and the rest of VA came in support for increasing border security by increasing spending to $25 billion and building a wall at the U.S.-Mexico border. 44.1% of respondents in VA-07 supported the policy compared to only 37.4% of respondents in the other Virginia congressional districts. This is interesting given the fact that the percentage of the Hispanic population in VA-07 is a fraction of the white population. Perhaps then VA-07 is a bit more anti-immigrant than the rest of Virginia, but the information here is insufficient to make such a claim. It is likely that when it comes to some policies, like the one here, which Donald Trump has pioneered, VA-07 is more anti-immigrant than the rest of the state. I therefore decided to zoom in on support for border wall funding in order to see what characteristics, or variables, impact respondents’ support for the proposed policy.

Slide 4

Here I show the results of my logistic regression in which I hoped to study if living in VA-07, gender, being Hispanic, being non-white and non-Hispanic, the size of the Hispanic population in respondents’ district, being a Democrat, or being a Republican affected support for increased border wall funding. The only statistically significant variables were gender, non-white and non-Hispanic, Hispanic population in respondents’ districts, being a Democrat, and being a Republican. This then shows that being a man, being non-white and non-Hispanic, the larger the district’s immigrant population, and being either a Democrat or Republican makes respondents more likely to support increased border wall funding. The fact that being a Democrat or a Republican is related to support for increased border wall funding is particularly interesting given the Republican Party’s reputation for being anti-immigrant and the Democratic Party being known as the political party that protects immigrants. A possible explanation for this finding could be that Democrats in VA-07 are more conservative than the overall Democratic Party. This cannot be verified here, but it is a possible explanation and an interesting path to study in future research. A central finding here though is that living in VA-07 is not a significant predictor of support for increased border wall funding, and therefore, my original prediction cannot be supported in full. The regression shows that living in VA-07 does not make a person more anti-immigrant, at least on the issue of border wall funding, but based on the percentage of respondents in VA-07 who supported/opposed various immigration-related policies, especially border wall funding support, respondents from VA-07 do tend to be slightly more anti-immigrant than the rest of the state. Perhaps this is due to the ethnic concern based on the percentage of the population that is Hispanic/Latino. The regression shows that the greater the percentage of the population in a district that is Hispanic/Latino, individuals are more likely to support increased border wall funding. While the Hispanic/Latino population in VA-07 is small, it is larger than about half of the other districts in the state, and its growth over the last decade could have sparked ethnic concerns and in turn anti-immigrant sentiment. Considering all of this, it is clear then that Spanberger should continue to be the quiet immigrant-rights supporter she has been since entering the U.S. House of Representatives in January. Given the Republican lean of the district which corresponds to the greater percentage of respondents who supported increased border wall funding, this is the best approach for Democrat Abigail Spanberger to support immigrants while protecting her seat.

Honor Code:

This assignment represents my own work in accordance with University regulations. – Morgan Bell

NY-14 Media Content Analysis

Intro Slide

NY-14 is currently represented by Alexandria Ocasio-Cortez.  On the right, she is pictured protesting the Trump administration immigration policies and child detention in Texas.

Slide #1

Congressional District NY-14 has a high, non-native, non-white population.  21.6% of residents are naturalized foreign-born citizens, while 25.4% are non-U.S. citizens.  By racial demographics, the district is comprised of 47.7% Latinx, 18% Asian, and 11.1% Black constituents.  Academic literature suggests that, because of the high proportions of minority groups, NY-14 will have resources available to improve lives of immigrants.  Specifically, Abrajano & Singh (2009) found that, when available, Spanish television news sources are statistically significantly more positive when speaking about immigration topics than their English counterparts.  Because of NY-14’s high minority population, the current study hypothesizes the following: H1) that the local Spanish daily newspaper will be more positive towards immigration than the local English daily newspaper; H2) that the Spanish coverage will focus more on humanitarian aid than the English source.  These hypotheses are grounded in the research by Abrajano & Singh as more positive coverage may imply more focus on humanitarian aid rather than partisanship issues and border security.

Slide #2

One hundred articles were collected from each of the two local news sites — El Diario (Spanish) and the Daily News (English) —  from the period of December 11,2018 – January 31,2019, coinciding with the government shutdown.  An article was collected if it contained any of the following words: immigration, immigrant, border, wall, shutdown, security, or undocumented (English); or inmigrante, muro fronterizo, inmigración, muro en la frontera, indocumentado, indocumentada, al cierre del gobierno, or seguridad (Spanish).  Perfect translations for the Spanish terms often did not exist and needed to be constructed by a phrase or were necessarily extended to multiple genders if an adjective.  In order to specify key terms and date ranges, articles were scraped by a Python script through Google News.  The scrape was limited to 100 articles in each language due to a lack of computational power.  To complete the analysis, word sentiments were obtained through the NRC Word-Emotion Association lexicon, which provides positive-negative ratings and emotional connotations of words in over 100 languages based in the original English lexicon.  In order to determine article focus in categories of Partisanship, Security, and Humanitarian Aid, two words (pictured on the bottom right) were chosen for each category that acted as signals for article content.  As with the search terms, “Republican” was necessarily extended to “Republicano” and “Republicana” to account for gendered adjectives in Spanish.

Slide #3

Two-sample t-tests were run on the English and Spanish article content to determine if one source used more positive or negative language in speaking about immigration. Both sentiments were tested because positivity and negativity are not necessarily mutually exclusive since many words in the lexicon are not associated with either sentiment and some words may carry both connotations.  Results did not show a significant difference between sentiment values, so the null hypothesis that the language sources are not different in sentiment cannot be rejected and H1 is inconclusive.  Graphs are pictured on the right, which show the top words used in each language for each sentiment.  Although it is not a statistical test and general conclusions cannot be drawn, the results are interesting to interpret.  For example, both language sources heavily used “government” and “president,” but English positive words center around money and resources, while the Spanish words are about agreement and personal security (“Seguro”, “casa”, “construir”).  Visualizing the top used words also helps identify the limitations of this analysis and the NRC lexicon in particular.  “President,” for example, while generally a positive term, could easily be seen as negative or neutral in the situation of the shutdown, depending on the political beliefs of the human interpreter.  Likewise, “cierre” in Spanish is classified as positive; however, it means “closure,” which is not positive in the context of immigration. It is also interesting, and perhaps problematic in this context, that “white” is heavily used in the English source and that it is classified as positive.  Future research should address these limitations by compiling an emotion lexicon specific to immigration through mass polling to avoid researcher bias.

Slide #4

Articles were classified into each focus by examining which category had the most terms per article. For example, if an article had 30 Security terms, and only 10 each of Partisanship and Humanitarian Aid, it was classified as a Security article.  Two-sample t-tests were also run to determine focus of each language. Although the three categories are mutually exclusive, all three tests were run to determine which focuses were preferred, if any, in each language.  There was no significant difference in Partisanship classification between sources; however, a significant difference was shown for both Security and Humanitarian Aid.  El Diario articles were shown to be classified as Security at a statistically significantly higher rate than The Daily News articles.  Dissimilarly, El Diario articles were classified as Humanitarian Aid focus at a significantly lower rate than The Daily News.  These results hold even after applying a Bonferroni correction (m = 5, for each sentiment and focus test; p < 0.01). That said, as pictured on the right, the English articles contained more focus terms for each category in general, with the average English article containing 8.48 Partisanship terms as compared to Spanish articles at 1.4 terms per article.  These results are similar across focus categories as seen in the graph. This difference may be due, in part, to imperfect translation of the terms.  Although they were directly translated using crowd-sourced translation service (Linguee) and researcher language experience (Advanced Proficient), a direct translation may not have been appropriate in this instance, because the language may use other terms to signal the focus categories.  Future research should consult native Spanish speakers and Spanish news writers to adequately translate focus terms.

Media Content Analysis CA-53

My media content analysis was approved to be slightly different than others’ analyses in the class because I had one local source and two issues I was particularly interested in: one local and one national. I compare media’s coverage and tone of the migrant caravan issue (local) with coverage of the government shutdown (national).

The caravan and shutdown have different areas of impact, and the caravan’s local influence lends it to being representative of a local issue while the shutdown represents an issue not specific to CA-53 constituents. Note that this assignment is not meant to say that the shutdown does not affect CA-53 constituents. However, it should be emphasized that the caravan attempted to cross at the San Ysidro crossing and therefore directly and specifically affects San Diegans. In this experiment, I explore the impact of the local/non-local impact on media’s sentiment when considering the portion of the conversation that relates to immigration. Given CA-53’s proximity to the border, reporting on immigration is plentiful which is supported in the literature as well as empirically by the 10,000+ articles related to immigration published by the San Diego Union Tribune (SDUT) from the start of 2018 up until March of 2019. Both hypotheses are relevant to CA-53 based on proximity to the border (H1), demographic change (H2), increasing Hispanic population (H2), and increasing immigrant population (H2). My thought process behind both hypotheses is that the media about the caravan will elicit a media presence and sentiment more directly about the community, while the media about the shutdown will elicit a more general response.

H1: CA-53 is located very closely to the Mexico/US border and increased proximity to the border indicates increased reporting (Branton et al. 2009). I anticipate immigration will be more heavily reported when the issue being reported is local.

H2: CA-53’s demographics have been shifting towards increased Hispanic and immigrant populations, therefore I expect tension. (Enos 2014 & Adida et al. 2018 & Hopkins 2010). I hypothesize the tension will be felt stronger when the issues are local: there will be a more negative sentiment around immigrants in the caravan articles than in the shutdown articles.

My media-content analysis is similar to that of my classmates because I look at the difference between local/national but I separate locality by topic being reported and others separate locality by news source. Holding the news source (SDUT) and time frame (1/1/2018-3/1/2019) constant, I compare the subsets of articles that talk about a local immigration concern — migrant caravan – and a national issue — government shutdown. I use the keywords “caravan” to create the caravan subset and “shutdown” to create the shutdown subset. I use “immig!” within both subsets to identify the amount of articles that pertain to immigration. Within these narrowed subsets that include ‘immig!” I identified the ones that are negative (process described shortly below). I compare the subsets on two dependent variables: salience and tone. I operationalize salience by comparing the proportion of immigration articles published within the given parameters on each topic and look for a significant difference between the two. I operationalize tone by utilizing the LexisNexis Negative News feature to identify how many of the articles in each subset are classified as negative. The Negative News classifier was built to specifically identify news articles that displayed significant negative tone and language, and is likely more comprehensive than any handful of keywords to indicate tone I could create. One classifier method I attempted was to utilize the “Dictionary with opinionated words from the Harvard-IV dictionary as used in the General Inquirer software” which I had scraped and put into LexisNexis as “or” terms, but there were too many terms entered for the search to run. Therefore LexisNexis’ classifier is likely more effective because it runs within each search rather than as individual search terms and subsequently allows the classifier to take more terms into consideration as well as more complex linguistic patterns.

The Results slide communicates the size and relevant features of each subset described in the table. The information from this table is used to conduct the significance test. I use a proportion test to evaluate whether there are significant differences between proportion of articles including immigration content (H1) and negative tone in articles including immigration content (H2). The proportion test (prop.test in R) is the appropriate test because the data is binary: either an article falls into a category or it does not. Prop.test takes in a contingency table as a matrix comparing binary outcomes between two groups and indicates the significance of the difference between the groups. The matrices needed for prop.test can be seen in the code chunk screenshots included for each hypothesis in the slide.

In more detail, here is how I translated the media information for H1 into a contingency table (understood as a matrix in R):


H1 <- matrix(c(117, 63, 96, 153), ncol=2)

colnames(H1) <- c(‘Caravan’, ‘Shutdown’)

rownames(H1) <- c(‘Immigration’, ‘Non-Immigration’)


The proportion test can be carried out with the following code:

H1.results <- prop.test(H1)

H1.results

The p-values of both proportion tests were <0.05 indicating evidence in favor of rejecting the null hypotheses, which is that there was no difference between salience (H1) and tone (H2) of the groups.

My experiment indicates support for the existing literature, specifically Branton et al., Enos, Adida et al., and Hopkins by supporting that local topics in media seem to produce reporting that reflects the local population’s immigration sentiments. Limitations, as mentioned in the slide, mostly have to do with the caravan:local :: shutdown:national connection. Especially when looking at salience, the caravan issue was almost exclusively an immigration issue while the government shutdown was an immigration issue as well as an abuse-of-power issue, representation issue, etc. So it could be argued that to measure salience by (immigration & caravan)/caravan is flawed because more articles will overlap between immigration and caravan than immigration and shutdown just by sheer content difference. However, I think if that were true then more than 65% of caravan articles would mention immigration, so more than immigration implications of the caravan were discussed. Nevertheless, the caravan could be replaced with any other slightly immigration-related local topic and the hypotheses’ conclusions should ideally still hold. By immigration-related I mean that using something like “charter school opening” or “local gas leak” would not be logically appropriate because they are too far removed from the immigration conversation for the lack of immigration salience to be meaningful. For future work I recommend comparing the tone regarding the migrant caravan between English and Spanish publications in San Diego. I could not find a Spanish publication with an online article archive to support this direction. I anticipate the difference between English and Spanish publications on such an immigration-salient issue to be very different in tone for a variety of reasons (authorship, audience, etc).

Despite possible limitations, the experiment indicated that local issues likely have higher proportions of immigration coverage and this immigration coverage likely has more negativity than non-local immigration coverage.


PA 4 Media Content Analysis


I have three hypotheses concerning immigration support, population and the media based on the data I collected. My first hypothesis (H1) is that there will be more immigration support in The Times Herald than in Montgomery Media—both newspapers within PA district 4. The Times Herald circulation base is centered in Norristown, while Montgomery Media circulation focus is all of Montgomery County (The largest county covered by PA 4). I argue the comparatively high Hispanic population in Norristown (26.6%) vs. PA 4 as a whole (14.1%) will lead to The Times Herald having greater pro-immigration support. Areas with higher percentage of Hispanic populations are often found to have greater immigration support (Wong 2014). In addition to having a higher percentage Hispanic population that would predict increased immigration support, urban centers in general are found to be more accepting of racial diversity than rural areas (BURNS & GIMPEL, 2000). Because Norristown is much more urban than some of the farmland in other areas of PA 4, I postulate that there will be more immigration support and racial acceptance. Both of these factors will lead to increased immigration support in a newspaper from Norristown compared to one from all of Montgomery County. All of these claims are based under the assumption that the local newspaper will mimic the local population’s opinion, which, although plausible, may not necessarily be true.


My second hypothesis (H2) is that Montgomery Media will tend to use the Economic Consequences frame more often than The Times Herald. If H1 is found to be true, and since partisanship is the greatest predictor of immigration support (Casellas and Leal 2013; Wong 2014), then residents of the entire county may be more conservative/Republican than those of Norristown. Republicans were found to value the outcome of the economy more than Democrats (Partisan Differences on Importance of Issues, 2019), so Montgomery County will give the economy more weight. Again, this is based on the assumption that local newspapers represent the views of the residents in that region.


The third hypothesis (H3) is that The Times Herald will use the human interest frame more often than Montgomery Media. If The Times Herald is found to be more supportive of immigration than Montgomery Media from H1, they will be more likely to discuss immigration in a positive tone. The human interest frame is often found to be more positive in tone than the other frames (Price et al. 1997). Based on this, The Times Herald should use the human interest frame more often than Montgomery Media.


I utilized the methodology in Jeesun Kim’s and Wayne Wanta’s paper on news framing (Kim and Wanta, 2018). They coded for year of publication, article type, news frame, overall tone, and publication location (Kim and Wanta 2018, 100). Their methodology was utilized specifically because they employed “generic frames,” which are well researched, and also are more comparable to other studies (e.g., Gitlin, 1980; Tuchman, 1978 as cited in Kim and Wanta 2018, 92). In the coding category of news frame, Kim and Wanta looked for four major frames: conflict frame, human interest frame, responsibility frame, and economic consequences frame (Kim and Wanta 2018, 92). Each of the frames is defined as follows (Kim and Wanta 2018, 93-94):

“Conflict frames focus on conflict between individuals, groups, or institutions (Neuman et al., 1992) in order to capture audience interest” (Semetko & Valkenburg, 2000 as cited in Kim and Wanta 2018, 92).

“The Human Interest Frame uses an individual’s story or an emotional angle to describe an issue, event, or problem” (Valkenburg, Semetko, & de Vreese, 1999 as cited in Kim and Wanta 2018, 93).

“Responsibility Frame describes an issue or problem in a way to attribute responsibility for causing or solving a problem to the government or to an individual or to a group” (Iyengar, 1987; Valkenburg et al., 1999 as cited in Kim and Wanta 2018, 93).

“The Economic Consequences Frame emphasizes the economic effects of actions or events on individuals, groups, or nations” (de Vreese, Peter, & Semetko, 2001; Valkenburg et al., 1999 as cited in Kim and Wanta 2018, 94).


In addition to the amount of reference, I modified Kim and Wanta’s (2018) methodology by assigning number values to article tone. A “1” value means that the article is pro-immigration, a “2” value means the article is neutral or mixed, and a “3” value means the article is anti-immigration.


All of the data collected followed the specific guidelines given for the “Media Content Analysis” assignment. The article dates were between Dec 11, 2018 and Jan 31, 2019. The keywords used were: “Immigration,” “Immigrant,” “Border,” “Wall,” “Undocumented,” “shutdown,” and “security.” The articles that contained more than one term were only counted once. As mentioned before, both the focus and tone were analyzed.


After doing the proposed media analysis following the methodology and guidelines, the results were mostly expected. Montgomery Media had more neutral and anti-immigrant articles (9.09% and 54.55% respectively) than The Times Herald (4.35% and 34.78% respectively). The Times Herald has a more pro-immigration stance (60.87%) compared to Montgomery Media (36.36%). Montgomery Media also had more economic (27.27%), conflict (18.18%), and human interest frames (18.18%) compared to The Times Herald (21.74%, 17.39%, and 17.29% respectively). The only frame that occurred more in The Times Herald was responsibility (43.48%), with Montgomery Media only using it 36.36% of the time. There were 11 articles examined from Montgomery Media and 23 articles examined from The Times Herald that matched the keyword search terms outlined for the assignment.


After examining the results, H1 appears correct. The Times Herald had less anti-immigration sentiment (19.77pp margin), and more pro-immigration sentiment (24.51pp margin) than Montgomery Media. As mentioned previously, there is a substantially higher Hispanic population in Norristown (26.6%) than in the entirety of PA 4 (14.1%). An increased Hispanic population is associated with increased immigration support, so the results logically follow (Wong 2014). Additionally, urban centers are more likely to accept racial diversity than rural areas (BURNS & GIMPEL, 2000). Because Norristown is much more urban than all of Montgomery county, this finding is also in line with the media analysis data seen here.


H2 also appears to be correct because Montgomery Media used the Economic Consequences frame more often than The Times Herald (5.53pp margin). Partisanship is often the best predictor of immigration support (Casellas and Leal 2013; Wong 2014). Because The Times Herald was more supportive of immigration, it follows that they are more likely to be Democratic than Montgomery Media. In general, Republicans value the outcome of the economy more than Democrats (Partisan Differences on Importance of Issues, 2019). If Montgomery Media is more likely to be closer to Republican than The Times Herald is, they are also more likely to value the outcome of the economy more. This theory seems to be supported by the evidence gathered.


H3 appears to be incorrect. Although they were close to equal, The Times Herald used the human interest frame less often (.89pp margin) than Montgomery Media. One possible reason for this incorrect hypothesis is that both regions are majority non-Hispanic white. Because of this, they may not have a strong personal identity with the individual story of a particular Hispanic immigrant. Although these stories may be convincing to some, lacking a personal connection with the subject could make for a less convincing argument. The authors could have taken this into account and instead utilized the responsibility frame which The Times Herald used more frequently than Montgomery Media (7.12pp margin). The responsibility frame could focus on a more generally applicable and relatable argument for immigration—taking public good and general moral responsibility into account. Although this is one possible causal explanation, there is no definitive singular reason as to why The Times Herald and Montgomery Media did not fit within the predictive literature.


There are also ways to improve this experiment in the future. Because of the sample size difference (n=11 for Montgomery Media and n=23 for The Times Herald) we should cover a wider time period selection to see if the observed trends remain. Although H1 and H2 were both found to be true, the results would be strengthened utilizing a longer term approach to media analysis with both larger n values and also information on how the data trends over time.


Newer posts »

The McGraw Center for Teaching and Learning
328 Frist Campus Center, Princeton University, Princeton, NJ 08544
PH: 609-258-2575 | FX: 609-258-1433
mcgrawect@princeton.edu

A unit of the Office of the Dean of the College

© Copyright 2025 The Trustees of Princeton University

Accessiblity | Privacy notice