Category: Assignment 3 (page 3 of 4)

NY-9: Media Analysis

…..

Slide 1:

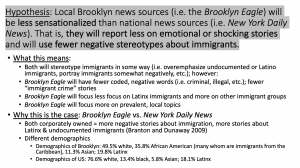
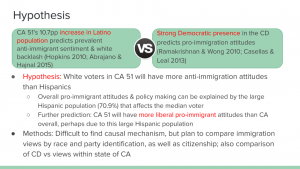
News sources will display their bias in two different ways: agenda setting and framing. Agenda setting means that news sources will give some problems more attention than others, and framing means that a story will be reported on in a biased way, through stereotyping/group imagery and tone of the coverage (Abrajano and Hajnal 2015). In this media analysis, I compared the news coverage of the Brooklyn Eagle, a corporately owned, local news source for Brooklyn, against New York Daily News, a corporately owned, national news source based in New York City. My hypothesis is that, while both news sources will to some extent stereotype immigrants (as they are both corporately owned), since the Brooklyn Eagle is a local news source, there will be more articles focused on issues prevalent to the local population, and the articles as a whole will strike a less negative tone when talking about immigrants. I believe this will be the case because, according to existing research, the media’s reporting of immigration (or any other subject) is based largely off of how well the news can sell. The first part of my hypothesis is based off of the fact that both news sources are corporately owned: according to Branton and Dunaway, “corporately owned organizations are expected to produce more stories focusing on Latino immigration, illegal immigration, and the negative aspects of immigration than privately owned media organizations.” This is probably due to the fact that corporately owned organizations are reliant on public ownership and therefore public opinion, whereas privately-owned organizations have more leeway in their article topics. For national news sources, however, this bias becomes even more apparent. Even with news sources that lean liberal (for example, Abrajano and Hajnal look at The New York Times), national news sources will often resort to using certain stereotypical, well-known themes, like suggesting that all immigrants are Latinos, or using “crime news scripts” with nonwhites (Abrajano & Singh 2009). There are several other ways the Brooklyn Eagle and the New York Daily News will differ. First, there will be differences due to the huge demographic differences between Brooklyn and the United States: while Brooklyn is majority nonwhite (~49.5% white), the United States is major white (76.6% white). Brooklyn also has large immigrant enclaves: in my district, for example, there is a large immigrant Afro-Caribbean population. I would therefore expect 1) less stereotypical “threat narratives” or “crime narratives,” because using them would alienate the local immigrant readership and 2) less focus on Latinos and more focus on other groups of immigrants in order to relate more with the local immigrant readership. Finally, since local news is aimed towards a much smaller group of people, the news will be more focused on the effects of immigration policies on their own district/region. National news outlets, on the other hand, have to find universal ways to relate to the audience they are trying to reach. National news will therefore be more focused on topics like federal politics or the overall situation of immigration at the border.

…..

Slide 2:

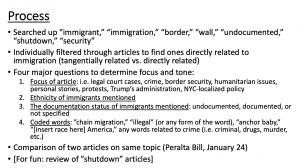
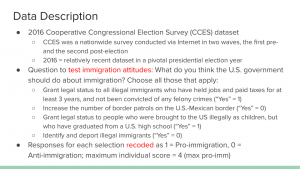
First, I used the key terms “immigrant,” “immigration,” “border,” “wall,” “shutdown,” and “security” to look up articles about immigration. I then went through each article and filtered through them to see how related to immigration the article was: I labeled the articles “tangentially” related to immigration (i.e. only mentioned the word “immigrant” or “immigration,” but the subject of the article was on something else completely), or “directly” related to immigration (i.e. the subject of the article was immigration). The “tangential” category was interesting to me, because it demonstrated that the newswriters were simply using “immigration” or “immigrant” as a buzzword within their articles because they thought it was a hot topic (i.e. the word “immigration” was often used without any elaboration). I ultimately eliminated the “tangential” articles from the rest of my study, however, because they weren’t very useful. Going through the “directly” related articles, I came up with a list of five key questions, and I will explain the reasoning behind each question:

  • What is the focus of the article?: The focus of the article is related to the “agenda-setting” part of news coverage. What the news source decides to focus on is largely related to what the media source already expects its audience to think about immigration. I broadly separated articles into 7 categories: NYC-based policy (I expect local news sources to report more on this), court cases, crimes (the prevalence of this especially would demonstrate anti-immigrant bias), border security, humanitarian issues, personal immigrant stories, protests, and commentaries on the Trump administration.
  • What is the race/ethnicity of the immigrant(s) mentioned? (i.e. country of origin, Latinx, etc.): Americans tend to associate immigration strongly with Latinx immigration (Abrajano and Hajnal 2015). By looking at the prevalence of Latinx immigrants mentioned, we can see whether the news source is feeding into this narrative. This is also another form of agenda-setting.
  • Are the immigrants mentioned legal or undocumented?: Similar to the above, Americans tend to associate immigrants (specifically Latinx immigrants) with undocumented immigrants (Abrajano and Hajnal 2015). If the news source chooses to report mostly on undocumented immigrants, this is also another form of agenda-setting.
  • How many coded words? The coded words I looked for were: “chain migration”; “illegal” (or any form of the word, like “illegally”); “anchor”; “[insert color here] America”; words related to crime (i.e. criminal, drugs, etc.): Through these coded words, one can ascertain the general tone of the article. One of the easiest ways to determine whether the news article is biased is to see whether they use the word “illegal” versus “undocumented.” I was very cognizant about this throughout my analysis.

Additionally, there was an article in the Brooklyn Eagle and the New York Daily News that covered the same event: the passage of the Peralta Bill that helped DREAMers acquire state aid for higher education. I was directly able to compare these two news sources to see if either the Brooklyn Eagle or New York Daily News had any differences in focus or tone in their reporting. Finally, just for fun, I filtered through all the articles about the shutdown to see how many talked about immigration.

…..

Slide 3:

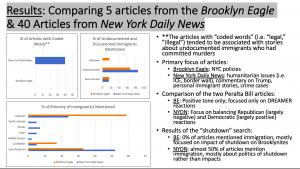
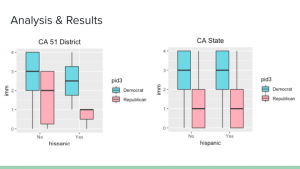
I ended up pulling 5 articles from the Brooklyn Eagle (because in this period of time, there were only 5 that mentioned immigration) and 40 articles from New York Daily News. Due to the different number of articles, in order to better compare the two news sources, I used percentages instead of count. For example, when I was measuring documentation, I found the percentage of how many immigrants were undocumented out of the immigrants mentioned across the articles. Using the aforementioned tests, therefore, I acquired the following findings: first, the Brooklyn Eagle as a whole mentioned immigration less. Less than 1% of the articles published during the shutdown were related to immigration. Indeed, none of the actual articles about the shutdown (i.e. when I searched up “shutdown”) were related to immigration at all: they all instead had to do with the problems that members of the district were facing due to the shutdown. On the other hand, New York Daily News published about 4% of its articles about immigration. Indeed, out of the articles about the shutdown, about 40% mentioned immigration at least tangentially (I ultimately eliminated these articles when I tested my four questions). Second, the focus of the articles was different. The Brooklyn Eagle published most (60%) of its immigration-related articles on local, NYC policies, whereas New York Daily News published about 28% of its articles on humanitarian issues (focused on ICE and border problems), followed by 16% commenting directly at Trump, and 12.5% for personal immigrant stories (i.e. following an individual immigrant’s journey) and crime cases. The prevalence of these crime cases was largely correlated to the number of “coded words.” About 40% of the New York Daily News articles used “coded words,” whereas 0% of the Brooklyn Eagle articles used them. Every single one of the crime case articles used the word “illegal” to describe the undocumented immigrants. Third, both news sources focused a large amount of their coverage on Latino and undocumented immigrants. 66% of the immigrants mentioned in the Brooklyn Eagle were undocumented and 33% were Latino; 85% of the immigrants mentioned in New York Daily News were undocumented and 52% were Latino. It should be noted that around 60% of the immigrants from Brooklyn Eagle were of unknown ethnicity, and 17% were Caribbean-American. Finally, in directly comparing the article about the Peralta DREAM Act against each other, we can see several differences: first, the Brooklyn Eagle spent much more time talking about Peralta himself. This is probably due to the fact Peralta served directly for NY’s State Assembly, but it’s interesting how the article delves into Peralta’s background (as a Dominican-American immigrant) whereas the New York Daily News only mentions him very briefly. I extrapolate that the focus on his Afro-Caribbean background in the Brooklyn Eagle could have pandered towards readers in the large ethnic/immigrant enclaves. Second, the Brooklyn Eagle only focused on the responses of the DREAMers, and therefore the tone was largely positive and pro- the Peralta Bill. On the other hand, New York Daily News spends half the article reporting on conservative viewpoints of the bill, all of which are largely negative.

…..

Slide 4:

According to my results, my hypothesis was mostly correct. Both news articles did fall into the trap of talking extensively about undocumented and Latinx immigrants, demonstrating sources bias in their reporting. However, the Brooklyn Eagle did report on some Caribbean-Americans, and thus was more representative of Brooklyn’s demographics. This suggests that local media is impacted by the makeup of the population. On the other hand, New York Daily News was not representative of either New York or the United States, suggesting that it relied on the idea of the stereotypical immigrant (i.e. Latinx, undocumented) in order to grab its reader’s attention. In addition, the Brooklyn Eagle focused much more on the local effects of immigration policy (that is to say, it was more focused on how federal immigration policy affected local residents, and it was more focused on local immigration policy), whereas New York Daily News was more focused on emotional or shocking national news (i.e. stories of families being ripped apart at the border, crimes committed by undocumented immigrants). This demonstrates that national news sources tend to be more sensationalized than local news sources. Additionally, while New York Daily News used a significant amount coded words, published immigrant crime stories, and used quotes from anti-immigrant natives, the Brooklyn Eagle did none of this. All this contributed to a more prevalent negative tone about immigrants in New York Daily News that was not apparent in the Brooklyn Eagle, again indicating greater sensationalizing in the national news source. Finally, the comparison between the two articles about the Peralta Bill most clearly reveals the difference in focus and tone between the two news sources. First, the ethnicity of the immigrants mentioned in the two articles is different. The Brooklyn Eagle mentioned Dominican-American and Argentinian-American, while New York Daily News mentioned a Mexican-American. This difference indicates the pandering towards the Caribbean-American audience for the Brooklyn Eagle. New York Daily News, on the other hand, pandered towards a wider audience by stereotyping undocumented immigrants; indeed, it’s especially prevalent that they chose a Mexican-American rather than another ethnicity. Second, the tone in the Brooklyn Eagle is positive (as they only used interviews from DREAMers and supporters of the bill), whereas New York Daily News has a neutral and almost negative tone (as they heavily relied on interviews from conservatives and people who did not support the bill). In all, therefore, the Brooklyn Eagle focused more on news that related to its local population and reported on immigration in a more favorable light. New York Daily News, on the other hand focused on sensational stories and reported on immigration, as a whole, more negatively. Before I conclude, I would like to address some sources of error. First, I understand that five articles is an extremely small sample size; however, local news sources (the Brooklyn Eagle as well as other Brooklyn-specific news sources I looked at) simply did not tend to cover immigration to a large extent. Nevertheless, the fewer articles made it harder to compare the two news sources. Second, I may have improperly sorted through articles. I discarded many articles that only tangentially mentioned immigration; however, I understand that my own bias may have affected this. Third, New York Daily News is also a New York-based source; as such, I’m not sure to what extent it distributes to NYC. I emailed them to ask about this, but I never got a response. Seeing as New York is about 27.5% Latinx, however, if New York Daily News does distribute extensively to NYC, this may partially explain the prevalence of reporting on Latino immigration. Finally, because we were looking at a time period when the border-wall-induced shutdown was happening, the news articles definitely chose to spend more time talking about Latinx and undocumented immigrants at this time; it would be interesting therefore to look at another period of time to see if the things I observed still hold true. To end, if I were to continue my research, besides looking at a different time period, I would want to look more at the crime narratives put forward by the New York Daily News: it was very clear in those articles that the writer was trying to distinguish “bad” immigrants (i.e. the criminals) and “good” immigrants (i.e. the documented cop killed by the undocumented immigrant). It was especially in these articles that the undocumented immigrants were referred to as “illegal” (indeed, these were the only articles in which the undocumented immigrant was called “illegal” every time). In other articles, the author tries to distinguish between bad undocumented immigrants and the majority of good undocumented immigrants. This was very interesting to me: it seems like, for conservative news sources, the split for “good” immigrants is very clear—documented immigrants are “good,” and undocumented immigrants are “bad.” For liberal news sources, this distinction is much more difficult to ascertain, and I would like to look further into this.

Asian Immigrants in CA-19: Assessing Cultural and Political Integration

Slide 1:

The existing demographic conditions of CA-19 make it an interesting place to study Asian immigration in particular. CA-19, or its corresponding geographical area, is almost evenly split between Asians (30%), Hispanics/Latinx (40%), and Whites (30%). Changes to this population from 2012 to 2017 have been small: since 2012, the Asian population has grown by 2.4 percentage points, while the Hispanic/Latinx population and White population has shrunk by 1.2 percentage points. Since 2012, meanwhile, the size of the foreign-born population has shrunk by one percentage point. In general, however, CA-19 is notable for its large foreign-born and Asian populations, shrinking White population, and overall consistency, with little demographic change. Meanwhile, there is much existing literature on Asian immigration and integration. Abrajano and Hajnal (2015) find that if an Asian population is significant, support for immigration from the native-born population increases. Rapid growth of an Asian population, however, may induce hostility against immigrants: Hopkins (2010) finds that when an Asian population expands quickly, attitudes towards the population also become more negative. Aptekar (2008) argues that though Asians are more readily integrated into society, even in places where they are prominent, they find difficulty being represented or integrating in politics. The literature suggests, therefore, that when an Asian population is large, Asian immigrants may integrate into society, but face difficulty achieving political integration. When an Asian population is rapidly expanding, however, neither cultural nor political integration is likely. Through qualitative interview collections, I plan to gauge Asian immigrant integration into politics and society in CA-19. I predict that, as the conditions and existing literature suggests, the large size of CA-19’s Asian population will allow Asian members of the community to be fully integrated into society. Though growth of an Asian population may play a role in increasing hostile attitudes regarding immigration, since CA-19 has seen very little change in its Asian populations in the last five years, hostility against immigrants may not manifest in CA-19. Despite their social and cultural integration, however, I predict that Asian immigrants of all nationalities in CA-19 will not be fully politically integrated or have their interests represented in politics. Aptekar (2008) does introduce the caveat that Asian Indians are more likely to be or have their interests represented in politics than Chinese immigrants; thus, I expect to find that Indians in San Jose may feel both culturally and politically integrated where other Asian immigrants only experience cultural integration.

Slide 2:

To test my prediction, I decided to interview first-generation Asian immigrants living in San Jose regarding their perceptions of their own political and cultural integration. I recruited interview subjects by asking friends and family in-person and through social media (a non-random process) and interviewed subjects over either phone or email, depending on the subject’s availability and comfort. Two interviewees opted for email so that they would have more time to answer the questions. In total, I interviewed three subjects, all of differing ages, backgrounds, and nationalities so as to provide more comprehensive data. Respondent 1 is a 20-year-old Korean male who is currently attending college in San Jose and has lived in the city for 15 years with his family. Respondent 2 is a 50-year-old Indian female who moved to San Jose 22 years ago to establish a high-tech startup with her husband. Respondent 3 is a 63-year-old Chinese female who has lived in San Jose for 26 years and currently works as a part-time accountant. Interview questions were split into three categories: Background, Political Integration, and Cultural Integration. Below is a full list of the questions asked.

Background:

  • How old are you?
  • What do you do for work/school?
  • Are you a citizen?
  • How long have you lived in your community?
  • Why did you choose to live in your community?

Political Integration:

  • Did you register to vote?
  • Did you vote in your most recent state, presidential, and county-level elections?
  • Are you affiliated with one of the two major political parties? If not, why?
  • If you are party-affiliated, how well do you think the party you support represents your interests?
  • Do you feel that your interests are represented in politics? How so?
  • What are the most important political issues to you?
  • Are you engaged in any political activities outside of voting (ie volunteering for campaigns, donating to candidates, fundraising or advertising, conversations with friends and family about politics)?
  • How often do you talk about politics with friends and family? (Frequently, once in a while, not at all)

Cultural Integration:

  • How would you define your community?
  • How diverse is your community?
  • How safe or comfortable do you feel in your community?
  • Does your community provide support or organizations for you or people like you?
  • Do you socialize with people from different races outside of work/school?
  • Would you say you feel “American” (that you associate with your national identity) or do you think your ethnic identity is more salient for you?
  • Do you feel that there is a specific Asian subculture in your community, or are Asians an equal part of a larger culture in your community?
  • Do you feel that immigrants of other races can easily assimilate into your community?
  • Have you ever been called racial slurs or by any derogatory names?
  • Have you felt discriminated against on the basis of your race/ethnicity?

Slide 3:

All three respondents were politically integrated in that they either voted or participated in political activities outside of voting. Respondents 2 (Democrat) and 3 (Independent) voted in all recent elections, while Respondent 1, as a DACA recipient, could not vote but participated in political activities (i.e. campaigning and fundraising for the Democratic Party). As García and Casteñon (2018) and Andersen (2008) explain, the act of voting or participating in politics can mark political integration into a society. In this regard, therefore, all three respondents were fairly politically integrated. All three respondents felt, however, that their interests were not represented by their party or in politics generally. Respondent 1 reported that he felt the Democratic Party to be fairly split on issues important to him, such as immigration, LGBTQ+ rights, and workers’ rights. Respondent 2, meanwhile, felt that the Democratic Party had no well-executed, comprehensive position on immigration, women’s rights, or data privacy, the issues most important to her. Respondent 3 felt that no political party was able to adequately represent her positions on healthcare reform and gun control, the issues most important to her. Aptekar (2008) writes that one measure of integration is interest articulation and representation; in this regard, therefore, the Asian immigrants interviewed were not politically integrated. In regards to the second portion of the prediction, respondents were culturally integrated in that they all spoke English and were either in college or employed in skilled professions. Some possible measures of cultural integration, as explained by Andersen (2008) and Waters and Gerstein Pineau (2015), is English language acquisition, educational attainment, and skilled, gainful employment, all of which all three respondents possessed. Respondents also felt that there were many organizations in San Jose that assisted in cultural integration while pushing back against total assimilation. Respondents 1 and 3 mentioned Korean and Chinese schools in the area that helped to teach young children the language and culture of their respective countries; these schools operated only on the weekends so that they would not conflict with “regular” school, thereby impeding language acquisition or educational attainment. Respondent 2, meanwhile, mentioned Indian community centers that hosted networking events and job fairs to promote employment in the area while also hosting Bollywood stars, classical music classes, and Holi festivals to encourage cultural preservation. De Graauw (2013) explains that immigrant advocacy and cultural organizations are often highly important in integrating immigrants into their host community while helping to preserve their culture, and all three Asian immigrants interviewed felt that these organizations had been helpful in that regard. They felt very much a part of the San Jose community and consciously identified themselves as “American” through their education, employment, and values systems, but were also very aware of their ethnic identity and felt as if they were part of an Asian subculture within the larger body. A final indicator of cultural integration was that all respondents felt that San Jose was very diverse, with high levels of socialization between people of different races, and was non-discriminatory towards immigrants in general. Given that all respondents felt welcomed and not targeted for their Asian immigrant status or racial identity, there seems to have been minimal native-population backlash against Asian immigrant populations and a welcoming attitude towards cultural integration, as Abrajano and Hajnal (2015) predicted.

Slide 4:

The results found through the three interviews generally supported the initial predictions. Political integration of the interviewed Asian immigrants was limited, given that all three respondents voted or participated in politics on a regular basis but still felt as though their interests were not well-represented in politics. Culturally, however, all three respondents were well-integrated, given their educational attainment, language acquisition, employment status, acknowledgement of the various cultural organizations that had supported them in balancing their Asian and American identities, and personal feelings of diversity and inclusion within the city. In general, the predictions were all well-supported by the results. There was one caveat, which was that Indian immigrants, like the East Asian immigrants interviewed, also felt as if their political views and interests were not represented. This was directly contrary to Aptekar’s (2008) findings, which were that in Edison, New Jersey, Indians were more likely to be politically integrated than Chinese immigrants. Given that Aptekar (2008) occurred in one small geographical location far from San Jose, however, it is entirely possible that her results were simply not generalizable to other regions. This study, of course, had a fair number of limitations. Because the study utilized non-random sampling and a small sample size, in future studies, randomization of interview collection as well as a larger body of responses would be helpful. Further, though my results encompassed Asian immigrants of differing nationalities and age groups, I was not able to interview Southeast Asians or Pacific Islanders, nor was I able to interview Asian immigrants between the ages of 20 and 50. In future studies, targeting those groups for interviews would lead to more comprehensive, representative results. Finally, the nature of this study made it so that the focus of the study was on individual-level integration, rather than on institutional-level, group outcomes. Given the differences between individual-level integration and group integration, and that individuals can be more or less integrated where larger groups are not, there is ample opportunity for work to be done analyzing institutional-level integration, cultural and political, for Asian immigrants in San Jose.

Assignment 3: CA 51

Slide 1:

This first slide shows two theories that at first glance appear to be conflicting. The demographic information—namely, CA 51’s 10.7 pp increase in Latino population over the past ten years—predicts prevalent anti immigrant sentiment and white backlash, according to Hopkins 2010 and Abrajano & Hajnal 2015, whereas the strong Democratic presence and consistently re-elected Democratic MC would predict pro-immigration attitudes, from Ramakrishnan & Wong 2010 and Casellas & Leal 2013. However, I attempt to reconcile these two schools of thought by my hypothesis, which predicts that white voters in CA 51 will have more anti-immigration attitudes than Hispanics, but overall pro-immigrant attitudes and policy making can be explained by the large Hispanic population that shifts the median voter substantially. Furthermore, I test my prediction that CA 51 will have more liberal pro-immigrant attitudes than CA overall, perhaps due to this large Hispanic population, though the causal mechanism is difficult to test. I also outline my precise comparison plan for the regressions I will do.

Slide 2:

This slide describes the dataset I utilized, the questions I honed in on, and how I recoded the responses. I utilized the 2016 Cooperative Congressional Election Survey (CCES) dataset, because 2016 was a relatively recent dataset that occurred in a pivotal presidential election year, and CCES itself had a large sample size for my district and CA overall. The question I used to estimate immigration attitudes for each observation was, “What do you think the U.S. government should do about immigration? Choose all those that apply” and I picked the four options that seemed most relevant to my hypothesis. I recoded the original “Yes/No” responses into a dummy variable with 1 being the pro-immigrant response and 0 being the anti-immigrant responses. I did not make all “Yes” responses equal to 1 because for some questions, “Yes” would be anti-immigrant—for instance, the question of whether the government should “identify and deport illegal immigrants.” As such, I created a new variable, called “imm,” that aggregated participants’ immigration attitudes from each question into a five-point scale, with 0 being the lowest possible score (maximally anti-immigrant) and 4 being the highest (maximally pro-immigrant).

Slide 3:

This slide shows the preliminary results for the district (CA 51) side-by-side with the state (CA) data. Although initially I considered inserting my regression tables, with the various regressions that I ran to test the statistical significance of my predictions, I decided that these boxplots provided the most parsimonious and descriptive representation of my findings. These boxplots show the immigration attitude score (variable = imm) on the y-axis, and whether or not the respondent was Hispanic (variable = hispanic) on the x-axis. The boxes are further divided by Party ID, with Democrats in blue and Republicans in red. For both CA 51 and CA state, Democrats consistently have a higher immigration score (that is, more pro-immigrant attitudes) than Republicans. Additionally, more surprisingly for my hypothesis, there is no statistically significant difference between Hispanics and non-Hispanics in CA 51, according to the regression I ran. There is a slight difference for CA state—moving from non-Hispanic to Hispanic is correlated with a 0.128 unit increase in pro-immigration attitude that is statistically significant at the 0.1 level (p-value = 0.08), but this effect becomes statistically insignificant after controlling for Party ID. Another peripheral but still interesting finding is that in CA 51, first generation and third generation immigrants were less likely to support immigrants than non-citizens, and for CA state, immigrant citizens, second generation, and third generation immigrants are less likely to be pro-immigrant than immigrant non-citizens.

Slide 4:

This slide contains my discussion and concluding takeaway points from my public opinion poll analysis. A key point is that, contrary to my initial hypothesis, there is actually no statistically significant difference between Hispanic and non-Hispanic attitudes toward immigration in my district, CA 51. I posit that this is likely because non-Hispanic residents in CA 51 come into contact with Hispanic residents so frequently that it is unlikely one would stay if that person possessed anti-immigrant sentiment, which is frequently conflated with anti-Latino sentiment as a whole. However, this prediction is difficult to actually test with the data I have, so this remains an initial theory. Interestingly, in contrast, CA as a whole (minus CA 51) initially appears to have a statistically significant difference between whites and Latinos. However, when controlling for Party ID, the difference between Hispanics and non-Hispanics becomes statistically insignificant—that is, most differences in immigration attitudes can be explained by Party ID rather than Hispanic identification. This is further bolstered by the finding from a regression of immigration attitude on Party ID that both CA 51 and CA state have a statistically significant difference in immigration attitudes between Republicans and Democrats, with Republicans likelier to be more anti-immigrant. Lastly, one important idea to remember throughout this analysis is the fact that CA is a relatively liberal state on the whole, and therefore more pro-immigration than the rest of the United States, so the external validity of this study is smaller and these findings are less applicable to America as a whole.

Media Coverage Analysis in New Jersey


For this assignment, I measured socioeconomic status in terms of the district’s median household income and the percentage of adults over age 25 with a bachelor’s degree. My first hypothesis is that immigration news coverage in NJ-11 (a district with a high median household income and % college-educated) should not be as frequent as coverage in NJ-3 (a district with a lower median household income and % college educated). Branton and Dunaway’s study found that in California counties with a greater proportion of college-educated adults, news stories about immigration were less common. Since both California and NJ rank in the top 4 for states with the highest proportions of immigrants, I believe their prediction should hold true for NJ as well.  My second hypothesis is that immigration news coverage in NJ-11 should be more positive/neutral than in NJ-3. Abrajano and Hajnal state that white Americans living near large populations of immigrants may feel that they are competing with them for jobs or other economic privileges, but this perceived threat is less likely to be salient for the citizens of NJ-11 since they are already well-off. Negative coverage of immigrants should resonate more with the less affluent citizens of NJ-3, which should give local media a greater profit incentive to exaggerate it (as Branton explains, local media has a tendency to emphasize issues that their constituents already find relevant). Stories depicting immigrants as unauthorized and criminal are already common in national media, so it is only natural that these stories should be more pronounced in NJ-3 news when compared to NJ-11.


I conducted searches using the key terms “immigrant”, “immigration”, “border”, “wall”, “undocumented”, “shutdown”, and “security” for a local county newspaper from each district. The Daily Record serves Morris County in Northern NJ, which is in District 11. The Burlington County Times serves District 3. I chose District 3 because it has a similar population of Latino people when compared to NJ-11, and this factor could indirectly influence news coverage: Abrajano and Hajnal find that white Americans living in areas with growing Latino populations have more negative attitudes towards immigration, which could cause local news to portray immigration more negatively.

If the articles’ coverage condemned the mistreatment of immigrants, mentioned their contributions to the US, or advocated for reforming laws in a way that helped them and any hardships they faced, I classified them as positive. If articles characterized immigrants as being dangerous, criminals, or a problem for American society I classified them as negative. Articles that did not discuss immigrants at all or whose coverage had aspects of both the “positive” and “negative” categories were classified as neutral. “Economy”, which is my first focus category, referred to articles that discussed the economic impacts of the shutdown on government workers. Articles discussing politicians’ responses to the government shutdown went into the “Partisanship” category. The “Immigrant Experience” category was for articles that discussed the lives of immigrants from all ethnicities and their physical migration into the country. Lastly, the “Border Security” category was for articles mentioning the construction of the wall, Border Patrol, and the views politicians and citizens had towards it. In order to determine the focus and tone of an article, I examined the diction in the title and quickly skimmed it to see how well the content aligned with the title.

To analyze the results of my coding, I created two bar graphs displaying the proportions of each category for focus and tone. The majority of both newspapers’ coverage made neutral statements about immigrants. 70.59% of The Daily Record’s 51 articles published within the given time period were classified as neutral, and 61.5% of the Burlington County Times (BCT) 213 articles were neutral. The BCT’s proportion of negative articles was 17.4 percentage points higher than The Daily Record, and this margin was nearly double the difference in the proportion of positive coverage for between the 2 papers (7.95%). The BCT’s proportion of negative coverage was only 11.26 percentage points higher than its proportion of positive coverage for the BCT, but for The Daily Record positive coverage was nearly 3 times more common than negative coverage. This indicates that for the BCT, negative coverage was more salient since it had less positive coverage to counteract it. The total proportion of BCT articles in the categories of “Immigrant Issues” and “Border Security” is 38.03%, but for The Daily Record this same proportion is 27.45%. For the BCT coverage is split fairly evenly across my four focus areas, and for The Daily Record news coverage is heavily concentrated in the “Economy” category.

Overall, the frequency of immigration stories in NJ-11 was lower than in NJ-3. My focus categories of “Immigrant Issues” and “Border Security” are the ones that primarily focus on immigration (“Economy” and “Partisanship” articles tended to be about the shutdown), and a lower percentage of articles from The Daily Record fell into this category when compared to the Burlington County Times (BCT). Since families in NJ-11 are more likely to be affluent, they are less likely to be worried about their economic status in relation to immigrants. This also explains why there was a high concentration of “Economy” articles for The Daily Record – these articles described the economic impacts of the shutdown on citizens without referencing immigrants. This economic threat narrative is driven by the idea that they are taking away low-skilled jobs from citizens, but in NJ-11 a high proportion of residents work in the pharmaceutical industry or business jobs in New York.

My second hypothesis was also supported, since the BCT had a lower percentage of neutral / positive articles and a higher percentage of negative articles. These results are consistent with Abrajano and Hajnal’s observation that less educated people are more hostile towards minorities. Since this tends to be the case, local newspapers would produce more negative articles in an attempt to appeal to them. One way this occurs is through a “crime news script”, or publicizing a disproportionate amount of nonwhite and immigrant criminal stories. For example, the BCT reported on two stories of undocumented immigrants killing citizens that The Daily Record did not report on at all.

I did not run a statistical test on my proportions, so I cannot be absolutely sure that the differences in proportions for focus and tone between the two newspapers / districts are significant. I believe the large difference between the number of articles for each paper affected this significance, since the BCT appeared to produce a greater volume of content in general when compared to The Daily Record. Since my coding method relied on my own judgment of the articles’ implications, there is a chance that it may not be 100% reproducible.


GA-1 Buddy Carter

Slide 1: I chose two prominent sources of local news in GA-1 with similar levels of salience of immigration news. I measured this salience by calculating the percentage of news articles within the Dec. 11, 2018 – Jan. 31, 2019 time period were pertaining to immigration, the border wall, and the government shutdown. This indicates that both Savannah Morning News and Brunswick News cover immigration news a similar amount; they pay comparable amounts of attention and efforts to immigration coverage. I chose to analyze 40 articles because Savannah News had hundreds of articles related to immigration, the wall, and the shutdown while Brunswick only had around 70. I wanted to analyze the same number of articles for both sources to give equal attention to each source and so I randomly selected 80 articles total because I believe this was a manageable number given my timeframe and resources of the assignment. I classified the tone of articles as either positive, negative, or neutral. A positively toned article was relatively pro-immigrant by satisfying the coding rules given on the slide, a negative article was anti-immigrant, and a neutral article was neither and did not take a clear stance. An article advocated for or against the border wall by explicitly classifying the wall as beneficial or not for the county. An article was critical of Republicans or Democrats by explicitly challenging the actions of one party and not the other. I then classified articles as either focusing on immigrants as criminals, on the issue of the border wall as a matter of security, on humanizing immigrants as individuals and families, on the partisanship around the shutdown, or on local impact of the shutdown in Savannah-area or Brunswick-area.


Slide 2: On this slide I’ve included information about Chatham and Glynn counties, the counties that Savannah Morning News and Brunswick News are distributed in, respectively. I wanted to highlight the statistical differences between the readerships; Chatham county has a much smaller percentage of whites and although both counties have similar percentages of Latinos, Chatham’s total population is much larger and therefore its Latino population is larger. The counties also voted very differently in two recent, significant elections. Chatham has strongly supported the Democratic party with Lisa Ring winning by 16 points in the 2018 congressional election for House representative and Clinton winning by 14.5 points in the 2016 presidential election. Meanwhile, Glynn county has been firmly Republican with Carter winning by 29 points and Trump winning by 28.6 points. These statistics indicate differing political views between the two counties, influencing my predictions about how their news sources may cover and present news about immigrants which I support with literature and research. I predicted that the focus of most articles would be on partisanship because of Wong’s theories of the hyperpartisanship surrounding immigration in recent years. Because immigration is such a politically divisive issue, its news coverage will most likely be centered around the opposing actions, policies, and views of Democrats and Republicans.


Slide 3: On this slide, I present the results of my analyses, during which I used the methods described on slide 1. My coding rules held up well as I was able to accurately classify each of the 80 articles, allowing me to gather relatively clear and unambiguous data. The results indicate significant differences in tone and focus between Savannah Morning News and Brunswick News. Both sources had similar percentages of neutral articles, but for the most part, their articles ranged between having negative or positive tones, taking stances either for or against Latino immigrants. The focuses of the articles ranged, but the focus that had the largest percentages for both sources was partisanship. Even though Savannah and Brunswick News varied widely in their frequency of articles with family and local impact focuses, they both had a similar percentage of articles relating to partisanship.


Slide 4: The results from the analyses confirmed my hypotheses: Brunswick News articles had more negative tones than Savannah Morning News and both majority of both sources’ articles had partisanship focuses. The results also indicated that the more positively toned Savannah News had many articles focused on Family while the more negatively toned Brunswick News had many articles focused on Local Impact. It is logical to assume that a news source with pro-immigrant attitudes and views would depict them as individuals and attempt to humanize and evoke empathy by providing personal stories, names, and faces of Latino immigrants. I can only infer that Brunswick News write articles more focused on local impact because as a news source with anti-immigrant perceptions, it may want to reflect its readership’s more positive outlook on and support of American citizens and community residents that are non-threatening compared to outsiders and Latino immigrants.

NY-13 District Research

Slide 1: Research Design

This research sets out to examine the effects of demographic change in New York’s Thirteenth Congressional District, with specific attention to how these changes have affected immigrant experiences of social and political integration, and whether they have been met with resistance from the district’s native population. To that end, we ask our subjects about the population makeup of their neighborhood and how it has changed in recent years, and for interviewees to identify markers of political and social integration among the local immigrant population. We hypothesize that (1) immigrants are present in large enough numbers to be well integrated, and (2) that the rate of change is not significant enough to provoke backlash.


Slide 2: Interview Participants

We reached out to fourteen organizations, selected from a list of immigrant advocacy stakeholders that comprise the New York Immigration Coalition. Of the five that responded, we interviewed three organizations chosen to represent the geographic and ethnic diversity of our district. Despite it being the smallest in the country, we found that the different neighborhoods and sub-populations within the district have sharply different experiences and difficulties, as we will report in the following slides.


Slide 3: Results (Part 1)

This slide challenges the predictions of our second hypothesis, on the link between demographic change and native backlash. Despite the fact that district-wide no racial group underwent strong relative changes in ethnic populations, this did not account for other, more neighborhood-level effects, such as gentrification. In all three interviews, we heard about the challenges that gentrification brings to immigrants, but in none were the feelings as strong as those in East Harlem. There, immigrants are resented by native residents as they are perceived to be more resilient to the effects of rising housing prices due to their willingness to share small apartments among multiple families.

To a lesser extent, this sentiment is present in Central Harlem as well, where we were told about resentment toward newcomers from native residents who have been increasingly pushed out of their longtime homes. Although this resentment has not manifested itself physically in any of the neighborhoods studied, it is important to recognize that backlash is produced not merely by demographics alone, but rather in the context of underlying socioeconomic trends at the neighborhood level.


Slide 4: Results (Part 2)

This slide addresses our first hypothesis, with regards to political integration. Although our research neither confirms nor disproves the prediction, it adds to it a measure of complexity. Political representation is something that weighs heavily on the minds of all those who we interviewed. But despite immigrants making up large percentages of the population in all three areas, some groups are systematically more integrated than others.

Dominican immigrants are well incorporated into the political system and enjoy “full-throated support” from local politicians (including the co-ethnic Rep. Espaillat) according to Marc Valinoti, managing immigration attorney at the Northern Manhattan Immigration Corporation. Mexicans and Central Americans, meanwhile, suffer the abuses and “broken promises” of a lack of representation according to Melina Gonzalez, immigration outreach organizer at LSA Family Health Service. Both she and François Nzi, founder of the New York Math Academy tutoring program for immigrant youth, believe that the only way things will change is with increased engagement with the political system. His hope is that educating youth will “bring the parents along” as well.

For these reasons of inter-neighborhood heterogeneity, we are hesitant to speak of the effect of demographics on political integration, as different groups seem to enter into the system at different rates. Nevertheless, we find that a key goal for immigrant advocacy organizations remains increasing voter registration and turnout in the hope of achieving entry into the political sphere, giving modest support to our hypothesis about the positive effects of increased immigrant numbers on political integration.

The Immigrant Experience in NJ 12(D)

Slide 1: In Enos’ “Causal effect of intergroup contact on exclusionary attitudes,” the author talks about the immigrant community at large and the correlation between the increase of immigrants in homogenous areas and how that leads to hostility and negative sentiments towards immigrants. The fact that the rapid growth of the Latinx population in an area correlates with an increase in negative sentiments towards immigrants and immigration is also talked about by Abrajano & Hajnal (2015); Hopkins (2010); Newman (2018); Adida (2018). Patricia Fernandez-Kelly’s paper called “The Integration Paradox: Coping Strategies among Immigrant Children in the Age of Mass Deportations,” talks about how integration of immigrants in a community is easier if there is already a pre-existing large presence of immigrants within said community. However, this is not true when it comes to Asian immigrants and their political representation, which was examined by Aptekar’s paper which is titled “Highly Skilled but Unwelcome in Politics: Asian Indians and Chinese in a New Jersey Suburb.” When looking at NJ 12, data from the United States Census Bureau shows that the Latinx population of NJ 12 more than doubles from 2007 to 2017 (going from 7.4% to 18.1%). In addition to this, another large demographic shift was seen in the number of foreign-born residents in the district. In 2007 the foreign-born pop. was 13.4%, which then increased to 44.3% in 2017, indicating a +30.9pp. Based on the existing literature on demographic shifts of immigrants (specifically Latinos), the increase of the Latinx community in NJ 12 means that it is likely for there to be an increase of hostile sentiments to the immigrant and Latinx community. As a result of NJ12’s Latinx population increase, it is now on par with the national average of 18% Hispanic. This means that Latinx immigrants should in theorynot have too much of a hard time “integrating” into communities within NJ 12; however, in reality I predict that this is not the case and that integration is not easy, especially for those immigrants that are undocumented.

Slide 2: In order to test my prediction about the immigrant experience I needed to break down what “integration” means. I defined “integration” into categories: feeling of belonging; participation in broader community; accessibility to education; accessibility to resources; job security; and the ability to communicate with the broader community. In order to find out if the prediction for NJ12 was true or not, the interviewing of immigrants was conducted, this included undocumented immigrants. The interviews would be focused on members of the Latinx immigrant community. The questions being asked of them would revolve around what I previously defined as being integrated into the community, and whether they felt like they could or have integrated. Questions about population groups were asked as well, and for those who have lived in NJ12 for a year or more were also asked whether or not they have noticed a demographic shift within those groups. Since all of those interviewed were immigrants, data in order to contextualize their responses was also collected (ex: age, country of origin, length of time in the community, employment, how they ended up in that community, etc.,). A total of five immigrants were interviewed. They ranged in gender, age, occupation, country of origin, documentation status, and length of time within NJ12. In terms of getting in touch with the immigrants interviewed, I reached out to a local leader from the immigrant community to help me get the interviews of these immigrants.

Slide 3: In order to put the responses of the interviewee’s I will go over some of their information to add context: Countries of origin: Mexico(2), Guatemala(2), Venezuela; Age Group: Minor(2), Adult(3); Gender-Identity: F(2), M(3); Socioeconomic status: Low income(4), Middle Class; Education Level: High School(3), College(1), Ph.D.; Documentation Status: Undocumented(4), Documented; Reason for Immigrating: Escaping violence(4), Higher Education then Job. In order to get a sense of the immigrant experience in NJ 12, I focused mostly around the “integration” of the immigrant. In the previous slide I defined “integration” into categories: feeling of belonging; participation in broader community; accessibility to education; accessibility to resources; job security; and the ability to communicate with the broader community. When asking the immigrants if they had a sense of belonging in NJ 12, all of them answered no. This sentiment is specially seen in the undocumented immigrants of whom I interviewed; the reason for this being mainly attributed to the fear of deportation they face on a daily basis. While ICE raids are not necessarily frequent in the area, according to all of them, ICE has become more aggressive and has even targeted parents when dropping their kids off at school. For example, just last week there were three undocumented immigrants detained and taken from their homes, all parents, leaving their families without a much-needed provider. Another reason why a sense of belonging is absent for all of the interviewees is that they all have experienced negative rhetoric towards them and those they know as immigrants, including their kids while at school. As a result of the lack of belonging and the fact that many of those interviewed work multiple jobs and are students, they do not participate in the broader community. The only one of those I interviewed who participates in the broader community is the immigrant with a Ph.D., through volunteering and attending events in the schools and town. Others do not have the time and feel unwelcome or uncomfortable in those spaces. One great thing about the public schools in NJ 12, is that students do not need to demonstrate citizenship or residency in order to get an education. In addition to this, there are many organizations (as well as some underground) which help undocumented immigrants when in need of helping pay rent, medical bills, acquiring an ID, legal help, and more. One major concern for these undocumented immigrants is being exploited by their employers because of their status. Many of them work unsteady and underpaid jobs, with the exception of the immigrant with the Ph.D. Another barrier to integration is the language barrier, which takes time to overcome especially because of the fact that most immigrants stay within their small communities and do not get immersed in English. It is also hard to make relationships with people who don’t speak Spanish for them. While none of the interviewees noticed the demographic shifts, they have noticed the increased hateful rhetoric since the Trump administration took place. Some reflected on the atmosphere changing but not due to increase in Latinos.

Slide 4: After listening to the five immigrants I interviewed, from what they said, theincrease of Latinx population correlated with an increase in negative rhetoric towards Latinos, but it was the rise of the Trump administration that lead to this, not the demographic shift seen from 2007 to 2017. Findingcommunities of undocumented immigrants, and Latino communities are not hard; however, as we can see from the interviews, it does not indicate an easier time of “integrating” for new comers, especially for those who are undocumented. It seems that integration is not possible with the constant fear undocumented immigrants face, the exploitation of undocumented immigrants by their employers, the language barrier, and hateful rhetoric which causes immigrants and their families to feel unwelcome and unsafe. In addition to this, it is hard for immigrants to be involved in their greater communities since they work long hours, are underpaid, and again, are exploited if undocumented. Some positives that I found in the immigrant experience in NJ 12, reflected by the interviews was the fact that there are many organizations which help undocumented immigrants, access to public schools, and that within the pre-existing large Latinx communities, immigrants can help each other out. Some limitations that I ran into was that while I could only interview 5 immigrants, interviewing more would allow for a broader picture to be painted of the immigrant experience in NJ 12. In addition to this, interviewing immigrants of other ethnicities could also possibly be helpful in terms of grasping a better picture of what the immigrant experience is in NJ 12; however this could make the research less focused.

FL-24 Media Content Analysis

My research investigates whether population demographics affect the likelihood of positive coverage of immigration. This research tests the theory that Branton and Dunway (2009) present in their analysis of media coverage on immigration. One of the lesser emphasized results of their study is that when the Latino population exceeds 25%, the coverage of Latino immigration declines. I will apply this theory to FL-24, which has a Latino population of nearly 40% by comparing media coverage of immigration in South Florida (where FL-24 is located) with that of Jacksonville, where the Latino population is just 8%. In addition, the percentage of foreign-born population in FL-24 is 44%, and the foreign-born population in Jacksonville is 8.44%.

I will test not just the amount of coverage, as Branton and Dunway’s theory covers. I will also survey the tone and differing focus areas of the two areas’ newspaper coverage. I predict that South Florida, with a higher Latino and immigrant population, will have both a higher percentage of pro-immigrant news stories. Based on Branton and Dunway’s research, FL-24 will have a decreased volume of coverage on immigration. However, I predict based on the high immigrant population, the South Florida newspapers will be more positive in tone when covering immigration issues.

The data that will be analyzed is articles pertinent to immigration during the 2018-19 federal government shutdown in two South Florida newspapers, The Miami Herald and The Sun-Sentinel, and the Jacksonville newspaper, The Florida Times-Union. Using the database Newsbank, I went through all three sources and searched for articles with the search term “”immigrant” OR “immigration” OR “immigrants”, border wall security shutdown” within the date range of 12/11/2018 and 1/31/2019. This allows us to find the relevant articles that mention immigration within the time period, so as to avoid articles that are just about the government shutdown but have no perspective on immigration. Then, all relevant articles were downloaded, excluding editorials, as the focus of the research is how the immigration issue is covered in news articles, not how the readers who write in to the newspapers feel about immigration.

The selected articles are then coded for their tone and focus area and for all articles, the results are recorded in an Excel spreadsheet. To perform the coding for the articles, I analyzed how immigrants are characterized or what context they are described in within the articles. Articles are coded as positive in tone if immigrants are characterized as hard-working, contributing to society, being “legal” or living legally. In addition, if immigrants are mentioned in the context of the DREAM Act, humanitarian issues (such as immigrant deaths), families, or ‘vulnerable’ populations (young, old, or women), the article is coded as positive. Lastly, articles that are specifically for the purpose of helping immigrants with legal challenges are coded as positive. On the other hand, articles are coded as negative if they describe immigrants as illegal or living illegally, describe immigrants in the context of crimes (including gangs or smugglers), or describe immigration as a problem or crisis. Neutral articles are those in which immigration is only mentioned in one or two lines of the article or where the article reports only series of events and all opinions are quoted from other sources, such as political party leaders.

The results of the analysis show that in South Florida, with a large immigrant and Latino population, the coverage of immigration is much more positive than the coverage in Jacksonville, with a low immigrant and Latino population. The Miami Herald and the Sun Sentinel both have greater than 50% positive articles. The Florida Times Union, however, has primarily neutral articles solely covering the series of events during the government shutdown, and only has 15% positive articles. In terms of focus area, for all three sources, partisanship (primarily stories about national politics) is the majority of the articles, which makes sense due to the coverage of the national debate over the government shutdown. However, the South Florida newspapers have a much broader range of coverage for different focus areas, including international politics (mostly stories about Venezuelan politics) and news within the local immigrant community.

My research contradicts the findings of Branton and Dunway, who argue that coverage of immigration will decrease with a greater than 25% Latino population. In fact, in terms of the volume/quantity of coverage, the number of articles that fit the search terms are not dependent on location; the Miami Herald and Sun Sentinel produced 71 and 49 articles respectively, while the Florida Times Union has 62 stories that fit the search terms and date range. However, the tone of the coverage differed substantially between the two different areas of Latino and immigrant concentrations. Additional research can focus on determining which of the two factors contributed to the positive coverage of immigration – the Latino population or the immigrant population. Overall, these findings suggest that although the amount of coverage is not based on population – especially for a politically contentious issue like immigration during a politically contentious period like the government shutdown – the tone of that coverage in media varies significantly based on the population demographics.

Texas’s 2nd District: Demographics and Media Effects

This presentation focuses on a finding by Regina Branton and Johanna Dunaway that immigration coverage and, more specifically, negative depictions of immigrants by newspapers increase as the Latino population in a district increases up to a certain point (between 18% and 27%) in California. This is due to the issue of immigration being more local due to the geographical proximity to the border and a growing Latino population that residents may fear threaten security and take away economic opportunities from natives. With the 2nd District located in Texas, another border state, this theory would likely be applicable. As the Latino population exceeds this point, however, newspapers decrease both their coverage of immigration and negative aspects of immigration attributed to Latinos because they worry continuing this coverage will alienate a large consumer-base needed to stay in operation. Since the 2nd District’s Latino population is currently 32.1% of the total population and above the 18-27% range, this analysis predicts coverage of immigration and negative depictions of immigrants will be less than in another market with a Latino population within the 18-27% range and a more positive tone will be made towards immigrants. Additionally, this analysis predicts the focus of stories in the 2nd District will be on immigrant experiences and immigrant contributions to the economy and away from the threat narrative of crime and economic pain that would be more readily presented in a market with a Latino population within the 18-27% range.


Newspapers were the chosen sources of media to make the results of this analysis most comparable to Branton and Dunaway’s research (they also used newspapers). The newspapers chosen for this analysis were the Houston Chronicle and the Tyler Morning Telegraph. The Houston Chronicle is the largest newspaper in the 2nd District, and the Tyler Morning Telegraph is the largest newspaper from Tyler, Texas, an area with a Latino population of 19%, which is within the 18-27% range where media companies see painting immigration and negative depictions of immigrants as important to maximizing profits. The two newspapers were chosen to be with the same state for two reasons: the first is that Branton and Dunaway also used data from only one state to test their hypothesis (California), and the second is that restricting newspaper coverage within the same state controls for state laws and state political rhetoric that influences news coverage. Regarding tone, articles showing immigrant experiences, immigrant economic contributions, or negative effects of the shutdown all denote positive experiences. Showing immigrant experiences within a broader society, usually through immigrants sharing their immigration stories or through political activism against restrictionist policies, and the economic benefits of immigration, often through reports saying how cutting immigration levels would hurt the US economy, counteract the Latino threat narrative, which portrays Latino immigrants disproportionately as being criminals and taking economic opportunities from natives. The last criteria, showing the downsides of the shutdown, was included because the premise for the shutdown was for President Trump to receive funding for his wall, and stories that prioritize the negative effects of the shutdown ignore this motive and imply that obtaining funding for the wall is insignificant in comparison. This is positive for immigrants because it implies that Americans are willing to prioritize other services over a policy meant to keep out immigrants. Articles are negative if they highlight problems associated with immigration, like crime/security concerns and immigrants taking economic opportunities from natives or draining social services, as they support the Latino threat narrative. Finally, articles are neutral if they show no preference for positive or negative aspects of immigration, including if an article presents both sides of an issue without making a judgment of which side is better or promoting a compromise bill that includes restrictionist and liberal measures (e.g. DACA protections and a wall). Articles were excluded if they came up within the seven search terms (“immigration,” “immigrant,” “border,” “wall,” “undocumented,” “shutdown,” and “security.”) but were not related to the topic of immigration or the shutdown (e.g. a story mentioning a “wall” painting).

The Houston Chronicle articles have a disproportionate emphasis on immigration in comparison to the Tyler Morning Telegraph. 8.3% of all articles in The Houston Chronicle from December 11, 2018 to January 31, 2019 discuss immigration or shutdown-related material, while 2.9% of all articles in the Tyler Morning Telegraph do the same. 75% of all Houston Chronicle articles included positive material, 18.5% were negative, and 6.5% were neutral.  Meanwhile, 46.8% of all Tyler Morning Telegraph articles were positive, 40.3% were negative, and 13% were neutral. Articles in the Houston Chronicle skews toward positive material, while the Tyler Morning Telegraph has significantly more negative articles and slightly more neutral articles than in the Houston Chronicle.

The Houston Chronicle’s greater emphasis on immigration-related articles than the Tyler Morning Telegraph rejects Branton and Dunaway’s hypothesis that media outlets will decrease their coverage of immigration after the Latino population surpasses an 18-27% range. However, the Houston Chronicle pays less attention to negative coverage of Latino immigration and more attention to stories that focus on immigrant experiences/positive contributions of immigrants (29.4% of immigration articles in the Houston Chronicle have this focus, as opposed to 20.8% of immigration articles in the Tyler Morning Telegraph), which supports Branton and Dunaway’s hypothesis that negative coverage of immigration will decrease as the Latino population passes the 18-27% range. This potentially occurred because of Latino backlash to negative public perceptions of them, which caused media coverage not to decrease, but to include more positive images of immigrants to appease their large Latino consumer base. While the Tyler Morning Telegraph features more coverage of negative stories than the Houston Chronicle, it should be noted that  positive stories still outnumbered negative ones, questioning whether the Latino threat narrative is truly the predominant media narrative, even in areas where Latinos comprise 18-27% of the population. An interesting fact about the amount of positive coverage of Latinos, however, is that 60.2% of all positive articles in the Houston Chronicle and 55.6% of all positive articles in the Tyler Morning Telegraph focused on the negative impact of the shutdown. This shows that even articles which positively frame immigrants focus more on the costs restrictive policies have on natives, as opposed to directly discussing immigrant experiences and contributions. Framing immigration in this manner still leaves consumers of the news in the dark about competing images to the Latino threat narrative, questioning whether increasing positive coverage in high-Latinos areas changes stereotypes or just paints other issues as being more important than immigration.

Demographic Changes and Political Attitudes in CT-4

I. Theory and Predictions
I test the effect of CT-4’s demographics on two outcomes: electoral outcomes and the importance of immigration to voters. Many papers (more than mentioned in the slide) have documented “racial threat,” or the tendency of whites to become more politically conservative when faced with the influx (or economic rise) of racial minorities. The papers listed in slide 1 identify particular effects, which are in fact much more conditional than the general trend of racial minorities triggering white conservatism. Craig and Richeson (2017) randomized priming of respondents with newspaper articles about the growth of the Hispanic population (or a control condition). Jones and Martin (2017) set a very large cutoff (>300%) for Hispanic growth, and Hopkins’ (2010) “politicized places” theory argues that a large influx influences political outcomes and attitudes mostly during intense national news cycles, and not in general. We should be cautious, then, about drawing a general connection between non-white Latino immigration and white conservatism; it seems that only when immigration is at the forefront of respondents’ minds does it have an effect on their politics. The second outcome is simply how much immigration matters to survey respondents. Dunaway, Branton, and Abrajano (2010) show that border states exhibit higher immigration salience in both local media coverage and survey respondents’ attitudes.

II. Data and Hypotheses
Because CT-4 has experienced greater-than-average Hispanic population growth since 2008, we might expect some white conservative shift in electoral outcomes. Such a finding would in fact fly in the face of the theories presented above because there is no activating mechanism like priming or a national emergency. Gathering data from the Cook Political Report (links below) and the American Community Survey (2008 3-year estimates, 2017 5-year estimates), I test the relationship between change in non-white Latino population (2008-2017) and change in Democratic vote share (2018 minus 2008), hypothesizing a negative relationship for majority white districts. Because CT-4 is majority white, but it did not experience “massive change,” it should fall above the line of best fit between these two variables. With respect to immigration salience, I use survey data from Harvard’s 2016 Cooperative Congressional Election Study. Using ACS data to identify very similar districts to CT-4, I ask if Dunaway et al.’s findings apply to districts like CT-4 in particular; if they do, we should witness a significant difference between respondents’ attention to immigration in matched districts in border states and their attention in CT-4.

III. Results: H1
I excluded all districts that had uncontested elections in either year, because electoral margins of 100% do not accurately reflect district-level partisanship. The bivariate plot in slide 3 shows the positive relationship between Democratic gains (∆pp) and percentage change in non-white Latino population growth (outliers mostly in FL and CA) for minority-white districts. This relationship is very significant (p < 0.005), but the coefficient for non-white Latino growth is not significant at any level for majority-white districts. Rather than the negative relationship we expected, it seems changes in Democratic vote share cannot be explained better by non-white Latino population changes than by a guessing the average. We do see CT-4 above the line of best fit as hypothesized, but that difference from the prediction is not due to the fact that its change in non-white Latino population was not sufficiently extreme; were that the case, the regression would be significant. Instead, I would ascribe that result to randomness, or even better to the massive number of other factors that influence electoral outcomes. Many traditionally Republican households in the northeast flipped blue in response to Trump, for example. In conclusion, we fail to conclude that a non-white Latino influx had any effect on district-level electoral outcomes, either for CT-4 or for non-majority-white districts in general.

IV. Results: H2
In general, aggregate estimates can mask heterogeneity; that is, an “average treatment effect” is an average and might miss interesting patterns. To know if border-state status causes higher immigration salience for districts like CT-4, or put another way, if CT-4 is less invested in immigration on account purely of its non-border status, I employ a matching scheme. Using the ACS 5-year “Selected characteristics of the native and foreign-born populations,” I identify all districts that are within half a standard deviation of CT-4 on the following variables: median age, median household income, percent non-white Latino, percent white, population, and Democratic vote share (measured from Cook Political Report data). This resulted in two other districts: CA-7 and NY-18, which is right next to CT-4! This “matching design” infers a causal effect of the “treatment” (being on the border vs not) on the outcome (survey respondents’ rating of immigration), on the assumption that we observe all other variables that could conceivably change the outcome. This is surely false, but we get a good estimate. The bar chart shows weighted means (using CCES “pre” weights), with 95% confidence intervals, of the percentage of voters who think immigration is “very important.” While CA-7 voters say so at higher rates than CT-4 voters, the difference is not significant. This difference might be significant if we had more than 99 responses (45 for CA-7, 26 for CT-4, and 28 for NY-18), but it is the data we have. We thus fail to reject the null hypothesis that immigration salience does not vary between medium-sized, liberal, wealthy districts on and off the border.

V. Links
Link to 2008 election data: https://www.fairvote.org/overview-and-data
Link to 2018 election data: https://docs.google.com/spreadsheets/d/1WxDaxD5az6kdOjJncmGph37z0BPNhV1fNAH_g7Ikp C0/edit#gid=0

VI. Works Cited
Craig, Maureen A., and Jennifer A. Richeson. 2018. “Hispanic Population Growth Engenders
Conservative Shift Among Non-Hispanic Racial Minorities.” Social Psychological and Personality Science 9 (4): 383–92. https://doi.org/10.1177/1948550617712029.

Dunaway, Johanna, Regina P. Branton, and Marisa A. Abrajano. 2010. “Agenda Setting, Public Opinion, and the Issue of Immigration Reform*.” Social Science Quarterly 91 (2): 359–78. https://doi.org/10.1111/j.1540-6237.2010.00697.x.

Hopkins, Daniel J. 2010. “Politicized Places: Explaining Where and When Immigrants Provoke Local Opposition.” The American Political Science Review 104 (1): 40–60.

Jones, Bradford, and Danielle Joesten Martin. 2017. “Path-to-Citizenship or Deportation? How Elite Cues Shaped Opinion on Immigration in the 2010 U.S. House Elections.” Political Behavior 39 (1): 177–204. https://doi.org/10.1007/s11109-016-9352-x.

« Older posts Newer posts »

The McGraw Center for Teaching and Learning
328 Frist Campus Center, Princeton University, Princeton, NJ 08544
PH: 609-258-2575 | FX: 609-258-1433
mcgrawect@princeton.edu

A unit of the Office of the Dean of the College

© Copyright 2025 The Trustees of Princeton University

Accessiblity | Privacy notice