Category: Assignment 2 (page 3 of 4)

Pennsylvania District 4 Demographics

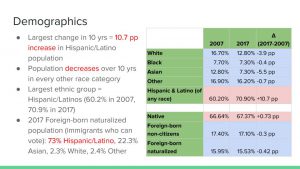
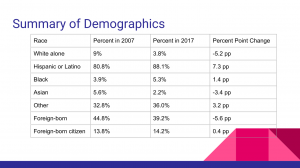
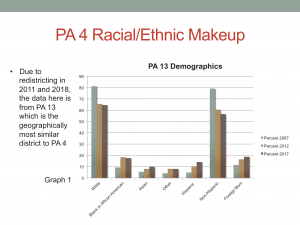
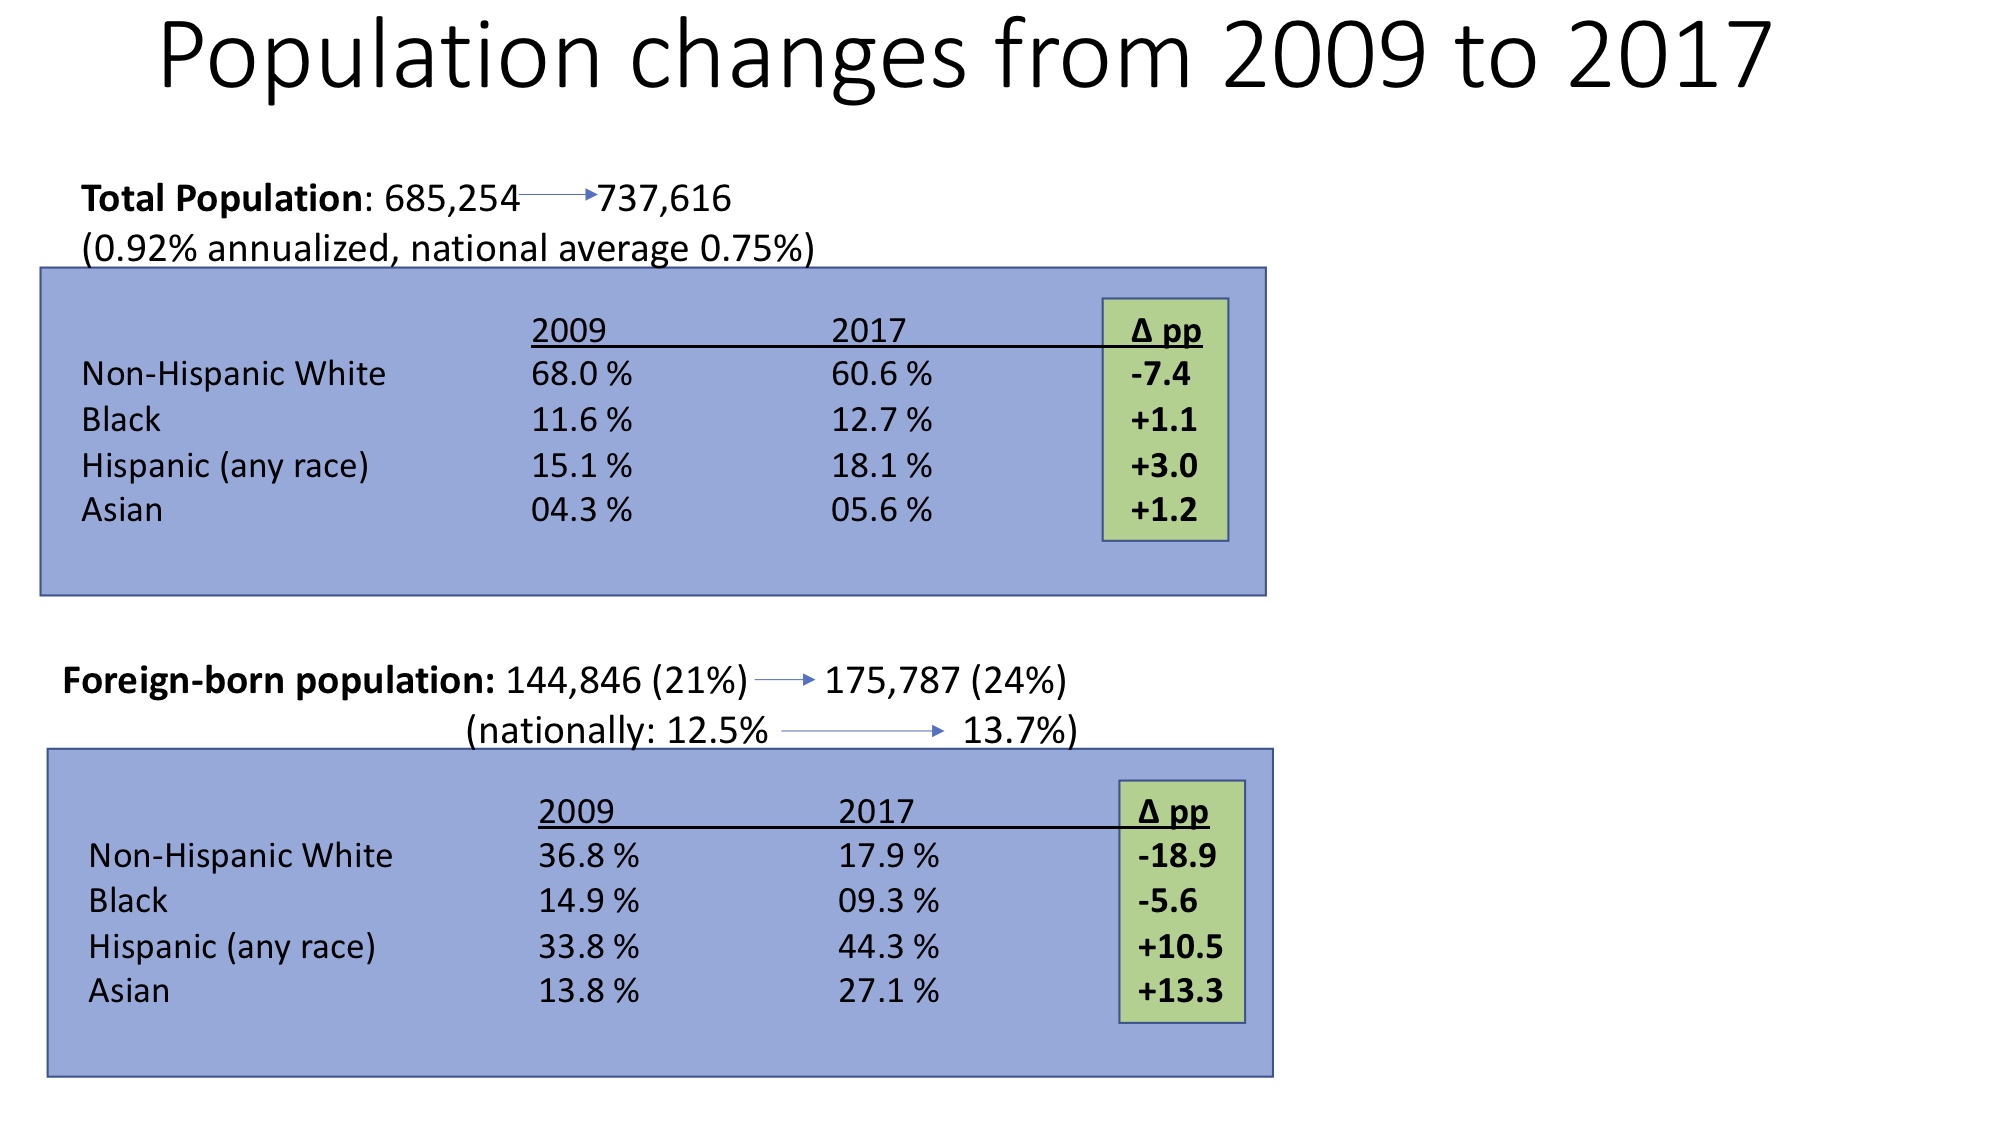
Because Pennsylvania has been redistricted in both 2011 and 2018, it has been very challenging to determine accurate historical demographic information for PA 4. Prior to 2011, the geographically closest district to PA 4 was PA 13. The new PA 4 covers almost all of the old PA 13, plus some more suburban/rural land northwest of Philadelphia. Luckily following the 2011 redistricting, PA 13 remained virtually unchanged. From 2007 to 2018 PA 13 is the closest district to PA 4, and although it is not entirely representative of the demographics, it is the best estimate given PA’s frequent redistricting. From 2007 to 2017 the white population has consistently decreased (-16.7 pp), while the Black or African American, Asian, and Hispanic populations have all increased (+8.3, +4.6, +9.3 pp respectively). The percent foreign-born population has also risen (+7.34 pp), while the non-Hispanic population went down (-22.6 pp).


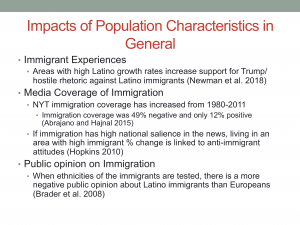
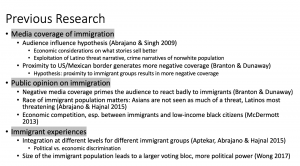
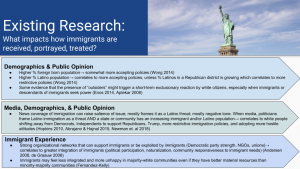
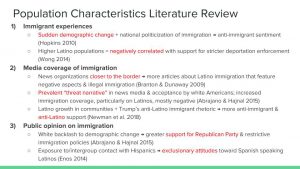
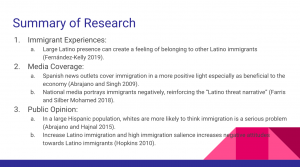
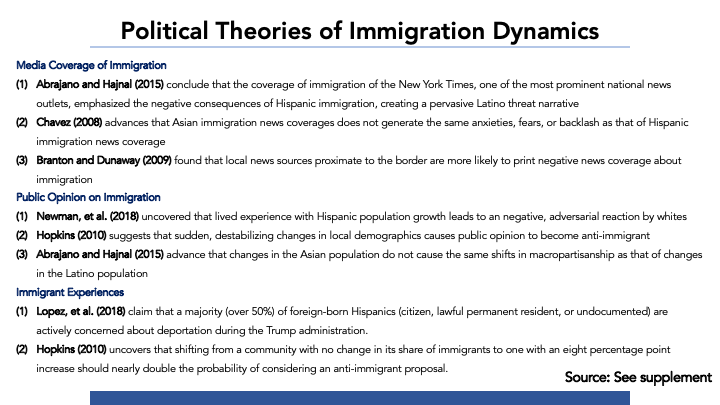
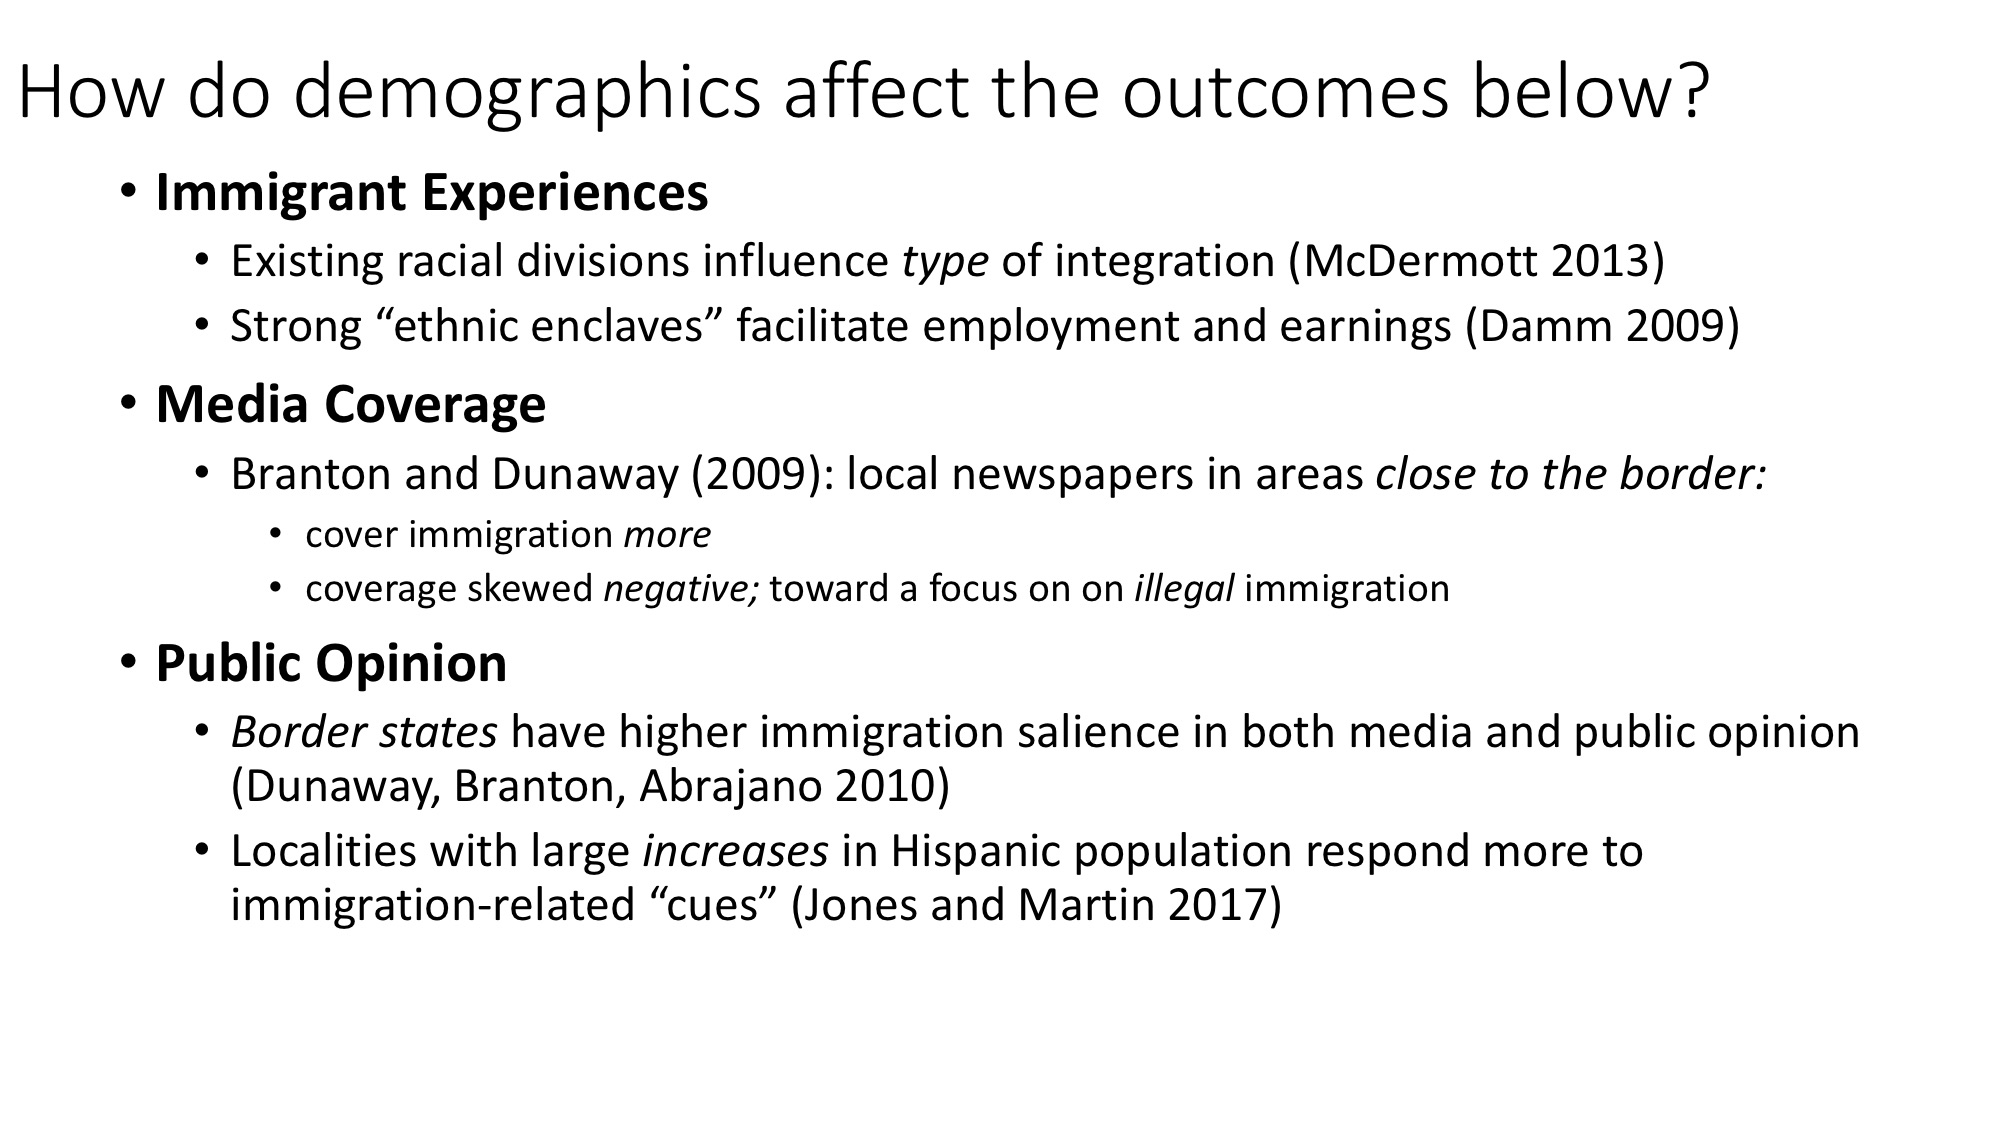
Newman et al. examined support for Trump over multiple periods of time using some of Trump’s controversial immigration comments as markers. They found that places with high Latino growth rates were more likely to support Trump. These findings likely relate to the way Trump frames his often-negative description of immigrants. As a political elite, his framing may influence his followers and potentially even prime them to view immigration as a more important issue than they would have deemed originally. In addition to Newman et al., Abrajano and Hajnal addressed how population characteristics influence perceptions on immigration. Specifically, they showed that immigration coverage has gone up over the past 30+ years and it is often negative in content. The Latino threat narrative could either cause this, or it could also be a major factor contributing to the idea. Regardless, immigrants have been discussed more often in the media, and they have been described in more negative ways. In 2010, Hopkins also found that as long as immigration has a high national salience, living where many immigrants are moving to is linked to negative attitudes about immigrants. This is a similar finding to what Newman et al. describes. The Latino population growth rate is important in understanding the native attitudes surrounding immigration. Public opinion on immigration also seems to be racially biased—in 2008 Brader et al. found that there is a more negative public opinion about Latino immigrants than European ones. This finding fits with much of the other data examined because of a larger anti-Latino threat narrative.

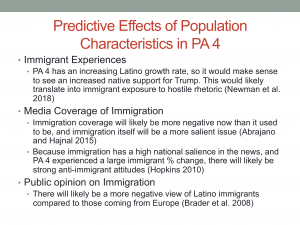
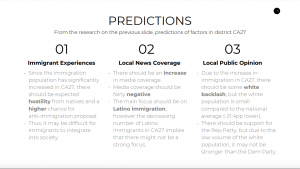
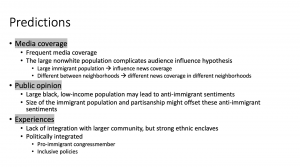
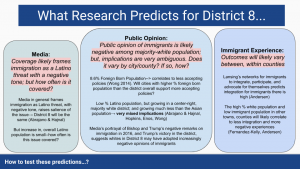
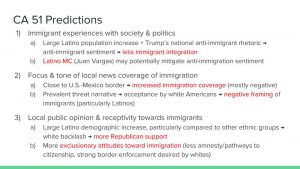
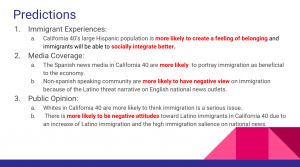
Following from the fact that PA 4’s Hispanic population has steadily increased since at least 2007, and that the % foreign-born has also increased, the literature would generally suggest negative attitudes towards immigration. More specifically, Newman et al. predicts that because PA 4 has a high Latino population growth rate over time, there could likely be increased support for Trump and propagation of his hostile anti-immigrant language. Immigration media coverage too will likely appear more negative now, while also being discussed more frequently (Abrajano and Hajnal 2015). This increased media presence paired with a growing foreign-born population could also likely result in backlash against immigration  (Hopkins 2010). In addition, there will likely be a comparatively negative view against Latino immigrants than those coming from Europe (Brader et al. 2008). This is particularly relevant because the white population in PA 4 is falling, while foreign-born and Hispanic population is increasing, which could lead to decreased immigration support. Surprisingly, although the literature overwhelmingly predicts that PA 4 would have negative immigrant attitudes, the policy and strongly democratic partisan lean seems to contradict this. Although I will have a better understanding after testing these predictions specifically, it appears extremely unlikely that the district holds such negative attitudes while the MC is co-sponsoring multiple bills in support of immigration, and the fact that Montgomery County—which almost aligns exactly with PA 4—is a sanctuary area for immigrants. Although these predictions may be accurate on a national scale, I question how applicable they will be to PA 4.

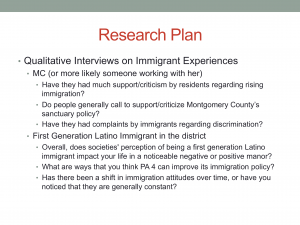
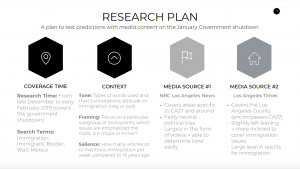
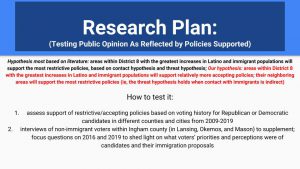
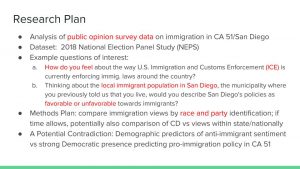
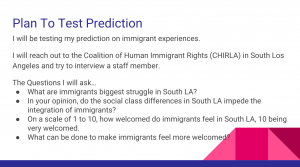
Ideally, I would secure one interview with PA 4’s MC and one interview with a first generation Latino immigrant in the district. To reach out to someone in Madeline Dean’s office, I will email and subsequently call if they are unresponsive to my email. I would explain exactly why I want to speak with them and how I am a student at Princeton University. Hopefully, they will take at least ~10 minutes to quickly answer my questions about public feedback regarding PA 4’s immigration policy. Does the MC’s office qualitatively find that people who reach out are generally in support or against the fairly pro-immigration stance by the district? Although this question would not give a definitive result in either direction because of the massive selection bias of people who make the effort to contact their local representatives, it would be fascinating to see if the public generally propagates anti-immigrant rhetoric like Newman et al would predict. In addition, in order to directly gauge first-generation immigrant experience, I want to reach out to someone who has moved to PA 4 for most of his or her lifetime. A man who lives two houses down from me is a first generation Latino immigrant, so he will be the first person I reach out to. From his experience, has he generally seen negative attitudes about immigration or has there been more widespread support? How often has he heard people repeating the negative discriminatory language used by political elites such as Trump? How has this public opinion changed over time? Based on these responses, if anti-immigration rhetoric has increased over time, then it would support the prediction that a rising Latino and foreign-born population could cause negative native attitudes on immigration.

NJ-06 Immigration Dynamics

Representative: Frank Pallone

Congressional District: 6th District of New Jersey

Party: Democratic Party

NJ-06: Demographic Data

In comparison to the nation and state, the sixth district of New Jersey is remarkably diverse and has experienced significant demographic changes. First and foremost, the immigrant population—comprising both foreign born naturalized citizens and foreign born permanent residents—currently constitutes 28.6% of the district population which is significantly higher than the national statistic of 14.4% and state statistic of 22.1%. Over the ten year period from 2007 to 2017, the district has experienced a surge in the Asian and Hispanic populations with a 8.60 percentage point increase and 7.30 percentage point increase respectively. Viewed from a macro-perspective, the Asian and Hispanic minorities in fact comprise over 40% of the district population.

Sources

U.S. Census Bureau; American Community Survey, 2007 American Community Survey 1-Year Estimates; Selected Characteristics of the Native and Foreign-Born Populations

U.S. Census Bureau; American Community Survey, 2017 American Community Survey 1-Year Estimates; Selected Characteristics of the Native and Foreign-Born Populations

Political Theories of Immigration Dynamics

Through detailed quantitative and qualitative analysis, political scientists have generated theories to explain the effects of local population characteristics on media coverage, public opinion on immigration, and immigrant experiences. Importantly, Abrajano, Hajnal, and Chavez uncover differential media coverage of Asian immigrants and Hispanic immigrants. Abrajano and Hajnal found that over a thirty year time span, the New York Times has had a negative bent of Hispanic immigration, forming and advancing pervasive Latino threat narrative. According to Chavez, unlike Hispanic immigration news coverage, Asian immigration news coverage does not generate the same anxieties, fears, and backlash. Branton and Dunaway also examined the effect of location and found that proximity to the border was a predicator of a greater negative sentiment. In the same way, Newman uncovered that lived experience with the Hispanic population growth lead to a negative reaction by whites in that area. Abrajano and Hajnal, however, did not find that changes to the Asian population generated the same shifts in the macro-partisanship of the Latino population. At a larger level though, Hopkins found that destabilizing changes in population demographics promoted an anti-immigrant public opinion. Ultimately, the media coverage and public opinion of immigration created potent effects on the immigrant experience. Lopez highlighted that, on a racial level, the Trump administration has driven more Hispanics to be concerned about deportation. On the legislative level, increases in the immigrant population within a locality causes a district to give greater weight to anti-immigrant proposals. Taken as a whole, demographic changes are indicative of neutral or negative immigration sentiments.

Sources:

Abrajano, Marisa, and Zoltan L. Hajnal. White backlash: immigration, race, and American politics. Princeton University Press, 2017.

Chavez, Leo. The Latino threat: Constructing immigrants, citizens, and the nation. Stanford University Press, 2013.

Branton, Regina P., and Johanna Dunaway. “Slanted newspaper coverage of immigration: The importance of economics and geography.” Policy Studies Journal 37.2 (2009): 257-273.

Newman, Benjamin J., Sono Shah, and Loren Collingwood. “Race, place, and building a base: Latino population growth and the nascent trump campaign for president.” Public Opinion Quarterly 82.1 (2018): 122-134.

Hopkins, Daniel J. “Politicized places: Explaining where and when immigrants provoke local opposition.” American political science review 104.1 (2010): 40-60.

Lopez, Mark Hugo, Ana Gonzalez-Barrera, and Jens Manuel Krogstad. “More Latinos Have Serious Concerns About Their Place in America Under Trump.” Pew Research Center, October 25 (2018).

Prediction of Political Theories of Immigration Dynamics  

Importantly, there are clear linkages between political theories described and the predicted effects on the sixth district of New Jersey. The prevalence of the New York Times nationally and within New Jersey suggests that the Latino threat narrative is very much present in the minds of voters in the district. In contrast, Asian immigration coverage should likely have limited to no effect on the voter base since that coverage does not stoke the same reactions. Lack of proximity to the U.S. border also means that the local news coverage should not have a negative bend on immigration. The high percentage of Hispanics in the district suggests frequent intergroup contact with whites, possibly leading to a negative, adversarial reaction. Although theory implies that changes in the Asian demographic does not precipitate changes in macro-partisanship, the 8.60 percentage point increase is indeed high and might not be captured by theory. The seemingly rapid change in the demographics of the district, however, do portend a more negative immigrant attitude. On the level of the immigrant, the Hispanic immigrant population likely feels threatened by the Trump administration. The 5.20 percentage point increase in the district immigrant population should also cause a greater consideration of anti-immigrant legislation.

Qualitative Testing of Immigration Dynamics

As demonstrated by the demographic data, the Asian and Hispanic populations experienced the most significant population changes in the district. Given that political theory highlights differential media coverage of these two ethnic groups, the research plan proposed will focus on reactions to media coverage. Through qualitative interviews of Asian, Asian Indian, Hispanic, and White voters in NJ-06, the study will piece together how individual-level, perceived reactions to immigration media coverage align with macro-level data. The research study will not only focus on the framing of these district ethnic communities but also if and how that influences political affiliation. In order to minimize confounding effects, the same question set will be administered to each interview candidate.

Population Characteristics of CT-4

I. Population Changes since 2009

The first slide reports changes in each race’s representation in CT-4 from 2009 to 2017. We see that CT-4’s total population grew faster than the national average at an annualized rate of 0.92%. The share of residents born abroad is both higher and grew faster in that period than the national rate, as well.

The top-line numbers in the green box give the overall percentage point changes of each race both in total and among the foreign-born population in CT-4. Among the total population , we see marginal increases in representation across all races, with whites making up a smaller share. This difference is even more pronounced among the foreign-born population; Asians and Latinos are clearly driving immigration into the district.

II. Literature review

We know that both local and national characteristics drive immigrants’ integration experiences and public image. I consider the dependent variables in turn.

Immigrant experiences: Monica McDermott coins the term “bureaucratic integration” to describe one means by which immigrants get involved with their communities. She argues that immigrants choose to get involved in organizations like schools or local policing when there is not racial animosity between them and local whites; this is more likely when local black Americans are the existing outgroup. With respect to economic integration, we can expect a causal effect of the strength of ethnic communities on labor market outcomes. Specifically, Anna Damm finds evidence in Denmark that linguistic similarities allow a higher flow of information for immigrants in “ethnic enclaves.”

Media coverage: Literature has focused on tone and prevalence of immigration coverage in the media. Branton and Dunaway (2010) find that local media in border states “generate a higher volume of articles about Latino immigration, articles featuring negative aspects of immigration, and articles regarding illegal immigration.”

Public opinion: While we have seen in class that the salience of immigration can often depend on national-level features like big news stories, local-level characteristics matter too. Immigration is a more salient issue for citizens of border areas according to Dunaway et al. (2010). Also, big demographic changes can make immigration more important to voters; Jones and Martin (2017) identify defining features of areas with a big change in the Hispanic population. At the state level, states in the 75th percentile or above in change from 1990-2010 (~375%) count, and they use a continuous measure of district-level change. They find strong relationships between “large change in Hispanic population” and “influence of candidate cues on immigration,” meaning that in such areas, Republican politicians’ restrictionist cues generate more of a response than in other areas.

III. Predictions for CT-4

With respect to immigrant experiences, we need to interview citizens and immigrants in the area to understand the salience of race in both their decisions on how to integrate into civil society, as well as the extent to which they rely on ethnic networks to get economic information. The 2017 ACS estimates that 32% of the foreign born population speaks English less than “very well”  (compared to 3.7% of the native population), suggesting that ethnic cohesion may be a relevant variable.

With respect to immigration salience, we would expect Republicans not to emphasize immigration/restrictionism because Connecticut is not a border state. While CT-4 has experienced a 3 percentage-point increase in Latino population, which is much larger than the 1.2 pp increase in the US, it does not seem to get close to the 375% increase determined by Jones and Martin (2017). Furthermore, we should expect less local media coverage, and more positive coverage, of immigration than in similar border states. We next turn to measuring this effect.

IV. Testing the effect of location

I will ask the question whether Connecticut’s status as a non-border state causes its local- and state-level media coverage of immigration to be systematically less prevalent and more positive. I will employ a matching design, whereby I identify districts that are similar to CT-4 in every conceivable way that could influence media coverage of immigration, with the only difference being that the district is in a border state. That is, I will identify border-state districts similar to CT-4 in income, (change in) racial makeup, percent foreign-born, and partisanship. On the (very strong) assumption that we have observed ALL covariates that could conceivably influence media coverage, we can estimate the causal effect of border status on media coverage. After identifying these districts, I will acquire newspaper articles using the LexisNexis database, coding articles for their topic and their sentiment. I can then test the rate of immigration-related articles as well as their positivity/negativity, to test the border-state hypothesis of Branton and Dunaway (2009).

CA27 Population Demographics

Slide 1: This slide covers the population makeup of California District 27. The foreign-born population of CA27 is fairly high, at 38.6%, compared the to national percentage at 13.7%. The largest subgroup of people in the district is white (non-Hispanic), at 39.3%, but the Asian population is close behind, at 38.5%. The Hispanic population is at 28%, still higher than the national statistic (17.6%). The smallest population group is black, at 4.5%. Ten years ago, the statistics were vastly different, in which the immigrant population was 19.7 percentage points lower than in 2017. Supporting this, the white population was much higher (16.3 pp higher) and the Asian population was much less (-26.1pp). Surprisingly, the Hispanic population was higher by 13.3 percentage points in 2007 than in 2017. Throughout the decade, there has been a steady incline of immigrants; thus, the population has morphed into one that is in higher concentration of immigrants, more specifically, the Asian population. The black and African American population stayed fairly stagnant at roughly 4%. Overall, the district has become more diverse as immigration has increased throughout the years, and has proved to house people of all origins harmoniously.

Slide 2: The second slide covers literature and research that studies the relationship between changing demographics and immigrant experiences, media coverage of immigration, and public opinion on immigration/immigrants. Daniel Hopkins, in “Politicized Places: Explaining Where and When Immigrants Provoke Local Opposition,” largely finds that as immigration increases in importance and relevance as an issue, there will be a higher chance for immigrants in an area with changing demographics to be faced with hostility from natives. He even finds that with a 8 percentage point increase in immigration, the chance of anti-immigrant proposal becoming considered doubles. Due to this, immigrant experiences may be quite negative in an area with increasing immigration, as natives become adverse with the increasing numbers. Abrajano and Hajnal, in White Blacklash: Immigration, Race, and American Politics, give reason for this in their work, stating that many see immigrants (Latino specifically) as dangerous, a burden to social welfare, and people who steal jobs from natives. Abrajano and Hajnal also study media coverage on immigration and immigrants, and conclude that the New York Times tended to cover immigration much more as the issue issue became more salient in the area. They find that the news coverage was mostly negative at 49% negative and only 12% positive and that it tended to focus on the Latino population. Branton and Dunway, in “Spatial Proximity to the U.S.-Mexico Border and Newspaper Coverage of Immigration Issues,” dove deeper into this, stating that news coverage near the border tends to focus on Latino immigration and typically feature the negative and illegal aspects of it. Media coverage affects public opinion, and Abrajano and Hajnal hypothesize that as immigration increases and a tendency for whites to view immigrants negatively, there will be white backlash and a greater support for the Republican Party. Because of this, there may be stricter immigration laws and more support for border enforcement and interior enforcement (Wong 2014). In general, there will be an increase in support for restrictive immigration laws.

Slide 3: This slide highlights the predictions that I make about district CA27 based off the literature from the previous slide. Because CA27 has increased in immigrants, we can predict that there will be white backlash and some of the immigrant population will be met with hostility. However, Abrajano and Hajnal’s findings rest on the assumption that natives view the Latino population quite negatively. The Latino population has decreased in size within the past decade, so there is no guarantee that the immigrant population in general will be met with hostility. In fact, Asian immigrants are generally seen more positively (Wong 2017) so we may see a different response than Abrajano and Hajnal have predicted. According to Abrajano and Hajnal, media coverage on immigration should be fairly negative, as the immigrant population has increased significantly. Thus, we predict that the tone of the articles should be quite hostile. Additionally, the focus should be on the Latino population. According to Abrajano and Hajnal, there should be white backlash against the increasing immigration population; however, the white population is only slightly above a third of the total population in district CA27 so there may not be backlash in the volume that Abrajano and Hajnal predict in their paper. Likewise, there should be support of the Republican Party from the white population, but due to the volume of the foreign-born population, the Democratic Party may be stronger. The chance that a restrictive immigration policy will be proposed if higher, but it will most likely not pass due to the Democratic representative and high immigrant population.

Slide 4: The last slide outlines a research plan to test the media coverage in district CA27. Since we are covering media coverage on the January government shutdown, the time period to search for articles should be within slightly before and after the shutdown. This will also give time to analyze the effects and potential backlash on the issue. Thus, the search period will be within late December and early February. Since we are searching for media on immigration, key search terms will include immigration, immigrant, border, wall, Mexico, and more. I will be judging tone based off the word choice in the articles (i.e. how they are connotated and what emotions they elicit in the reader) and whether the outlook on immigration in general is negative or positive. Framing will be determined based off whether the media is focused on a certain group of immigrants and whether they frame immigration issues as very important or minor. Lastly, I will be looking at salience of immigration by searching how many times immigration appears in a media source within a week and compare it to other topics covered by the source. The two media sources I plan to look at are NBC News Los Angeles and the Los Angeles Times. Both news sources cover the Los Angeles area and greater, which encompasses district CA27. I use both articles and videos to fully encapsulate the tone, attitudes, and framing of immigration from the media. Both are neutral or slightly left-leaning, so there should be little political bias involved.

NY 9: District Demographics

Slide 1: New York’s 9th Congressional District is approximately 33.6% white (non-Hispanic), 46.9% black, and 8.1% Asian. The Latino population is approximately 10% of the population, and the immigration population takes up 39.3% of the population (a third of which is undocumented). The median income is approximately $57,453, which places the majority of the population as either lower class or lower-middle class, and above 10% are unemployed. Before the 2010-2011 redistricting, the district with the most similar borders was District 11 (which District 9’s current congressmember, Yvette D. Clarke, represented). The borders of District 11 in 2009 and District 9 in 2019 are relatively similar, except that District 9 today extends further south to include the neighborhood of Sheepshead Bay, which is majority white. District 11 was 48% black, 24.7% white (non-Hispanic), and 4.5% Asian, as well as 12.9% Hispanic. The immigrant population was approximately 40% of the population. Post-redistricting in 2012, the demographics stood at 30.3% white, 53.3% black, 6% Asian; 10.8% Latino; and 42.6% immigrants. It should be noted that, since 2012, the immigrant population has been decreasing (by about 3.3 percentage points). Several additional features of this population are also important: first, most of the ethnic groups / immigrant groups are concentrated in enclaves. Second, the immigrant and black populations largely overlap because members of NY’s 9th Congressional District tend to be Caribbean. Finally, the Caribbean immigrant community is well established and has been constantly growing since the early 1900s.

Slide 2: There are mixed opinions on the effect of media coverage on immigration: national news sources tend to portray immigrants in a negative light (Abrajano & Hajnal 2015), but it is difficult to say what part of this is due to local population versus nationwide sentiment. Indeed, Branton and Dunaway suggest that “the size of the foreign-born population is only inconsistently related to negative news coverage of immigration.” However, Abrajano and Singh dispute this with their “audience influence hypothesis”: essentially, since media firms are for-profit, they will consider their economic situation and decide which news their audience “will respond best to. Oftentimes, this results in sensationalized news coverage, and overreporting on issues like immigration. In addition, the media will use certain, easy-to-follow themes like portraying the majority of immigrants as Latinos, or following “crime news scripts,” which portray nonwhite, especially African American actors as criminals (Abrajano & Singh 2009). In addition, Branton and Dunaway themselves suggest that proximity to the US/Mexico border causes more negative coverage, sensationalism, and exploitation of the Latino threat narrative; thus, I extrapolate that populations with more prevalent immigrant issues have more intense and negative local reporting. Public opinion is strongly affected by the media: the media “primes” the audience to respond to immigrants in a certain way, thus fueling negative opinions (Branton and Dunaway 2009). The media does this in two ways: first, through “agenda-setting” (i.e. focusing on immigration a disproportionate amount) and “framing” (i.e. portraying immigration negatively). Negative public opinion, especially from the white population, is also largely shaped by a sudden change in local demographics, like a sudden influx of immigrants (Hopkins); and the race of the immigrants, as whites tend to be less hostile towards Asian Americans and more hostile towards Latinos and blacks (Abrajano & Hanjal 2015). There is also similarly often backlash from black Americans: blacks and low-income men might see immigrants as competitors in jobs (McDermott 2013). As a result, these residents may be less likely to support pro-immigrant policies (i.e. DACA, pathways to citizenship), and more likely to support anti-immigrant policies (i.e. border enforcement). Nevertheless, negative public opinion does not necessarily equate to negative immigrant experiences. Of course, immigrants have negative experiences, which vary between immigrant groups: Asian-Americans, while able to integrate in the sense that they are seen as a “model minority and ally” to whites (Abrajano & Hajnal 2015), can have difficulty penetrating into politics (for example, consider Aptekar’s analysis of Asian Americans in Edison, a community that is successful economically, but not politically); Latinos, on the other hand, are generally treated by white Americans as threats (Abrajano & Hanjal 2015). In addition, it is difficult for immigrants to integrate into local populations: for example, although Caribbean immigrants and African-Americans are of the same “race,” Caribbean Americans tend to form their own communities, instead of integrating into current societies, if black and white racial identities are strong enough (McDermott 2013). At the same time, however, the size of the immigrant population also improves the immigrant population in meaningful ways: more settled immigrants create a better support system for immigrants first arriving to the United States. In addition, the increased size of the immigrant population confers benefits for good policies and representation, as they have become a sizeable voting body. Finally, a district with a strong democratic leaning would also be more partial to supporting permissive and pro-immigrant policies, thus improving immigrant experiences in the district (Wong 2017).

Slide 3: Considering the size of the immigrant population in NY’s 9th Congressional District, I would expect there to be a high salience of media coverage on immigration, since immigration policy is probably pertinent to the large immigrant, and especially undocumented population. In addition, since, in recent years hasn’t been a major or sudden influx of immigrants (indeed, the population of immigrants are decreasing), I’d assume that the media would not have any serious, local situation to capitalize on. negatively Indeed, since there is such a high percentage of nonwhite citizens and such a large immigrant population, local news sources may attempt to pander towards these immigrant populations instead of white citizens. Of course, this also may vary amongst neighborhoods: the immigrant enclaves, for example, may have more pro-immigrant local news; meanwhile, areas like Sheepshead Bay may have more negative local coverage. Generally, however, I expect the news to positive or neutral. The neutrality of the news, combined with the segregation of the immigrant population into enclaves, and the relative lack of “destabilizing change” in the local immigrant population would probably result in a relatively neutral opinion towards immigrants. Furthermore, the fact that 40% of the population is already immigrants (this percent would get higher if we were to count people related to immigrants as well), residents of the district would probably be sympathetic and have positive opinions in regard to new immigrants. However, complicating this is the fact that these immigrants are moving into an area that is already largely lower-income and unemployed, they may be seen as economic competitors against the local population. These negative attitudes may be exacerbated by the size of the local black population. Nevertheless, considering the establishment of the immigrant population, and the fact that the local black population largely intersects with the immigrant population, I believe that, overall, public opinion is positive. I would thus expect support for pro-immigration programs (i.e. DACA, pathways to citizenship). Positive public opinion thus results in a positive immigrant experience. First, considering the enormous size of the immigrant population (consisting of about 40% of the population), I would expect there to be adequate integration (i.e. that local immigrant populations and enclaves would help new immigrants transition into society). Second, because immigrants generate such a large voting bloc in the 9th Congressional District, I would expect good political integration: this means immigrants can elect a congressmember that supports immigration and positive and inclusive immigration policies.

Slide 4: Currently, I am asking someone who lives in the district for suggestions on popular local news sources. From what I have already researched, however, I currently have two fairly district-/borough-specific news sources. First, the Brooklyn Reporter, which has different sections for different neighborhoods; second, the New York Daily News, which is read throughout all of New York City, reports more on national news, but additionally has a Brooklyn section. From these two news sources, I will pull out articles from December 1, 2018 (slightly before the government shutdown) through January 31, 2019 (slightly after the government shutdown). I believe looking at articles around the shutdown is important because it contextualizes why the shutdown happened, and subsequently the opinions on the aftermath of the shutdown. I will primarily be looking at three aspects of news coverage: first, I will count the number of pieces on immigration during this time period and compare it against the number of total articles to see how much focus is placed upon the topic of immigration. Second, of the articles about immigration, I will look at the race and ethnicity of immigrants mentioned. Considering that the majority of immigrants in the 9th Congressional District are Afro-Caribbean, an overrepresentation of other ethnicities of immigrants in local news would demonstrate that media is focused more on sensationalized/stereotypical reporting rather than representing members of the district. Third, of the articles about immigration, I will note the number of negative “buzzwords” they use. An abbreviated list of these buzzwords include: chain migration, illegal immigrant (vs. undocumented immigrant), anchor baby, [insert color here] America. I may also attempt to imitate Abrajano & Hajnal’s experiment of ranking the tone of the articles (by recruiting a random group of people via a survey), if the buzzword check does not work out. If I have time, I would like to compare the different neighborhoods of the 9th Congressional District against each other. First, I would look for the demographics of each neighborhood (i.e. I already know that Sheepshead Bay is majority white). Then, I would find articles about immigration published in each of these neighborhoods and run the aforementioned three tests on the news articles. I would then compare the statistics against each other and see whether the demographics of the neighborhoods had any relation with positive/negative news reporting.

Texas 18th Congressional District

TX-18 slides (see these for corresponding slides to below descriptions)

Slide 1: Demographics

Between 2007 and 2017, there has been little, virtually unrecognizable, change in the demographic composition of Texas’ 18th Congressional District. The racial breakdown of the area has remained constant with it being predominantly made up of Hispanic/Latinos and African Americans. The foreign born population of the district has grown as the overall population has grown, but its proportion of the whole has remained largely unchanged. The foreign born population has been consistently made up of roughly 80% Hispanic/Latino origin individuals.


Slide 2: Existing research predicting outcomes

Extant research suggests that sudden growth of the immigrant or Hispanic population is associated with anti-immigrant views among current residents (this includes Whites as well as other racial minorities like African Americans) particularly when coupled with the issue of immigration being one that is salient at the national level which, in turn, causes people to notice and politicize changes in their area (Hopkins, 2010; Craig and Richeson, 2017). Enos (2014) goes further to suggest that even minor changes in immigrant demographics lead to exclusionary attitudes among residents. Large populations of immigrants or Latinos in general (not necessarily spikes in their numbers) are associated with Whites holding more punitive views of immigrants, being less supportive of social welfare programs, identifying as more conservative, and voting for Democrats less (Abrajano and Hajnal, 2015). Such conservative views are correlated with places than have large foreign born populations and with respondents who are White and identify as Republican, are older, and typically have lower education levels (Dunaway et al, 2010). The presence of an immigrant population is also associated with the existence of immigrant advocacy organizations who do extensive work to integrate immigrants into political and civic life, provide legal assistance, and positively influence local policy and programs concerning immigrants in local government (de Graauw, 2008; Andersen, 2008). In a similarly positive vein, immigrant populations promote Spanish news outlets which are more positive and informative about immigration, which engenders more positive views among their audience and is beneficial to the community of Spanish-speaking immigrants and Latinos (Abrajano and Singh, 2008). Conversely, mainstream news outlets typically house much anti-immigrant sentiment, particularly those in border states, which spurs similar tones in their audience and is ultimately bad for immigrants (Branton, 2009). Ultimately, these outcomes present a mixed bag of positive and negative outcomes regarding immigrant experiences, media coverage, and public opinion.


Slide 3: Mapping outcomes onto TX-18

Given the presented research on the impacts of immigrant demographics, and the anticipation that these would present a varied assortment of outcomes, I predict a few contrasting results for TX-18. Regarding immigrant experiences, there are a wide assortment of advocacy organizations in Houston that lead me to believe that immigrants will integrate well politically in TX-18. Texas, and thus Houston, is also home to one of the largest assortments of Spanish news-media in the country (Martinez, 2016); this will lead to a high amount of more pro-immigrant sentiment which is good in and of itself but also supportive for the existing immigrant population. Regarding media coverage specifically, beyond Spanish news, since Houston is only 350 miles away from the Southern border there will likely be larger amounts of immigrant-related stories, which will be mainly negative. Regarding public opinion, since there has been no influxes of foreign born or Latino individuals, the sentiment around immigrants should have been fairly consistent over the last 10 years or so. Further, due to the continuously large Latino and foreign born populations (far above US average), these opinions are likely to be conservative and somewhat hostile towards immigrants among Whites and African Americans in TX-18. These unsympathetic views and the negative mainstream media coverage will also feed into a negative immigrant experience. These predictions, overall, stack up to paint a depressing situation for immigrants in TX-18 with their main solace being found in advocacy groups, Spanish media, and other immigrants or residents of Latino origin.


Slide 4: Research plan

I will test my hypothesis about public opinion. To do this I shall look at public opinion data to explore the prediction stemming from Hopkins work that, since the foreign born and Latino/Hispanic population has remained relatively unchanged over the past 10 years or so (2007-2017), negative attitudes towards immigrants and Latinos/Hispanics should have stayed relatively constant in that time period too. To do this I will gather public opinion data from the reputed ANES Time Series data (a longitudinal study of public opinion) from 2008, 2012, and 2016, for TX-18 congressional district. The relevant questions in this survey include: a feelings thermometer towards illegal immigrants; a feelings thermometer towards Hispanics; and the respondent’s views on immigration policy regarding citizenship, government checks, and overall policy preferences. I will then explore the bi-variate relationships between responses to these questions and the demographics of the respondents (race, age, party, education level). Following this initial analysis I will regress the question responses on the demographics aforementioned to identify any significant relationships. This will allow me to conclude whether or not the expected respondents hold conservative views, as the prior research suggests, and if these views have changed over time.

GA-1 Buddy Carter Demographics

Slide 1: GA-1 has experienced significant demographic change within the past decade. The populations of all nonwhite racial groups have risen, especially the black population. Meanwhile, the white alone population has dropped considerably. These changes are especially notable accounting for the 100,000+ increase in total population; the data suggests that this growth is comprised of primarily immigrants and minorities. The face of this district is evolving and I imagine this evolution is met with backlash from the white and native-born citizens, especially considering that the region previously lacked large populations of minorities. Even though diversity is still low, it is consistently increasing, and the change is likely noticed by locals of the district.

Slide 2: Newman and Hopkins explain that ethnic and racial demographic changes result in negative reactions from locals experiencing the change in their communities. But these responses depend on the saliency of media and how media portrays the demographic change and immigration. Media plays a crucial role in how people perceive the events occurring not only on a national scale but in their own communities. I expect that well-circulated, national news is salient in most communities because of the increased accessibility of information within the past decade alone. If media frequently frames immigrants negatively and as Latinos, then communities experiencing growth in ethnic and racial populations that were previously very small will react with hostility either through political action or social exclusion according to much of the existing research.

Slide 3: I based my predictions off of the significant demographic change in GA-1 and the conclusions of the existing research. I also had to conclude that national media and the how it frequently depicts immigrants as Latino and threatening permeates local regions across the country. One can confidently make this assumption because of the prominence of these portrayals in major news source according to Farris and Abrajano and Hajnal and because of the ease with which people can consume news and information in the recent growth of internet access and social media. As I explained in the previous assignment, GA-1 is a conservative and consistently Republican district with a representative who is most likely to support restrictionist and exclusionary immigration policy. Therefore, the hostility, fearful attitudes, and negative framing by local media may be exacerbated compared to other districts that are more liberal.

Slide 4: I have chosen to analyze three prominent local news sources in GA-1. Two are newspapers for the largest metropolitan areas that deliver news both in print and online to reach a larger audience. The third is a cable news station that broadcasts to a large, populous part of GA-1 and also provides articles online. Analyzing these specific mediums will allow me to gauge how news about immigration is delivered and received for most of the district. As a result, I will be able to make accurate assumptions about the media impact local attitudes and political actions. Finding ways to assess how the local media frames immigration and the tone used will be crucial in the next steps. I believe I can identify framing and tone by identifying commonly used words and phrases like “crime” and “Latino immigrant” and salient attitudes ideologies of exclusion and fear.

Michigan District 8 Demographics

Michigan’s 8th District now includes parts of Ingham county, Livingston county, and most of Oakland county. The area encompasses stretches of rural communities and farmland, affluent suburbs, Michigan State University, and sections of the state’s capital Lansing. These 4 slides will analyze the demographic makeup of the district, existing literature on the relationship between demographics and immigration policy, media, and experience, and use that literature to predict future findings about the district. The demographics we will analyze are based on US Census Data, and the years in which it is available for the geographic areas in question.  2007 and 2017 are both pulled from a 1-year estimate of the district population; 2012 data is a 3-year estimate because a 1-year estimate was not available. Data for specific counties was available for 2010 and 2017 for some counties, and only 2010 for others.

District 8 is a wealthy, mostly white district which has become increasingly racially diverse in the past decade; but its demographic changes have varied greatly between counties. In 2007, the district was 89% white, 3.9% Latino,4.6% Black, 2.4% Asian, and 4.9% foreign born. At the time, the district included Shiawassee and Clinton counties (both of which were 97% white in 2010), but in 2012 redistricting removed those counties and added more area in Oakland county (which was 96% white in 2010). After this redistricting occurred, in 2012, district 8 was 86.6% white, 4.5% Latino, 5.6% Black, 3.6% Asian, and 6.8% foreign born. This constituted a .6 percentage point increase in the Latino population and .8 percentage point increase in the Asian population; and a 2 percentage point increase in the foreign born population.  This increase could have been partially due to the redistricting, but the slight increase in Black, Latino, Asian, and foreign born populations continued. In 2017 district 8 was 85% white, 5% Latino, 6% Black, 4.4% Asian, and 8.6% foreign born (a .4 percentage point increase from the Latino population in 2012; a .8 percentage point increase from the Asian population; and a 1.8 percentage point increase in the foreign born population). From these trends we conclude that originally very small Latino, Asian, and foreign born populations were increasing. 50% of these immigrants identified as Asian, 14% were Latino. It’s important to note the actual number of whites in the district may be skewed, since Lansing was a popular destination for Syrian refugees during this period, and the census would have forced these groups to identify as either “white” or “Asian.”  The geographic distribution of these demographic changes has also varied greatly between counties and even within them. Ingham County was 75% white (2017); Oakland 75% (2017); Livingston county was 96.7% white in 2010 and was likely in that range by 2017 to enable the 85% white statistic for the district as a whole. Latino, Black, and Asian populations have risen around 3 percentage points each from 2010 to 2017 in Ingham County; while only Asian populations have risen over 1 percentage point in Oakland County. Both counties have foreign-born populations above the district average (8.9 and 13.5% respectively (2017)). Even within Ingham county itself, the city of Lansing was 55.5% Non-Hispanic white, 23.7% African American, 3.7% Asian, and 12.5% Latino in 2010, while the rural town of Mason was 90.2% White, 5.9% African American, 0.9% Asian, and 3.7% Latino that same year.


There is extensive literature attempting to delineate the relationship between demographics, public opinion towards immigration, immigrant portrayal in the media, and immigrant experience. Literature suggests that higher % of immigrant and Latino populations correlates to more accepting policies supported, but that if the Latino population is rising in a Republican district it will provoke a backlash–or that the presence of “outsiders,” particularly if they seek political power, may provoke a white backlash against immigration in general (Wong 2014, Enos 2014, Aptekar 2008). Specifically, Enos’ work explores whether or not direct contact with Spanish-speakers makes whites less accepting of immigrants (it appeared to do so in the short term) and Abrajano & Hajnal demonstrate that increasing Latino populations correlate to support for Republican candidates and restrictive policies at the state level (Enos 2014, Abarajano & Hajnal 2015). Other scholars have argued, however, that hostile political reactions are most likely not only when communities have increasing Latino or immigrant populations, but when salient national rhetoric then reinforces the threat by “politicizing places” (Hopkins 2010). National media coverage of immigrants in general frames immigration as a Latino threat, with a negative tone (Abrajano & Hajnal 2015). Studies have shown that increased support for Republicans and restrictive policies on the national level have followed periods of immigrant influx, media coverage, and negative statements by politicians (Abrajano & Hajnal 2015, Newman et. al 2018). Of course, the public opinion of their neighbors and the policies the majority supports impact immigrant experience directly–even just in terms of mental health, since studies suggest immigrants in majority-white high-resource places feel less integrated and hopeful than those in under-resources majority-minority places (Fernandez Kelly).  Strong advocacy networks for immigrants–such as NGOs, unions, or Democratic party strongholds–can provide avenues for increased integration, however. This can occur without the organization (for example, the Democratic party) prioritizing the needs of immigrants, as immigrants and their children take advantage of existing networks to become politically involved (Andersen 2008, de Graauw 2008). Andersen studies Lansing specifically, noting how strong interrelated networks of advocacy correlated to high integration (measured by naturalization rates, embracing of immigrants’ needs in local schools, and political representation).

These studies provide sometimes clear, sometimes ambiguous predictions for District 8.  Most clearly, the research implies that immigrants in immigrant-concentrated areas like Lansing will be even more integrated than in 2008; while immigrants in almost all-white areas like Livingston county will have more negative experiences. It also stands to reason that, like national media, local media will cover immigration mostly as a negative Latino threat. However, the literature does not predict how salient media coverage will make immigration, given the low Latino population in the district and distance from the southern border, but significant use of Latino labor in the declining agricultural industry. Most unclear are the predictions regarding public opinion of immigration. On the one hand, the Latino population is low–on the other, it is increasing in a Republican-leaning district, implying there might be a backlash according to Wong’s analysis.  The district also complicates the “contact hypothesis,” which would posit that the district has negative attitudes towards immigration since the population is increasing. But if that hypothesis is true, we would expect that the most anti-immigrant districts and cities are the ones with the fastest growing Latino populations. However, Andersen’s 2008 analysis of Lansing already shows this is not the case, and Wong’s study implies that counties with the least Latinos and immigrants will support more restrictive policies. These contradictions predict that district 8 may be highly politically polarized on immigration, and perhaps public opinion will be especially subject to influence by media and politicians.  

This provides an opportunity to reconcile Abrajano & Hajnal’s state level analysis with Hopkins’ and Newman’s national arguments about media salience.  For District 8, I hypothesize that white backlash occurs in counties like Livingston when media and politicians portray immigration as threat, and white residents use those portrayals to contextualize the increasing Latino and immigrant populations they observe in neighboring counties.  But those neighboring counties, with lower % white populations, where non-immigrants directly encounter immigrants and their descendants become involved in politics, likely support more accepting policies.

To test this hypothesis, we will examine the voting records of different counties and cities within District 8.  This will allow us to roughly measure public opinion on immigration, based on the policies advanced by different political representatives. At the very least, it will show what kinds of immigration policies non-immigrant voters found “acceptable.”  In order to “control” (loosely) for the power of party affiliation or other factors in voting, we will supplement this analysis with interviews of non-immigrant voters. These voters will come from Lansing, East Lansing, Okemos, and Mason. These Ingham county towns cover a full demographic cross-section reflecting the range in the district as a whole. These interviews will allow a non-representative, but important, qualitative analysis of voters’ opinions on immigrants and immigration. Do voters in Lansing consider the issue of immigration differently than those in Mason? When they articulate their views, do they discuss a “Latino threat?” How will Latinos, who are not immigrants themselves, discuss the issue? How will other minority populations perceive the issue? Finally, these interviews will be compared to public opinion polls if they are available at the city level.


CA 51 Population Demographics

Slide 1: The three columns in the table show the demographic information from the American Census Factfinder for 2007, 2017, and the difference within that 10-year time period. The rows were shaded blue for a decrease, and red for an increase in that subset of the population. The largest demographic change occurred in the “Hispanic and Latino of any race” category, where there was a large 10.7 pp increase from 2007 to 2017, showing that not only are they the largest ethnic group in CA 51 (70.9% of the total population in 2017), they are also the fastest growing. Every other race—white, black, Asian, and other—decreased a little over this ten year span, with the largest drop in the Asian population, which dropped by 5.5 pp. Through these comparisons we can conclude that most, if not all members of the community regularly have intergroup contact with Latinos, regardless of their own race, and Latinos have the potential to constitute one of the largest portions of the electorate. Following this idea, we examine the native and foreign-born populations. The slight increase overall in the native-born population seems correlated with the increasing Latino population, purely based off the numbers, because Latinos move from 55.6% of the native population to 66.5% of it, which is a 10.9 pp difference. In addition, in the foreign-born naturalized citizen category—that is, foreign-borns who can vote as part of the electorate—Latinos again constitute the largest portion, as 73% of that demographic. Therefore, again we see that Latinos are a dominant group in CA 51’s constituency.

Slide 2: This slide presents some main points from previous literature on how local population characteristics affect certain immigration attitudes and experiences. For immigrant experiences, Hopkins offers his “politicized places” hypothesis, arguing that anti-immigration sentiment arises only when sudden demographic change coincides with national politicization of immigration, usually mobilized by political elites. However, Wong argues that higher Latino populations are negatively correlated with support for stricter deportation enforcement. For media coverage of immigration, Branton and Dunaway find that news organizations that are closer to the border will have more articles about Latino immigration, mostly focusing on negative aspects of immigration and illegal immigrants. Abrajano and Hajnal, through a coding of the New York Times, a prominent national newspaper, find that there has been an increase in immigration coverage, mostly negative and rarely positive, particularly focusing on Latinos. This is correlated with rising white acceptance of the “threat narrative” and subsequent white backlash. Furthermore, Newman et al. find that Latino growth in communities, alongside Trump’s anti-Latino immigrant rhetoric, led to more anti-immigrant and specifically anti-Latino sentiment, as subjects had hostility toward Latinos in general, not just immigrants, likely primed by political elites in local-level demographic changes, which is in line with Hopkins’s “politicized place” hypothesis. Lastly, for public opinion on immigration, Abrajano and Hajnal find that white backlash to local demographic change leads to greater support for the Republican Party and overall restrictive immigration policies. Furthermore, Enos’s experimental study finds that exposure to and intergroup contact with Spanish-speaking confederates for just 3 days led to exclusionary immigration attitudes.

Slide 3: This slide offers my predictions for CA 51 specifically, based on the general literature review from the previous slide. The most salient demographic characteristic I kept in mind here was the large Latino population, who had also undergone a large increase between 2007 and 2017. For immigrant experiences, I hypothesized that this large Latino population increase, at the same time as Trump’s national anti-immigrant campaign in 2016, would perpetuate the “threat narrative” and increase white backlash, therefore decreases the amount of immigrant integration. Although it is difficult to say if the large Latino population would mitigate some of these harms beyond Wong’s finding that higher Latino populations are negatively correlated with support for strict deportation, the white population would likely still have hostile rhetoric and attempts at exclusive policies, based on previous literature. Without more evidence, it is inconclusive whether having a Democratic Latino MC (Juan Vargas), which perhaps reflects the large Latino voting population, would override potentially negative white sentiment, although it is a very compelling area of further research. Secondly, I predicted a large focus on immigration coverage, as CA 51 is very close to the U.S.-Mexico border, and a negative tone of news coverage, since previous studies find a prevalent threat narrative and overall negative framing of immigrants and immigrant issues, particularly Latinos. However, again, it is unclear whether these effects would be lessened, at least on the local level, by the sheer size of the Latino population, who constitute a large majority of CA 51. Lastly, I hypothesized that local public opinion and receptivity towards immigrants, particularly amongst whites, would be exclusionary and lead to more Republican support. This is because literature shows that Americans with anti-immigrant attitudes are far more supportive of the Republican Party than Americans with pro-immigrant attitudes. Therefore, the white backlash and exclusionary public opinions would likely lead to greater Republican dominance, at least among the white electorate.

Slide 4: My research plan hopes to reconcile the slight contradiction between the theory and the outcomes observed in Slide 3. Assignment 1 overwhelmingly showed that CA 51’s Democratic electorate and Democratic MC would lead to pro-immigration policymaking, but in this assignment, the demographic predictors of a large Latino population and large change in Latino makeup would propose anti-immigrant backlash, particularly by white constituents. Which CD characteristic is more salient in voting behavior, party or demographics? Or are we simply seeing the small white population’s median voter outweighed by the overwhelming Latino population, which is usually more supportive of Democrats in general? Through an analysis of public opinion survey data on immigration, I want to examine this question and specifically CA 51’s attitudes toward immigration. Using the 2018 National Election Panel Study (NEPS), I plan on focusing on these example questions of interest, which I feel would capture the spirit of constituents toward immigration. After subsetting for CA 51 respondents to these questions, I hope to compare raw numbers in addition to running regressions based on comparisons between race and party identification. If time allows, I may also compare views on immigration in the CD compared to CA overall (or perhaps just Southern California, since California is quite large and has a range of opinions), or even the national views.

California 40

California’s 40th congressional district contains the areas of Downey, Mayhood, Vernon, East Los Angeles, Los Angeles, Bell, Bell Gardens, and more. It’s a mainly Hispanic district with very few whites. In the last ten years, the Hispanic population has increased by 7.3 percentage points while the white population has decreased by 5.2 percentage points. Interestingly the second largest population is “other” which has increased by 3.2 percentage points. The foreign-born population has decreased by 5.6 percentage points but the foreign-born citizens have remained relatively the same.

Fernandez-Kelly (2019) tests the coping strategies of immigrant youth in Princeton and Trenton. She found that while Princeton has great resources for immigrant youth as opposed to Trenton, immigrant youth feel a better sense of belonging in Trenton because there is a larger immigrant population. This means that a larger Latino presence can create a feeling of belonging to other Latino immigrants which can help them socially integrate better. Abrajano and Singh (2009) test the difference in English and Spanish news coverage of immigration. They find that Spanish news has more pro-immigration attitudes and less anti-immigration attitudes. Also, Spanish news portrays illegal immigration to be beneficial to the economy. Farris and Silber Mohamed (2018) tests how national media portrays immigration by looking at how news story photos portray immigration negatively. They found that these images reinforce the Latino threat narrative by portraying immigrants as criminals or not integrating into society. Abrajano and Hajnal (2015) test the consequences of negative attitudes towards immigration. They find that white backlash could be due to a large Hispanic population and interaction making them think immigration is a serious issue. Hopkins (2010) tests why Americans connect local changes to national anti-immigration attitudes. He finds that when there’s a large increase of immigration population at the same time as national salient immigration rhetoric, negative attitudes towards immigration increases.

Based on the literature, I predict that California 40’s large Hispanic population is more likely to create a feeling of belonging and immigrants will be able to socially integrate better. California 40 has a large Hispanic/Latino population which may make other Latinos feel more welcomed and belonging and will allow them to integrate to society better. I also predict that the local Spanish news media in California 40 are more likely to portray immigration as beneficial to the economy which will make Spanish-speakers have more positive views on immigration. However, I predict that the non-Spanish speaking community is more likely to have negative views on immigration because of the Latino threat narrative on English national news outlets. I predict that the whites in California 40 are more likely to think immigration is a serious issue because of their interaction with a large Hispanic/Latino population. I also predict that there is more likely to be negative attitudes toward Latino immigrants in California 40 due to an increase of Latino immigration and the high immigration salience on national news.

I will be testing my prediction on immigrant experiences because in California 40, there is not a lot of immigration help but there is a lot of immigrants so, I’m curious to know about their experience integrating. I will reach out to one of the only immigration help organizations, the Coalition of Humane Immigrant Rights (CHIRLA) in South Los Angeles, and try to interview a staff member. I will ask them a series of questions including: what are immigrants biggest struggle in South LA? In your opinion, do the social class differences in South LA impede the integration of immigrants? On a scale of 1 to 10, how welcomed do immigrants feel in South LA, 10 being very welcomed. What can be done to make immigrants feel more welcomed? I think that these questions will let me know how immigrants in California 40 feel in their district as well as how they think others feel about them. It will let me know if having a large Hispanic/Latino population benefits their social integration.


« Older posts Newer posts »

The McGraw Center for Teaching and Learning
328 Frist Campus Center, Princeton University, Princeton, NJ 08544
PH: 609-258-2575 | FX: 609-258-1433
mcgrawect@princeton.edu

A unit of the Office of the Dean of the College

© Copyright 2025 The Trustees of Princeton University

Accessiblity | Privacy notice