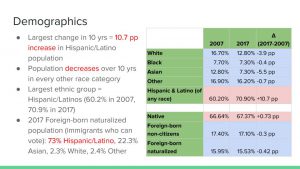
Slide 1: The three columns in the table show the demographic information from the American Census Factfinder for 2007, 2017, and the difference within that 10-year time period. The rows were shaded blue for a decrease, and red for an increase in that subset of the population. The largest demographic change occurred in the “Hispanic and Latino of any race” category, where there was a large 10.7 pp increase from 2007 to 2017, showing that not only are they the largest ethnic group in CA 51 (70.9% of the total population in 2017), they are also the fastest growing. Every other race—white, black, Asian, and other—decreased a little over this ten year span, with the largest drop in the Asian population, which dropped by 5.5 pp. Through these comparisons we can conclude that most, if not all members of the community regularly have intergroup contact with Latinos, regardless of their own race, and Latinos have the potential to constitute one of the largest portions of the electorate. Following this idea, we examine the native and foreign-born populations. The slight increase overall in the native-born population seems correlated with the increasing Latino population, purely based off the numbers, because Latinos move from 55.6% of the native population to 66.5% of it, which is a 10.9 pp difference. In addition, in the foreign-born naturalized citizen category—that is, foreign-borns who can vote as part of the electorate—Latinos again constitute the largest portion, as 73% of that demographic. Therefore, again we see that Latinos are a dominant group in CA 51’s constituency.
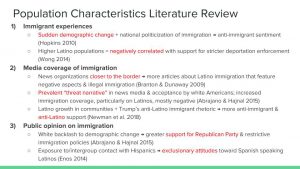
Slide 2: This slide presents some main points from previous literature on how local population characteristics affect certain immigration attitudes and experiences. For immigrant experiences, Hopkins offers his “politicized places” hypothesis, arguing that anti-immigration sentiment arises only when sudden demographic change coincides with national politicization of immigration, usually mobilized by political elites. However, Wong argues that higher Latino populations are negatively correlated with support for stricter deportation enforcement. For media coverage of immigration, Branton and Dunaway find that news organizations that are closer to the border will have more articles about Latino immigration, mostly focusing on negative aspects of immigration and illegal immigrants. Abrajano and Hajnal, through a coding of the New York Times, a prominent national newspaper, find that there has been an increase in immigration coverage, mostly negative and rarely positive, particularly focusing on Latinos. This is correlated with rising white acceptance of the “threat narrative” and subsequent white backlash. Furthermore, Newman et al. find that Latino growth in communities, alongside Trump’s anti-Latino immigrant rhetoric, led to more anti-immigrant and specifically anti-Latino sentiment, as subjects had hostility toward Latinos in general, not just immigrants, likely primed by political elites in local-level demographic changes, which is in line with Hopkins’s “politicized place” hypothesis. Lastly, for public opinion on immigration, Abrajano and Hajnal find that white backlash to local demographic change leads to greater support for the Republican Party and overall restrictive immigration policies. Furthermore, Enos’s experimental study finds that exposure to and intergroup contact with Spanish-speaking confederates for just 3 days led to exclusionary immigration attitudes.
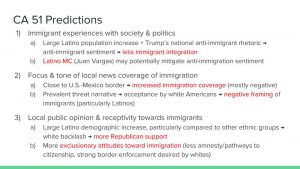
Slide 3: This slide offers my predictions for CA 51 specifically, based on the general literature review from the previous slide. The most salient demographic characteristic I kept in mind here was the large Latino population, who had also undergone a large increase between 2007 and 2017. For immigrant experiences, I hypothesized that this large Latino population increase, at the same time as Trump’s national anti-immigrant campaign in 2016, would perpetuate the “threat narrative” and increase white backlash, therefore decreases the amount of immigrant integration. Although it is difficult to say if the large Latino population would mitigate some of these harms beyond Wong’s finding that higher Latino populations are negatively correlated with support for strict deportation, the white population would likely still have hostile rhetoric and attempts at exclusive policies, based on previous literature. Without more evidence, it is inconclusive whether having a Democratic Latino MC (Juan Vargas), which perhaps reflects the large Latino voting population, would override potentially negative white sentiment, although it is a very compelling area of further research. Secondly, I predicted a large focus on immigration coverage, as CA 51 is very close to the U.S.-Mexico border, and a negative tone of news coverage, since previous studies find a prevalent threat narrative and overall negative framing of immigrants and immigrant issues, particularly Latinos. However, again, it is unclear whether these effects would be lessened, at least on the local level, by the sheer size of the Latino population, who constitute a large majority of CA 51. Lastly, I hypothesized that local public opinion and receptivity towards immigrants, particularly amongst whites, would be exclusionary and lead to more Republican support. This is because literature shows that Americans with anti-immigrant attitudes are far more supportive of the Republican Party than Americans with pro-immigrant attitudes. Therefore, the white backlash and exclusionary public opinions would likely lead to greater Republican dominance, at least among the white electorate.
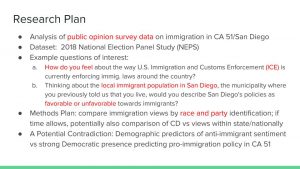
Slide 4: My research plan hopes to reconcile the slight contradiction between the theory and the outcomes observed in Slide 3. Assignment 1 overwhelmingly showed that CA 51’s Democratic electorate and Democratic MC would lead to pro-immigration policymaking, but in this assignment, the demographic predictors of a large Latino population and large change in Latino makeup would propose anti-immigrant backlash, particularly by white constituents. Which CD characteristic is more salient in voting behavior, party or demographics? Or are we simply seeing the small white population’s median voter outweighed by the overwhelming Latino population, which is usually more supportive of Democrats in general? Through an analysis of public opinion survey data on immigration, I want to examine this question and specifically CA 51’s attitudes toward immigration. Using the 2018 National Election Panel Study (NEPS), I plan on focusing on these example questions of interest, which I feel would capture the spirit of constituents toward immigration. After subsetting for CA 51 respondents to these questions, I hope to compare raw numbers in addition to running regressions based on comparisons between race and party identification. If time allows, I may also compare views on immigration in the CD compared to CA overall (or perhaps just Southern California, since California is quite large and has a range of opinions), or even the national views.
