
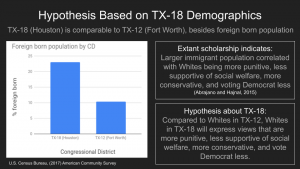
Hypothesis Based on TX-18 Demographics
Abrajano and Hajnal discussed in White Backlash (2015) that Whites who live in areas with higher immigrant populations are typically more conservative, vote Democrat less, are less supportive of general social welfare expansion, and more punitive of illegal immigrants. Based on this theory and the demographics of TX-18 – namely, that it has a large foreign born population (23% compared to the general US foreign born population of 13.5%) – I predict that TX-18 will be emblematic of this theory. To test this, I will compare the relevant views of Whites in TX-18 to those in another congressional district in Texas that has a low foreign born population. I choose to compare TX-18 (which comprises much of Houston) to TX-12 (which comprises much of Fort Worth); I made this decision because the districts were similar on covariates (besides the Fort Worth district having higher median incomes) yet had starkly different foreign born population sizes.
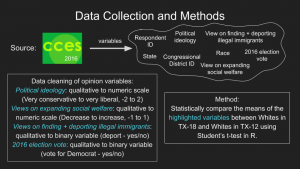
Data Collection and Methods
To test my prediction I need a big dataset that asks election/politics style questions to a large and representative audience; the CCES (Cooperative Congressional Election Study) dataverse is a great choice for this. From this dataset I pulled a total of eight variables that included relevant ID variables, the Respondent’s race, and four variables that directly related to the four public opinion focuses I am interested in exploring, given Abrajano and Hajnal’s theory, which includes the Respondent’s vote in the 2016 presidential election, their view on the expansion of social welfare, their view on finding and deporting illegal immigrants, and their political ideology. To compare TX-18 and TX-12 I will conduct a statistical contrasting of group means between the relevant focus variables of public opinion to try and detect any difference. The appropriate method for such a comparison is a Student’s t-test. This method requires quantitative data; the CCES variables I chose were coded, however, on qualitative scales. For example, the political ideology question has response options such as very conservative, slightly conservative, moderate, slightly liberal, and very liberal. I transformed this instead onto a numeric scale from -2 (very conservative) to 2 (very liberal). I similarly transformed the other variables onto numeric scales or changed them into dummy variables (for example, for the 2016 presidential election vote, I made it a binary variable for if the Respondent voted for the Democrats or not). After this data cleaning and transforming was done, I conducted a Student’s t-test in Rstudio for each of the opinion variables – i.e. I compared the average value for each opinion question between Whites in TX-18 and Whites in TX-12.
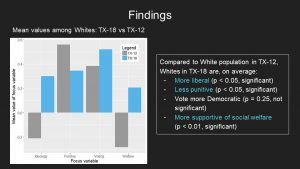
Findings
In my analysis I found multiple statistically significant differences between TX-18 and TX-12. Firstly, if we look at political ideology, we see that the average White person in TX-18 is more liberal than their counterpart in TX-12 (a difference of 0.5 points on a scale between -2 and 2), which is a statistically significant difference. Secondly, looking at punitive views concerning illegal immigrants, I found that 34% of Whites in TX-18 agree with finding and deporting illegal immigrants, compared to 56% of Whites in TX-12 (this difference is statistically significant). Thirdly, when observing 2016 voting patterns, I found that 52% of Whites in TX-18 voted Democrat compared to 38% of Whites in TX-12, however, these group values are not statistically distinguishable from one another. Finally, looking at views on social welfare (where the responses range from wishing to reduce welfare to wishing to increase it – on a scale from -1 to 1), I found that Whites in TX-18 were, on average, supportive of expanding welfare, while Whites in TX-12 were, on average, in favor of reducing it (a difference of 0.4 points on the scale, that is statistically significant). Overall, this suggests that the two districts are quite different with respect to public opinion among their White populations.
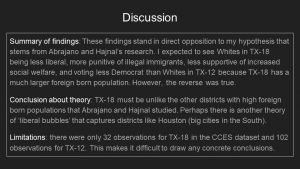
Discussion
My results are the opposite of what I had originally predicted. Based on Abrajano and Hajnal’s theory, TX-18 should have a White population that is more conservative, more punitive of illegal immigrants, more supportive of reducing social welfare, and votes Democrat less than the Whites in TX-12 – since TX-18 has a much higher foreign born population. However, as discussed, I found the opposite. Besides the voting habits between the two districts, which didn’t carry any statistical significance, TX-18 is exemplary of more liberal positions than TX-12. These findings suggest that perhaps Abrajano and Hajnal’s theory does not apply to TX-18, or perhaps even to urban congressional districts in the Southern, and more conservative, states in general. Further exploration into Southern locales would need to be done to see where Abrajano and Hajnal’s theorem holds regarding Whites’ views that are supposedly dependent on the size of the local foreign born population. One significant limitation of my study is that the CCES dataset only contained 32 observations after I restricted for Whites in TX-18 and 102 observations for those in TX-12. This calls into question the generalizability of my findings to the broader White population of TX-18 and TX-12 and, thus, the difference between the two. Further work would do well to find data sources with more observations in order to ensure the statistical rigor of further studies. In conclusion, White public opinion in TX-18 appears to be inconsistent with extant scholarship – instead of being more conservative and anti-immigrant they actually demonstrate more liberal and pro-immigrant views, as compared to Whites in an area with a lower foreign born population. This finding bodes well for the state of immigrant affairs and immigration more broadly in TX-18.
