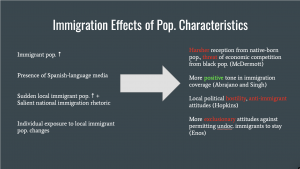
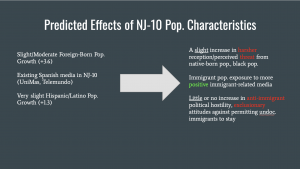
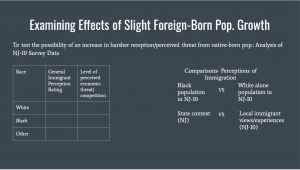
For my analysis of public survey data for Congressional District NJ-10, I expect to find that due to the recent slight growth in foreign-born and Hispanic/Latino populations, specifically of 3.6 percentage points and 1.3 percentage points respectively, native-born groups in NJ-10 will demonstrate a harsher reception towards immigrant groups and a greater perceived threat of economic competition from African Americans (McDermott, 2013). Due to increasing racial salience in the social context of an increasing immigrant population size, whites and blacks may strengthen their racial identities to set social distinctions between different immigrant groups and native-born groups (McDermott, 2013). As a result, my hypothesis predicts that examining CCES 2018 Data of public survey questions would find more immigration-restrictive responses to the immigrant-related survey questions. In addition, I will examine the possible implications of family income as an indicator of more or less support for restrictive immigration policy, predicting that those of lower class and in poverty would have less support for more restrictive policies than those of higher class.

In examining CCES 2018 polling data, I will observe the responses of NJ-10 participants towards three specific immigration questions, which will be my independent variables: CC18_322a, which involves increasing spending on border security by $25 billion, including building a wall between the U.S. and Mexico; CC18_322c, which would withhold federal funds from any local police department that does not report to the federal government anyone they identify as an illegal immigrant; and CC18_322f, which would send to prison any person who has been deported from the United States and reenters the United States. For my dependent variables, I will observe the implications of race between white and non-white residents of NJ-10, and also the possible implications of family income more broadly from the state of NJ.

For my analysis, I performed linear regression on my variables of choice using R. I created 2 tables that illustrate the relationship between race and immigration survey responses to CC18_322a, CC18_322c, and CC18_322f in NJ-10 and the relationship between family income level and immigration survey to CC18_322c in NJ as a whole. Table 1 demonstrates that for all 3 immigration survey questions related to border spending and illegal immigration, whites are slightly more likely to carry more restrictive attitudes than non-whites. Table 2 demonstrates that for immigration survey question CC18_322c, which would withhold federal funds from any local police department that does not report to the federal government anyone they identify as an illegal immigrant, NJ residents of poverty and low-income are less likely to support more restrictive illegal immigration policies than NJ residents of middle class and higher income.

For my additional analysis, I compared the p-values reported from the regression analysis in Tables 1 and 2. From both tables, only one statistic was significant, as the variable for race and immigration response to CC18_322a was statistically significant with a p-value of 0.0575. Other variables demonstrated to be statistically insignificant, so it’s possible that the correlation of family income level and restrictive immigration policies wasn’t as accurate.