Author: Amy Jeon

Juan Vargas Should Stick to the Democratic Party

Summary

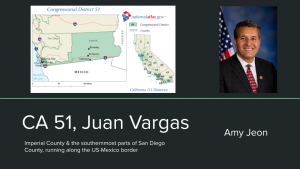
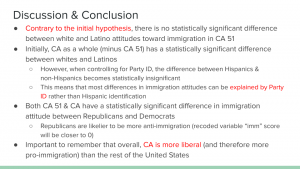
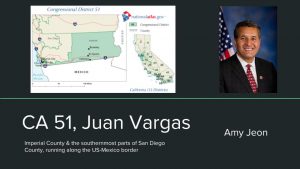
Congressional Representative Juan Vargas, who represents the southernmost parts of California along the U.S.-Mexico border, should embrace the Democratic Party’s liberal stance on immigration and continue to prioritize pro-immigration policies in order to appeal to his broad voting base. Median voter theorem tells us that representatives should appeal to the median voter in their district, which for Vargas’s case is a voter with pro-immigration views, regardless of their ethnicity or race. Therefore, Vargas would be wise in prioritizing immigration as one of his policy issues and taking a strong expansionist immigration view, keeping in line with the Democratic Party’s current stance. In truth, he is already well on his way there–his co-sponsored bills, social media, and rhetoric demonstrate a commitment to immigration that he should continue to pursue, and that the rest of the Democratic Party would do well to follow.

Op-Ed

            For a long time, immigration was seen as an issue that cross-cut traditional cleavages to create unlikely bedfellows on both sides. Daniel J. Tichenor’s 2009 article “Navigating an American Minefield: The Politics of Illegal Immigration” discusses the historical stances on immigration, as left-leaning cosmopolitans banded together with pro-business interests to support expansive immigration policies, whereas Democratic economic protectionists—namely union workers—teamed up with cultural protectionists to favor restriction of immigration numbers and rights. However, immigration has increasingly become less cross-cutting and more strictly wedded to the divisions of traditional partisanship—that is, Democrats support pro-immigrant policies, and Republicans seek to restrict immigrant freedom and entry, as recent Congressional actions and numerous political science studies find. In order to maintain their base of support, Democrats should support their party’s stance on immigration and the importance of expansion. Particularly in the case of district CA 51, which encompasses parts of San Diego and Imperial County right on the U.S.-Mexican border, Congressional Representative Juan Vargas should embrace the Democratic Party’s increasingly liberal stance on immigration and continue to prioritize pro-immigration policies in order to appeal to his broad voting base.

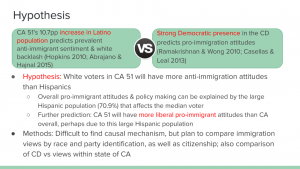
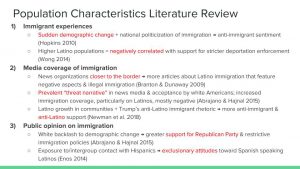
A rapidly increasing body of literature finds that Democratic districts and representatives tend to have more pro-immigration policies, whereas Republican Members of Congress are likely to espouse more anti-immigration ideals. As Tom Wong argues in his 2017 book The Politics of Immigration: Partisanship, Demographic Change, and American National Identity, partisanship has become the defining determiner of representatives’ votes on immigration. Through an examination of federal votes on immigration-related policies, Wong concludes that House Representatives’ voting records have “entrenched perception that Democratic legislators will stand on the side of more inclusive immigration reforms and against restrictive immigration policies” (Wong 15). In their 2013 paper, Jason Casellas and David Leal further develop Professor Wong’s discussion of partisanship in immigration policymaking, supporting the idea that a strong Democratic presence leads to more inclusive immigration policymaking. Through statistical analysis, Casellas and Leal find that “partisanship is the only consistent factor across votes and chambers,” and that Latino population was associated with more votes in the House compared to the Senate (Casellas & Leal 48).

Polarization between Democrats and Republicans has only been deepened by the ease with which voters can choose a side on immigration—there are starkly defined lines between the two parties, and therefore the choice for many Americans is clear. However, in an ideal world, the Republican Party would also embrace immigration and the benefits that immigrants bring to American society. Beyond the incommensurable benefits of diversity of cultures and backgrounds for natives and nonnatives alike, immigrants also produce tangible economic benefits. In their 1995 study, economists Rachel M. Friedberg and Jennifer Hunt find that contrary to popular belief, empirical evidence does not support the idea that “immigrants have a large adverse impact on the wages and employment opportunities of the native-born population of the receiving country.” Natives do not suffer significantly due to increased immigration, even when they have closely related or substitutable fields of work. Additionally, a 1994 report by Michael E. Fix and Jeffrey S. Passel finds that contrary to public perception, immigrants pay significantly more in taxes than they receive in services. However, if the Republican Party is unwilling to accept these truths, the Democratic Party and its representatives would do well to hold even more firmly to their expansionist immigration views, and uphold them proudly. The cost of increased polarization pales in comparison to the human dignity of immigrants and the benefits they and their host country would receive as a result.

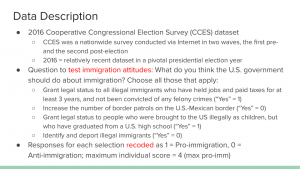
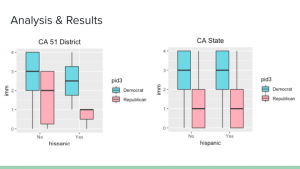
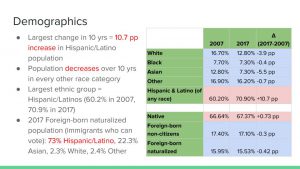
These increasingly entrenched immigration stances create an action plan for Representative Juan Vargas that emphasizes pro-immigration attitudes and a prioritization of immigration issues in his policy and platforms. Representative Vargas’s median voter is pro-immigration, and the median voter theorem proposes that representatives should cater to the district’s median voter preferences in order to capture the broadest possible base of support. CA 51’s median voter is Hispanic, as the district boasts a Hispanic population of 70.9% and a substantial 10.7 pp growth in the Hispanic population over the past 10 years. According to a 2008 Pew Research study by Lopez and Minushkin, Hispanic voters traditionally favor the Democratic Party and its pro-immigration policies. Furthermore, Professor Wong’s 2014 paper “The Politics of Interior Immigration Enforcement” found that higher Latino populations are negatively correlated with support for increased interior enforcement. Secondly, in my own initial research, utilizing the 2016 Cooperative Congressional Election Survey (CCES) dataset, I found that regardless of ethnicity, residents of CA 51 have positive pro-immigration views, since there is no statistically significant difference between Latino and non-Latino attitudes toward immigration. It is therefore in CA 51 and Representative Vargas’s best interests to represent the median pro-immigrant constituent.

In truth, Representative Vargas already has quite a stellar record on these fronts. The largest percentage of his sponsored and co-sponsored bills—19% of them—is on the topic of immigration. Immigration is a clear priority for him, evident from his social media cover photos and website that emphasize solidarity with DREAMers and immigrant veterans. Furthermore, a large 15% of his total tweets from January to March of this year were about immigration, and 100% of them adopted a positive tone about immigration. In speaking to news outlets, he also frequently underlines his commitment to immigration reform, stating that “comprehensive immigration reform will improve border security while treating immigrants with human decency” in a recent interview with the San Diego Union Tribune.

America may no longer be the land of cross-cutting cleavages, where Democrats and Republicans can stand together on the issue of immigration, depending on what interests they pursue and prioritize. However, this is not necessarily a bad phenomenon. Rather, Democrats and Democratic representatives should hold the ideals of pro-immigration ever more strongly, and follow the example of Members of Congress like Representative Juan Vargas, who should continue to pursue pro-immigrant policies in order to appeal to his expansionist voting constituents.

Assignment 3: CA 51

Slide 1:

This first slide shows two theories that at first glance appear to be conflicting. The demographic information—namely, CA 51’s 10.7 pp increase in Latino population over the past ten years—predicts prevalent anti immigrant sentiment and white backlash, according to Hopkins 2010 and Abrajano & Hajnal 2015, whereas the strong Democratic presence and consistently re-elected Democratic MC would predict pro-immigration attitudes, from Ramakrishnan & Wong 2010 and Casellas & Leal 2013. However, I attempt to reconcile these two schools of thought by my hypothesis, which predicts that white voters in CA 51 will have more anti-immigration attitudes than Hispanics, but overall pro-immigrant attitudes and policy making can be explained by the large Hispanic population that shifts the median voter substantially. Furthermore, I test my prediction that CA 51 will have more liberal pro-immigrant attitudes than CA overall, perhaps due to this large Hispanic population, though the causal mechanism is difficult to test. I also outline my precise comparison plan for the regressions I will do.

Slide 2:

This slide describes the dataset I utilized, the questions I honed in on, and how I recoded the responses. I utilized the 2016 Cooperative Congressional Election Survey (CCES) dataset, because 2016 was a relatively recent dataset that occurred in a pivotal presidential election year, and CCES itself had a large sample size for my district and CA overall. The question I used to estimate immigration attitudes for each observation was, “What do you think the U.S. government should do about immigration? Choose all those that apply” and I picked the four options that seemed most relevant to my hypothesis. I recoded the original “Yes/No” responses into a dummy variable with 1 being the pro-immigrant response and 0 being the anti-immigrant responses. I did not make all “Yes” responses equal to 1 because for some questions, “Yes” would be anti-immigrant—for instance, the question of whether the government should “identify and deport illegal immigrants.” As such, I created a new variable, called “imm,” that aggregated participants’ immigration attitudes from each question into a five-point scale, with 0 being the lowest possible score (maximally anti-immigrant) and 4 being the highest (maximally pro-immigrant).

Slide 3:

This slide shows the preliminary results for the district (CA 51) side-by-side with the state (CA) data. Although initially I considered inserting my regression tables, with the various regressions that I ran to test the statistical significance of my predictions, I decided that these boxplots provided the most parsimonious and descriptive representation of my findings. These boxplots show the immigration attitude score (variable = imm) on the y-axis, and whether or not the respondent was Hispanic (variable = hispanic) on the x-axis. The boxes are further divided by Party ID, with Democrats in blue and Republicans in red. For both CA 51 and CA state, Democrats consistently have a higher immigration score (that is, more pro-immigrant attitudes) than Republicans. Additionally, more surprisingly for my hypothesis, there is no statistically significant difference between Hispanics and non-Hispanics in CA 51, according to the regression I ran. There is a slight difference for CA state—moving from non-Hispanic to Hispanic is correlated with a 0.128 unit increase in pro-immigration attitude that is statistically significant at the 0.1 level (p-value = 0.08), but this effect becomes statistically insignificant after controlling for Party ID. Another peripheral but still interesting finding is that in CA 51, first generation and third generation immigrants were less likely to support immigrants than non-citizens, and for CA state, immigrant citizens, second generation, and third generation immigrants are less likely to be pro-immigrant than immigrant non-citizens.

Slide 4:

This slide contains my discussion and concluding takeaway points from my public opinion poll analysis. A key point is that, contrary to my initial hypothesis, there is actually no statistically significant difference between Hispanic and non-Hispanic attitudes toward immigration in my district, CA 51. I posit that this is likely because non-Hispanic residents in CA 51 come into contact with Hispanic residents so frequently that it is unlikely one would stay if that person possessed anti-immigrant sentiment, which is frequently conflated with anti-Latino sentiment as a whole. However, this prediction is difficult to actually test with the data I have, so this remains an initial theory. Interestingly, in contrast, CA as a whole (minus CA 51) initially appears to have a statistically significant difference between whites and Latinos. However, when controlling for Party ID, the difference between Hispanics and non-Hispanics becomes statistically insignificant—that is, most differences in immigration attitudes can be explained by Party ID rather than Hispanic identification. This is further bolstered by the finding from a regression of immigration attitude on Party ID that both CA 51 and CA state have a statistically significant difference in immigration attitudes between Republicans and Democrats, with Republicans likelier to be more anti-immigrant. Lastly, one important idea to remember throughout this analysis is the fact that CA is a relatively liberal state on the whole, and therefore more pro-immigration than the rest of the United States, so the external validity of this study is smaller and these findings are less applicable to America as a whole.

Racial Profiling of Latinos & Questions of Citizenship

This NYTimes article, written on February 14th, 2019, reminded me of the lecture from Monday, where Professor Jones presented compelling research on status misattribution and immigrant innumeracy. He and his colleague found through a panel data survey that American whites significantly overstate the size of the unauthorized Latino population, and in turn, Latinos pick up the signal about status innumeracy and believe white judgment is even worse than it actually is. In this news article, two women are detained by a border patrol agent in Montana for speaking Spanish, even though they were both born in the States. The ACLU has brought their case before the court, and accused the border agent who claimed that the women’s accents were “very strong” and he stopped them, not because they were Latina, but because they were “speaking Spanish in the store in a state where it is predominantly English speaking.” The women’s citizenship statuses were brought into question purely due to their language and the border agent’s white perception.

Discussion Question: How might white and Latino experiences of status misattribution affect their perceptions of legitimacy and citizenship, particularly in their voting behavior?

CA 51 Population Demographics

Slide 1: The three columns in the table show the demographic information from the American Census Factfinder for 2007, 2017, and the difference within that 10-year time period. The rows were shaded blue for a decrease, and red for an increase in that subset of the population. The largest demographic change occurred in the “Hispanic and Latino of any race” category, where there was a large 10.7 pp increase from 2007 to 2017, showing that not only are they the largest ethnic group in CA 51 (70.9% of the total population in 2017), they are also the fastest growing. Every other race—white, black, Asian, and other—decreased a little over this ten year span, with the largest drop in the Asian population, which dropped by 5.5 pp. Through these comparisons we can conclude that most, if not all members of the community regularly have intergroup contact with Latinos, regardless of their own race, and Latinos have the potential to constitute one of the largest portions of the electorate. Following this idea, we examine the native and foreign-born populations. The slight increase overall in the native-born population seems correlated with the increasing Latino population, purely based off the numbers, because Latinos move from 55.6% of the native population to 66.5% of it, which is a 10.9 pp difference. In addition, in the foreign-born naturalized citizen category—that is, foreign-borns who can vote as part of the electorate—Latinos again constitute the largest portion, as 73% of that demographic. Therefore, again we see that Latinos are a dominant group in CA 51’s constituency.

Slide 2: This slide presents some main points from previous literature on how local population characteristics affect certain immigration attitudes and experiences. For immigrant experiences, Hopkins offers his “politicized places” hypothesis, arguing that anti-immigration sentiment arises only when sudden demographic change coincides with national politicization of immigration, usually mobilized by political elites. However, Wong argues that higher Latino populations are negatively correlated with support for stricter deportation enforcement. For media coverage of immigration, Branton and Dunaway find that news organizations that are closer to the border will have more articles about Latino immigration, mostly focusing on negative aspects of immigration and illegal immigrants. Abrajano and Hajnal, through a coding of the New York Times, a prominent national newspaper, find that there has been an increase in immigration coverage, mostly negative and rarely positive, particularly focusing on Latinos. This is correlated with rising white acceptance of the “threat narrative” and subsequent white backlash. Furthermore, Newman et al. find that Latino growth in communities, alongside Trump’s anti-Latino immigrant rhetoric, led to more anti-immigrant and specifically anti-Latino sentiment, as subjects had hostility toward Latinos in general, not just immigrants, likely primed by political elites in local-level demographic changes, which is in line with Hopkins’s “politicized place” hypothesis. Lastly, for public opinion on immigration, Abrajano and Hajnal find that white backlash to local demographic change leads to greater support for the Republican Party and overall restrictive immigration policies. Furthermore, Enos’s experimental study finds that exposure to and intergroup contact with Spanish-speaking confederates for just 3 days led to exclusionary immigration attitudes.

Slide 3: This slide offers my predictions for CA 51 specifically, based on the general literature review from the previous slide. The most salient demographic characteristic I kept in mind here was the large Latino population, who had also undergone a large increase between 2007 and 2017. For immigrant experiences, I hypothesized that this large Latino population increase, at the same time as Trump’s national anti-immigrant campaign in 2016, would perpetuate the “threat narrative” and increase white backlash, therefore decreases the amount of immigrant integration. Although it is difficult to say if the large Latino population would mitigate some of these harms beyond Wong’s finding that higher Latino populations are negatively correlated with support for strict deportation, the white population would likely still have hostile rhetoric and attempts at exclusive policies, based on previous literature. Without more evidence, it is inconclusive whether having a Democratic Latino MC (Juan Vargas), which perhaps reflects the large Latino voting population, would override potentially negative white sentiment, although it is a very compelling area of further research. Secondly, I predicted a large focus on immigration coverage, as CA 51 is very close to the U.S.-Mexico border, and a negative tone of news coverage, since previous studies find a prevalent threat narrative and overall negative framing of immigrants and immigrant issues, particularly Latinos. However, again, it is unclear whether these effects would be lessened, at least on the local level, by the sheer size of the Latino population, who constitute a large majority of CA 51. Lastly, I hypothesized that local public opinion and receptivity towards immigrants, particularly amongst whites, would be exclusionary and lead to more Republican support. This is because literature shows that Americans with anti-immigrant attitudes are far more supportive of the Republican Party than Americans with pro-immigrant attitudes. Therefore, the white backlash and exclusionary public opinions would likely lead to greater Republican dominance, at least among the white electorate.

Slide 4: My research plan hopes to reconcile the slight contradiction between the theory and the outcomes observed in Slide 3. Assignment 1 overwhelmingly showed that CA 51’s Democratic electorate and Democratic MC would lead to pro-immigration policymaking, but in this assignment, the demographic predictors of a large Latino population and large change in Latino makeup would propose anti-immigrant backlash, particularly by white constituents. Which CD characteristic is more salient in voting behavior, party or demographics? Or are we simply seeing the small white population’s median voter outweighed by the overwhelming Latino population, which is usually more supportive of Democrats in general? Through an analysis of public opinion survey data on immigration, I want to examine this question and specifically CA 51’s attitudes toward immigration. Using the 2018 National Election Panel Study (NEPS), I plan on focusing on these example questions of interest, which I feel would capture the spirit of constituents toward immigration. After subsetting for CA 51 respondents to these questions, I hope to compare raw numbers in addition to running regressions based on comparisons between race and party identification. If time allows, I may also compare views on immigration in the CD compared to CA overall (or perhaps just Southern California, since California is quite large and has a range of opinions), or even the national views.

CA 51: Juan Vargas

LINK TO SLIDES

CA 51: Juan Vargas

Amy Jeon

Slide 1:

This slide shows the election results for Congressional District CA 51 from 2008 to 2018. CA 51 contains Imperial County and the southernmost parts of San Diego County along the US-Mexico border, and is represented by Juan Vargas. Vargas has been in this office since the 2012 election, after former Democrat incumbent Representative Bob Filner resigned in order to run for (and become) San Diego mayor. CA 51 is a safely Democratic district, and has not had a Republican representative since 2003. In fact, Vargas has won each of his elections with a supermajority, thrice with over 70% support and once with 68.8% support. This is Representative Vargas’s sixth year and fourth term in office.


Slide 2:

I have chosen to focus on 3 main findings from existing literature about how local electoral context and MC characteristics generally affect immigration policymaking. The first is that a district with a higher Hispanic population has a higher likelihood of pro-immigrant policies (Wong 2014). Following the delegate model, in which the public’s views are delegated to representatives to carry them out, a Hispanic population is likelier to be Democrat and be foreign-born themselves, and thus would support policies welcoming to immigrants. The second point is that partisanship is one of the strongest indicators of voting on immigration policy (Wong 2012; Ramakrishnan and Wong 2010; Casellas and Leal 2013; Wong 2017). Democrats are likeliest to consistently vote for less restrictive and more pro-immigration policies, while the opposite is true for Republicans. Depending on the district and MC’s party, even the mobilization of Hispanics can differ. Lastly, a higher foreign-born population is linked to a MC that is less likely to vote for a restrictive immigration policy (Wong 2017).


Slide 3:

Using the literature from the previous slide, we can now make some predictions about Representative Vargas’s voting on immigration policy, given the characteristics we know about him and his congressional district. CA 51 is 71.5% Hispanic, which is an overwhelming proportion of the district, and so Vargas will likely vote pro-immigration. The district has a 31.48% foreign born population, which is roughly half the size of the native born population (68.5%), which would probably make Vargas lean more pro-immigration, though a larger proportion of foreign born constituents would yield more definite support for pro-immigration policies. In addition, Vargas is a Democratic representative in a safely Democratic district (in the sense that it has not been Republican in the last 10 years) and this partisan influence would likely lead to pro-immigration voting. Moreover, Vargas himself is Hispanic and the child of immigrants, which would lead him to a pro-immigration stance.


Slide 4:

After making our predictions, we now test their veracity by examining Vargas’s voting and sponsorship record, tweets, interviews, and website. Overall, we can see that pro-immigration policy is indeed a priority for Vargas. 19% of his sponsored bills have been immigration related, which is the largest percentage of any topic he has sponsored. Moreover, he voted against the 2019 Government Funding Bill (HJRes 31) that would continue federal appropriations for the Department of Homeland Security and border control (Massey 2019). Turning to his public image and social media, we can see this photo of the front of his website, which reads, “Deported veterans fought for us, we must fight for them,” again demonstrating Vargas’s commitment to the immigrant community. His website does not explicitly list what issues he is currently pursuing, but his bill sponsorship and signaling paint a good picture. 15% of his total tweets from January to March 2019 were related to immigration, and 100% of them were positive, expressing frustration at Trump’s border wall and decrying the separation of children from their parents at the border. In news media, the San Diego Union Tribune quotes his statement that “comprehensive immigration reform will improve border security while treating immigrants with human decency,” which is quite self-explanatory. Lastly, though a minor point, his entire website is also available in Spanish, which is a nod to the 69% of his constituents that speak a language other than English, and the 28% that speak English “not very well,” again showing his commitment to inclusivity of the Spanish-speaking community and immigrants.

The McGraw Center for Teaching and Learning
328 Frist Campus Center, Princeton University, Princeton, NJ 08544
PH: 609-258-2575 | FX: 609-258-1433
mcgrawect@princeton.edu

A unit of the Office of the Dean of the College

© Copyright 2025 The Trustees of Princeton University

Accessiblity | Privacy notice