Slide 1:
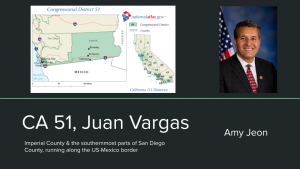
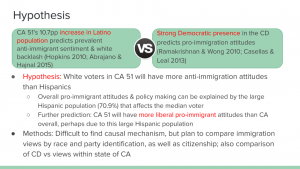
This first slide shows two theories that at first glance appear to be conflicting. The demographic information—namely, CA 51’s 10.7 pp increase in Latino population over the past ten years—predicts prevalent anti immigrant sentiment and white backlash, according to Hopkins 2010 and Abrajano & Hajnal 2015, whereas the strong Democratic presence and consistently re-elected Democratic MC would predict pro-immigration attitudes, from Ramakrishnan & Wong 2010 and Casellas & Leal 2013. However, I attempt to reconcile these two schools of thought by my hypothesis, which predicts that white voters in CA 51 will have more anti-immigration attitudes than Hispanics, but overall pro-immigrant attitudes and policy making can be explained by the large Hispanic population that shifts the median voter substantially. Furthermore, I test my prediction that CA 51 will have more liberal pro-immigrant attitudes than CA overall, perhaps due to this large Hispanic population, though the causal mechanism is difficult to test. I also outline my precise comparison plan for the regressions I will do.
Slide 2:
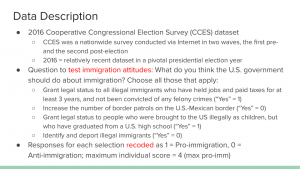
This slide describes the dataset I utilized, the questions I honed in on, and how I recoded the responses. I utilized the 2016 Cooperative Congressional Election Survey (CCES) dataset, because 2016 was a relatively recent dataset that occurred in a pivotal presidential election year, and CCES itself had a large sample size for my district and CA overall. The question I used to estimate immigration attitudes for each observation was, “What do you think the U.S. government should do about immigration? Choose all those that apply” and I picked the four options that seemed most relevant to my hypothesis. I recoded the original “Yes/No” responses into a dummy variable with 1 being the pro-immigrant response and 0 being the anti-immigrant responses. I did not make all “Yes” responses equal to 1 because for some questions, “Yes” would be anti-immigrant—for instance, the question of whether the government should “identify and deport illegal immigrants.” As such, I created a new variable, called “imm,” that aggregated participants’ immigration attitudes from each question into a five-point scale, with 0 being the lowest possible score (maximally anti-immigrant) and 4 being the highest (maximally pro-immigrant).
Slide 3:
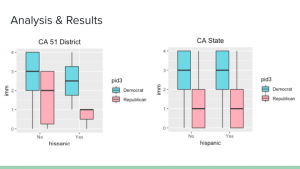
This slide shows the preliminary results for the district (CA 51) side-by-side with the state (CA) data. Although initially I considered inserting my regression tables, with the various regressions that I ran to test the statistical significance of my predictions, I decided that these boxplots provided the most parsimonious and descriptive representation of my findings. These boxplots show the immigration attitude score (variable = imm) on the y-axis, and whether or not the respondent was Hispanic (variable = hispanic) on the x-axis. The boxes are further divided by Party ID, with Democrats in blue and Republicans in red. For both CA 51 and CA state, Democrats consistently have a higher immigration score (that is, more pro-immigrant attitudes) than Republicans. Additionally, more surprisingly for my hypothesis, there is no statistically significant difference between Hispanics and non-Hispanics in CA 51, according to the regression I ran. There is a slight difference for CA state—moving from non-Hispanic to Hispanic is correlated with a 0.128 unit increase in pro-immigration attitude that is statistically significant at the 0.1 level (p-value = 0.08), but this effect becomes statistically insignificant after controlling for Party ID. Another peripheral but still interesting finding is that in CA 51, first generation and third generation immigrants were less likely to support immigrants than non-citizens, and for CA state, immigrant citizens, second generation, and third generation immigrants are less likely to be pro-immigrant than immigrant non-citizens.
Slide 4:
This slide contains my discussion and concluding takeaway points from my public opinion poll analysis. A key point is that, contrary to my initial hypothesis, there is actually no statistically significant difference between Hispanic and non-Hispanic attitudes toward immigration in my district, CA 51. I posit that this is likely because non-Hispanic residents in CA 51 come into contact with Hispanic residents so frequently that it is unlikely one would stay if that person possessed anti-immigrant sentiment, which is frequently conflated with anti-Latino sentiment as a whole. However, this prediction is difficult to actually test with the data I have, so this remains an initial theory. Interestingly, in contrast, CA as a whole (minus CA 51) initially appears to have a statistically significant difference between whites and Latinos. However, when controlling for Party ID, the difference between Hispanics and non-Hispanics becomes statistically insignificant—that is, most differences in immigration attitudes can be explained by Party ID rather than Hispanic identification. This is further bolstered by the finding from a regression of immigration attitude on Party ID that both CA 51 and CA state have a statistically significant difference in immigration attitudes between Republicans and Democrats, with Republicans likelier to be more anti-immigrant. Lastly, one important idea to remember throughout this analysis is the fact that CA is a relatively liberal state on the whole, and therefore more pro-immigration than the rest of the United States, so the external validity of this study is smaller and these findings are less applicable to America as a whole.
