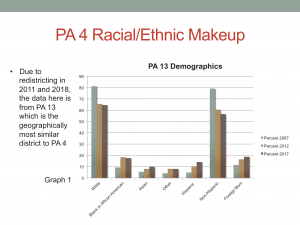
Because Pennsylvania has been redistricted in both 2011 and 2018, it has been very challenging to determine accurate historical demographic information for PA 4. Prior to 2011, the geographically closest district to PA 4 was PA 13. The new PA 4 covers almost all of the old PA 13, plus some more suburban/rural land northwest of Philadelphia. Luckily following the 2011 redistricting, PA 13 remained virtually unchanged. From 2007 to 2018 PA 13 is the closest district to PA 4, and although it is not entirely representative of the demographics, it is the best estimate given PA’s frequent redistricting. From 2007 to 2017 the white population has consistently decreased (-16.7 pp), while the Black or African American, Asian, and Hispanic populations have all increased (+8.3, +4.6, +9.3 pp respectively). The percent foreign-born population has also risen (+7.34 pp), while the non-Hispanic population went down (-22.6 pp).
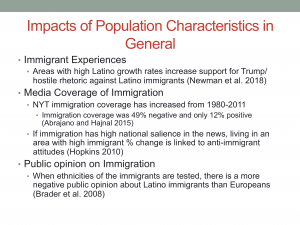
Newman et al. examined support for Trump over multiple periods of time using some of Trump’s controversial immigration comments as markers. They found that places with high Latino growth rates were more likely to support Trump. These findings likely relate to the way Trump frames his often-negative description of immigrants. As a political elite, his framing may influence his followers and potentially even prime them to view immigration as a more important issue than they would have deemed originally. In addition to Newman et al., Abrajano and Hajnal addressed how population characteristics influence perceptions on immigration. Specifically, they showed that immigration coverage has gone up over the past 30+ years and it is often negative in content. The Latino threat narrative could either cause this, or it could also be a major factor contributing to the idea. Regardless, immigrants have been discussed more often in the media, and they have been described in more negative ways. In 2010, Hopkins also found that as long as immigration has a high national salience, living where many immigrants are moving to is linked to negative attitudes about immigrants. This is a similar finding to what Newman et al. describes. The Latino population growth rate is important in understanding the native attitudes surrounding immigration. Public opinion on immigration also seems to be racially biased—in 2008 Brader et al. found that there is a more negative public opinion about Latino immigrants than European ones. This finding fits with much of the other data examined because of a larger anti-Latino threat narrative.
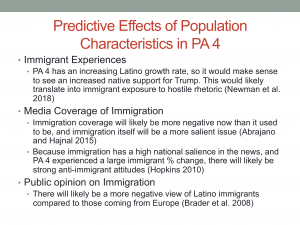
Following from the fact that PA 4’s Hispanic population has steadily increased since at least 2007, and that the % foreign-born has also increased, the literature would generally suggest negative attitudes towards immigration. More specifically, Newman et al. predicts that because PA 4 has a high Latino population growth rate over time, there could likely be increased support for Trump and propagation of his hostile anti-immigrant language. Immigration media coverage too will likely appear more negative now, while also being discussed more frequently (Abrajano and Hajnal 2015). This increased media presence paired with a growing foreign-born population could also likely result in backlash against immigration (Hopkins 2010). In addition, there will likely be a comparatively negative view against Latino immigrants than those coming from Europe (Brader et al. 2008). This is particularly relevant because the white population in PA 4 is falling, while foreign-born and Hispanic population is increasing, which could lead to decreased immigration support. Surprisingly, although the literature overwhelmingly predicts that PA 4 would have negative immigrant attitudes, the policy and strongly democratic partisan lean seems to contradict this. Although I will have a better understanding after testing these predictions specifically, it appears extremely unlikely that the district holds such negative attitudes while the MC is co-sponsoring multiple bills in support of immigration, and the fact that Montgomery County—which almost aligns exactly with PA 4—is a sanctuary area for immigrants. Although these predictions may be accurate on a national scale, I question how applicable they will be to PA 4.
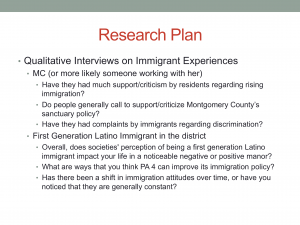
Ideally, I would secure one interview with PA 4’s MC and one interview with a first generation Latino immigrant in the district. To reach out to someone in Madeline Dean’s office, I will email and subsequently call if they are unresponsive to my email. I would explain exactly why I want to speak with them and how I am a student at Princeton University. Hopefully, they will take at least ~10 minutes to quickly answer my questions about public feedback regarding PA 4’s immigration policy. Does the MC’s office qualitatively find that people who reach out are generally in support or against the fairly pro-immigration stance by the district? Although this question would not give a definitive result in either direction because of the massive selection bias of people who make the effort to contact their local representatives, it would be fascinating to see if the public generally propagates anti-immigrant rhetoric like Newman et al would predict. In addition, in order to directly gauge first-generation immigrant experience, I want to reach out to someone who has moved to PA 4 for most of his or her lifetime. A man who lives two houses down from me is a first generation Latino immigrant, so he will be the first person I reach out to. From his experience, has he generally seen negative attitudes about immigration or has there been more widespread support? How often has he heard people repeating the negative discriminatory language used by political elites such as Trump? How has this public opinion changed over time? Based on these responses, if anti-immigration rhetoric has increased over time, then it would support the prediction that a rising Latino and foreign-born population could cause negative native attitudes on immigration.