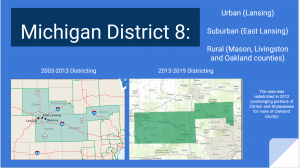
Michigan’s 8th District now includes parts of Ingham county, Livingston county, and most of Oakland county. The area encompasses stretches of rural communities and farmland, affluent suburbs, Michigan State University, and sections of the state’s capital Lansing. These 4 slides will analyze the demographic makeup of the district, existing literature on the relationship between demographics and immigration policy, media, and experience, and use that literature to predict future findings about the district. The demographics we will analyze are based on US Census Data, and the years in which it is available for the geographic areas in question. 2007 and 2017 are both pulled from a 1-year estimate of the district population; 2012 data is a 3-year estimate because a 1-year estimate was not available. Data for specific counties was available for 2010 and 2017 for some counties, and only 2010 for others.
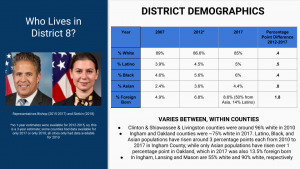
District 8 is a wealthy, mostly white district which has become increasingly racially diverse in the past decade; but its demographic changes have varied greatly between counties. In 2007, the district was 89% white, 3.9% Latino,4.6% Black, 2.4% Asian, and 4.9% foreign born. At the time, the district included Shiawassee and Clinton counties (both of which were 97% white in 2010), but in 2012 redistricting removed those counties and added more area in Oakland county (which was 96% white in 2010). After this redistricting occurred, in 2012, district 8 was 86.6% white, 4.5% Latino, 5.6% Black, 3.6% Asian, and 6.8% foreign born. This constituted a .6 percentage point increase in the Latino population and .8 percentage point increase in the Asian population; and a 2 percentage point increase in the foreign born population. This increase could have been partially due to the redistricting, but the slight increase in Black, Latino, Asian, and foreign born populations continued. In 2017 district 8 was 85% white, 5% Latino, 6% Black, 4.4% Asian, and 8.6% foreign born (a .4 percentage point increase from the Latino population in 2012; a .8 percentage point increase from the Asian population; and a 1.8 percentage point increase in the foreign born population). From these trends we conclude that originally very small Latino, Asian, and foreign born populations were increasing. 50% of these immigrants identified as Asian, 14% were Latino. It’s important to note the actual number of whites in the district may be skewed, since Lansing was a popular destination for Syrian refugees during this period, and the census would have forced these groups to identify as either “white” or “Asian.” The geographic distribution of these demographic changes has also varied greatly between counties and even within them. Ingham County was 75% white (2017); Oakland 75% (2017); Livingston county was 96.7% white in 2010 and was likely in that range by 2017 to enable the 85% white statistic for the district as a whole. Latino, Black, and Asian populations have risen around 3 percentage points each from 2010 to 2017 in Ingham County; while only Asian populations have risen over 1 percentage point in Oakland County. Both counties have foreign-born populations above the district average (8.9 and 13.5% respectively (2017)). Even within Ingham county itself, the city of Lansing was 55.5% Non-Hispanic white, 23.7% African American, 3.7% Asian, and 12.5% Latino in 2010, while the rural town of Mason was 90.2% White, 5.9% African American, 0.9% Asian, and 3.7% Latino that same year.
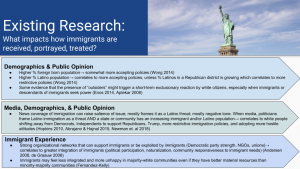
There is extensive literature attempting to delineate the relationship between demographics, public opinion towards immigration, immigrant portrayal in the media, and immigrant experience. Literature suggests that higher % of immigrant and Latino populations correlates to more accepting policies supported, but that if the Latino population is rising in a Republican district it will provoke a backlash–or that the presence of “outsiders,” particularly if they seek political power, may provoke a white backlash against immigration in general (Wong 2014, Enos 2014, Aptekar 2008). Specifically, Enos’ work explores whether or not direct contact with Spanish-speakers makes whites less accepting of immigrants (it appeared to do so in the short term) and Abrajano & Hajnal demonstrate that increasing Latino populations correlate to support for Republican candidates and restrictive policies at the state level (Enos 2014, Abarajano & Hajnal 2015). Other scholars have argued, however, that hostile political reactions are most likely not only when communities have increasing Latino or immigrant populations, but when salient national rhetoric then reinforces the threat by “politicizing places” (Hopkins 2010). National media coverage of immigrants in general frames immigration as a Latino threat, with a negative tone (Abrajano & Hajnal 2015). Studies have shown that increased support for Republicans and restrictive policies on the national level have followed periods of immigrant influx, media coverage, and negative statements by politicians (Abrajano & Hajnal 2015, Newman et. al 2018). Of course, the public opinion of their neighbors and the policies the majority supports impact immigrant experience directly–even just in terms of mental health, since studies suggest immigrants in majority-white high-resource places feel less integrated and hopeful than those in under-resources majority-minority places (Fernandez Kelly). Strong advocacy networks for immigrants–such as NGOs, unions, or Democratic party strongholds–can provide avenues for increased integration, however. This can occur without the organization (for example, the Democratic party) prioritizing the needs of immigrants, as immigrants and their children take advantage of existing networks to become politically involved (Andersen 2008, de Graauw 2008). Andersen studies Lansing specifically, noting how strong interrelated networks of advocacy correlated to high integration (measured by naturalization rates, embracing of immigrants’ needs in local schools, and political representation).
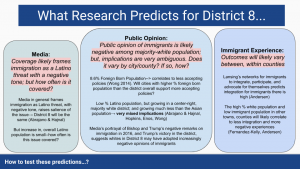
These studies provide sometimes clear, sometimes ambiguous predictions for District 8. Most clearly, the research implies that immigrants in immigrant-concentrated areas like Lansing will be even more integrated than in 2008; while immigrants in almost all-white areas like Livingston county will have more negative experiences. It also stands to reason that, like national media, local media will cover immigration mostly as a negative Latino threat. However, the literature does not predict how salient media coverage will make immigration, given the low Latino population in the district and distance from the southern border, but significant use of Latino labor in the declining agricultural industry. Most unclear are the predictions regarding public opinion of immigration. On the one hand, the Latino population is low–on the other, it is increasing in a Republican-leaning district, implying there might be a backlash according to Wong’s analysis. The district also complicates the “contact hypothesis,” which would posit that the district has negative attitudes towards immigration since the population is increasing. But if that hypothesis is true, we would expect that the most anti-immigrant districts and cities are the ones with the fastest growing Latino populations. However, Andersen’s 2008 analysis of Lansing already shows this is not the case, and Wong’s study implies that counties with the least Latinos and immigrants will support more restrictive policies. These contradictions predict that district 8 may be highly politically polarized on immigration, and perhaps public opinion will be especially subject to influence by media and politicians.
This provides an opportunity to reconcile Abrajano & Hajnal’s state level analysis with Hopkins’ and Newman’s national arguments about media salience. For District 8, I hypothesize that white backlash occurs in counties like Livingston when media and politicians portray immigration as threat, and white residents use those portrayals to contextualize the increasing Latino and immigrant populations they observe in neighboring counties. But those neighboring counties, with lower % white populations, where non-immigrants directly encounter immigrants and their descendants become involved in politics, likely support more accepting policies.
To test this hypothesis, we will examine the voting records of different counties and cities within District 8. This will allow us to roughly measure public opinion on immigration, based on the policies advanced by different political representatives. At the very least, it will show what kinds of immigration policies non-immigrant voters found “acceptable.” In order to “control” (loosely) for the power of party affiliation or other factors in voting, we will supplement this analysis with interviews of non-immigrant voters. These voters will come from Lansing, East Lansing, Okemos, and Mason. These Ingham county towns cover a full demographic cross-section reflecting the range in the district as a whole. These interviews will allow a non-representative, but important, qualitative analysis of voters’ opinions on immigrants and immigration. Do voters in Lansing consider the issue of immigration differently than those in Mason? When they articulate their views, do they discuss a “Latino threat?” How will Latinos, who are not immigrants themselves, discuss the issue? How will other minority populations perceive the issue? Finally, these interviews will be compared to public opinion polls if they are available at the city level.
