
Caption
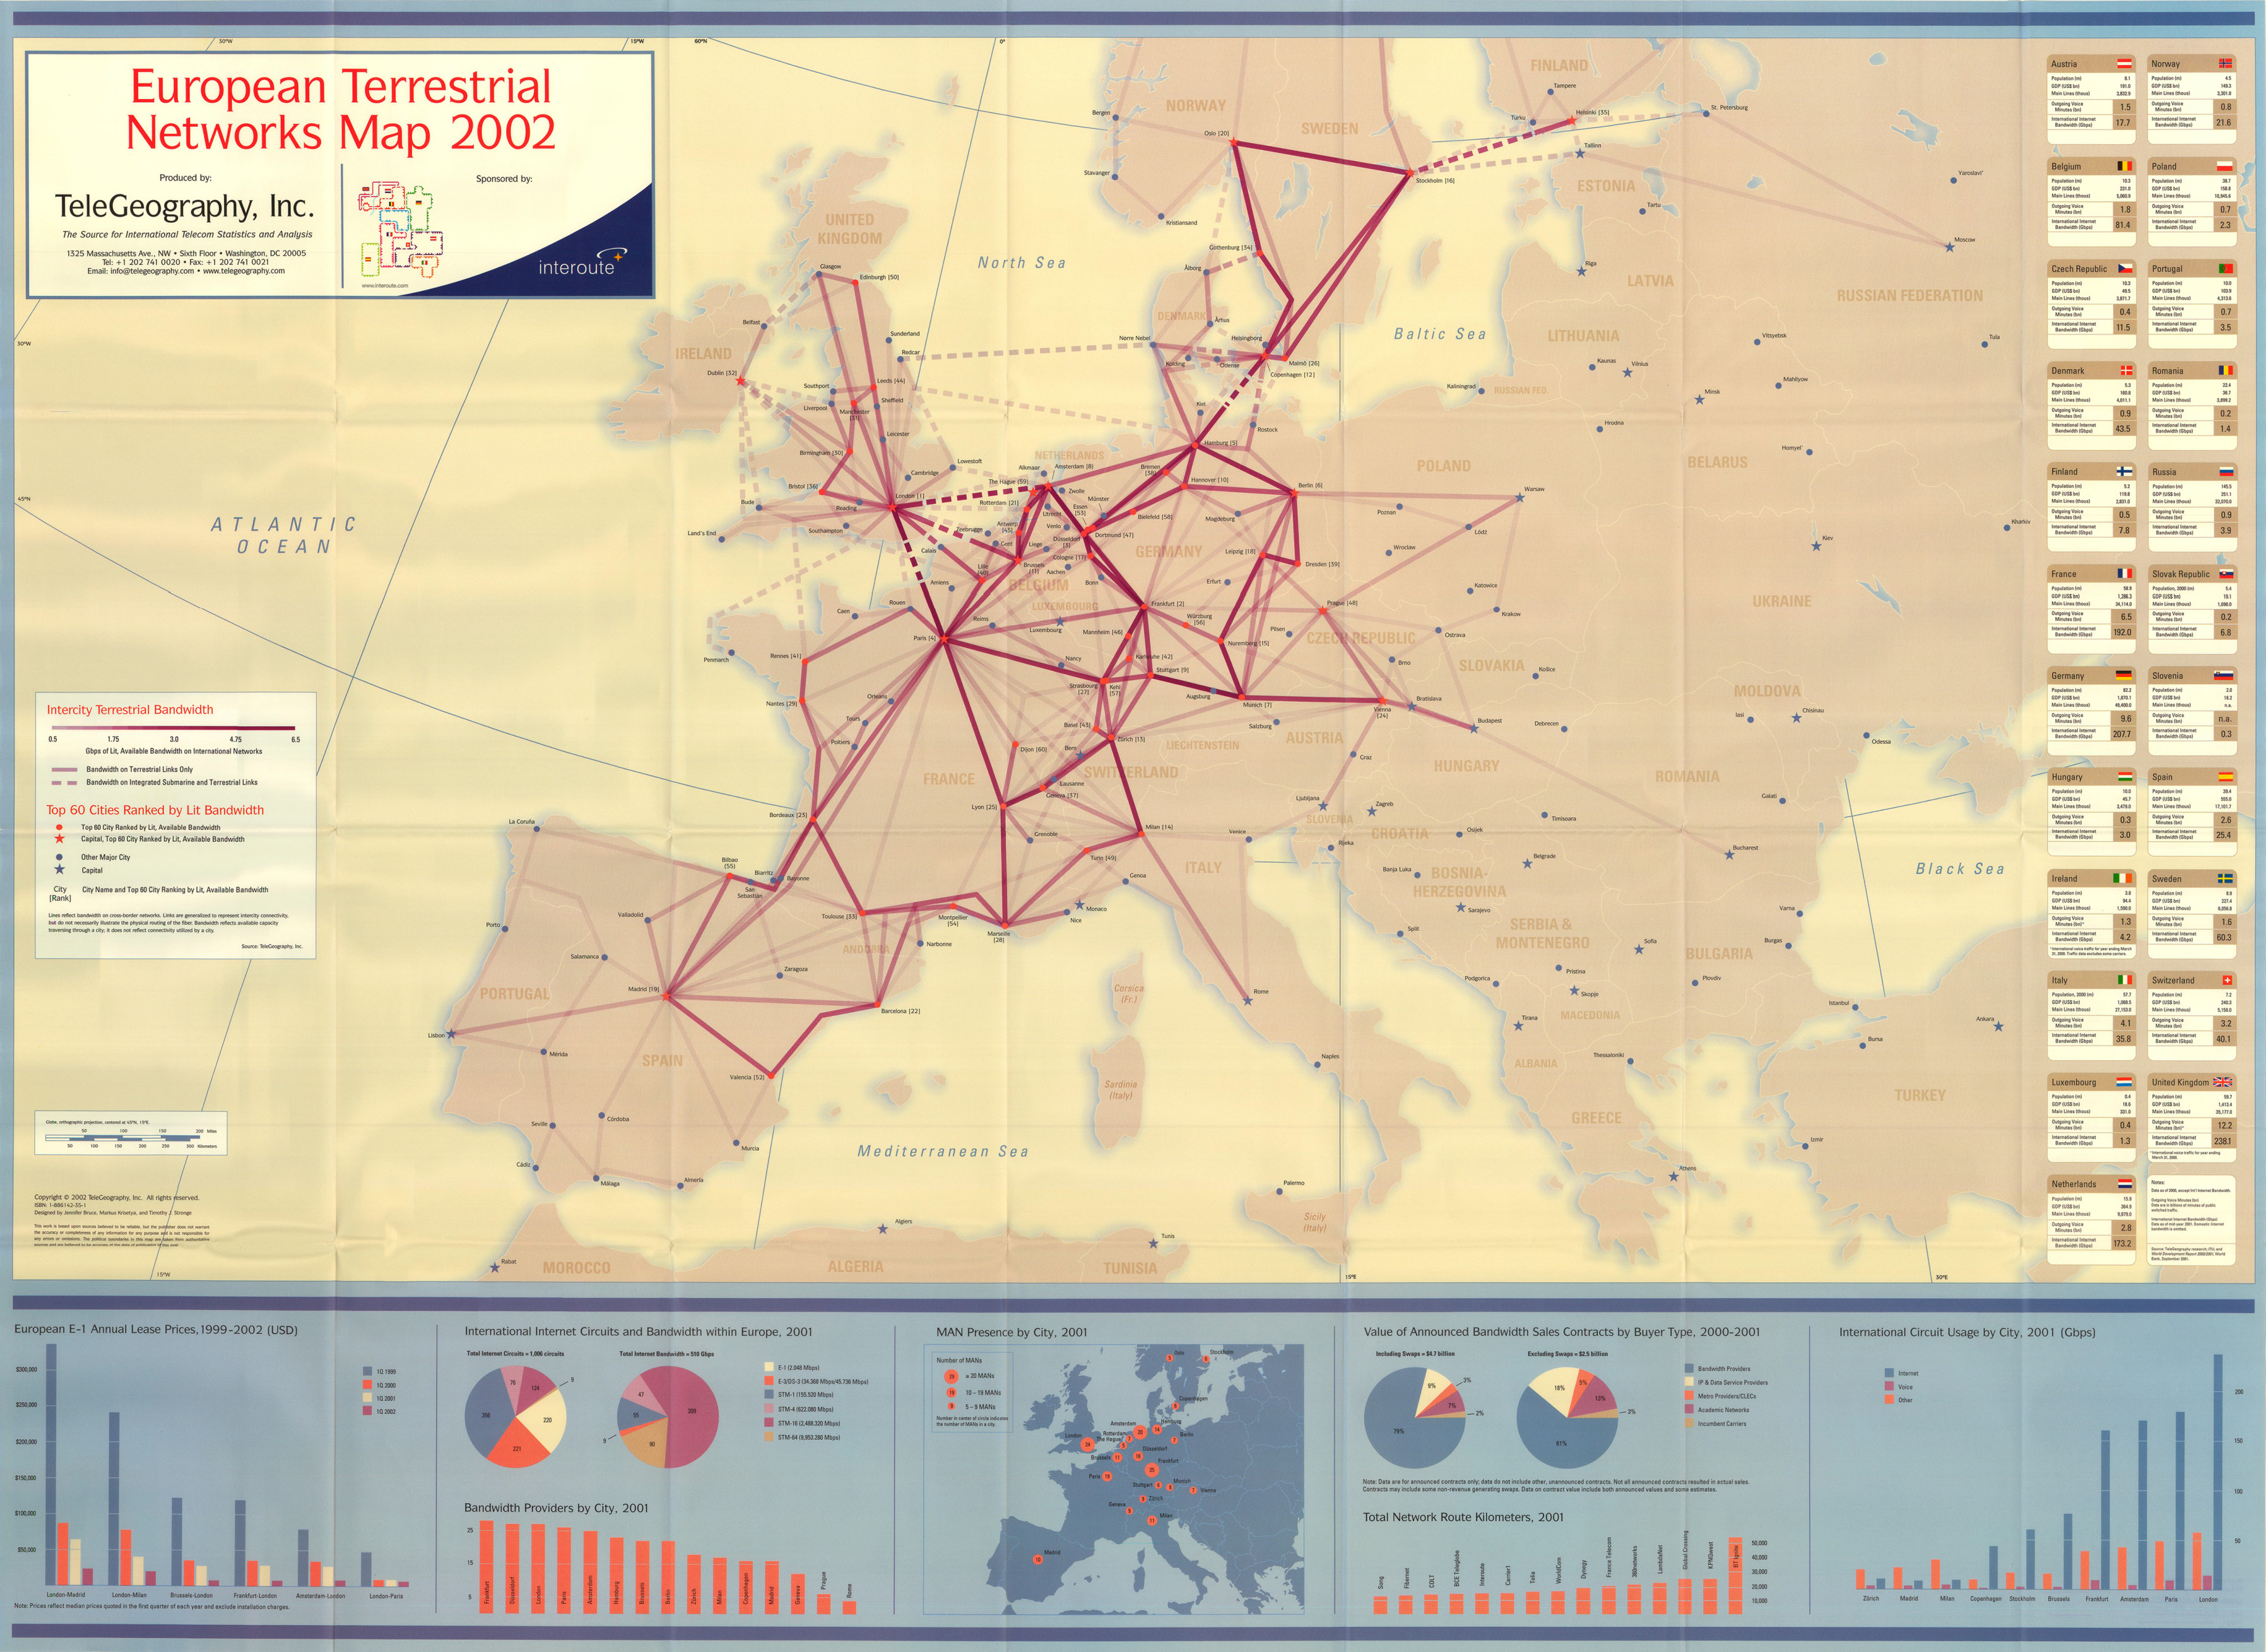
European Terrestrial Networks Map 2002
Summary
World map shows intercity terrestrial bandwidth in Europe.
Legend indicates:
- Intercity Terrestrial bandwidth (in Gbps of lit, available bandwidth on international networks):
- 0.5
- 1.75
- 3.0
- 4.75
- 6.5
- Bandwidth on Terrestrial Links only
- Bandwidth on Integrated Submarine and Terrestrial Links
- Top 60 Cities ranked by Lit Bandwidth
- Red Dot: top 60 city ranked by Lit, available bandwidth
- Red Star: capital, top 60 city ranked by Lit, available bandwidth
- Blue dot: other major city
- Blue Star: capital
-
-
- city name and top 60 city ranked by lit available bandwidth
-
At the bottom the following data is included:
- Statistics and explanations on:
- European E-1 Annual Lease prices, 1999-2002 (USD) for London-Madrid, London-Milan, Brussels-London, Frankfurt-London, Amsterdam-Londom, and London-Paris
- International Internet Circuits and Bandwidth within Europe, 2001
- MAN Presence by City, 2001
- Value of Announced Bandwidth Sales Contracts by Buyer Type, 2000-2001
- Total Network Route kilometers, 2001
- International Circuit Usage by City, 2001 (Gbps): Internet, voice, and other.
Finally, country panels are included (Austria, Norway, Belgium, Poland, Czech Republic, Portugal, Denmark, Romania, Finland, Russia, France, Slovak Republic, Germany, Slovenia, Hungary, Spain) with information on:
- Population
- GDP (billion US Dollars)
- Main lines (thousand)
- Outgoing voice (billion minutes)
- International Internet Bandwidth (Gbps).
Source
Produced by TeleGeography Research.
Sponsored by Interoute
ISBN: 1-886142-35-1
Designed by Jennifer Bruce, Markus Krisetya, and Timothy J. Stronge.
“This work is based upon sources believed to be reliable, but the publisher does not warrant the accuracy or completeness of any information for any purpose and is not responsible for any errors or omissions. The political boundaries in this map are taken from authoritative sources and are believed to be accurate at the date of publication of this map.”
Miller Projection.
This map is in the collection of copyrighted maps of the Geosciences and Map Library, Fine Hall (B level), Princeton University.
Call number: LF G5701.P9.2002.T4
Copyright
© 2002 TeleGeography, Inc. All rights reserved.
Series
This map is one in a series:
- Image:MG©European Terrestrial Networks Map, 2002.djvu
- Image:MG©Submarine Cable Map, 2007.djvu
- Image:MG©Global Communications Traffic Map, 2005.djvu
- Image:MG©Global Internet Map, 2006.djvu