
Caption
Employment in Industry and Services 1950 and 1991
Summary
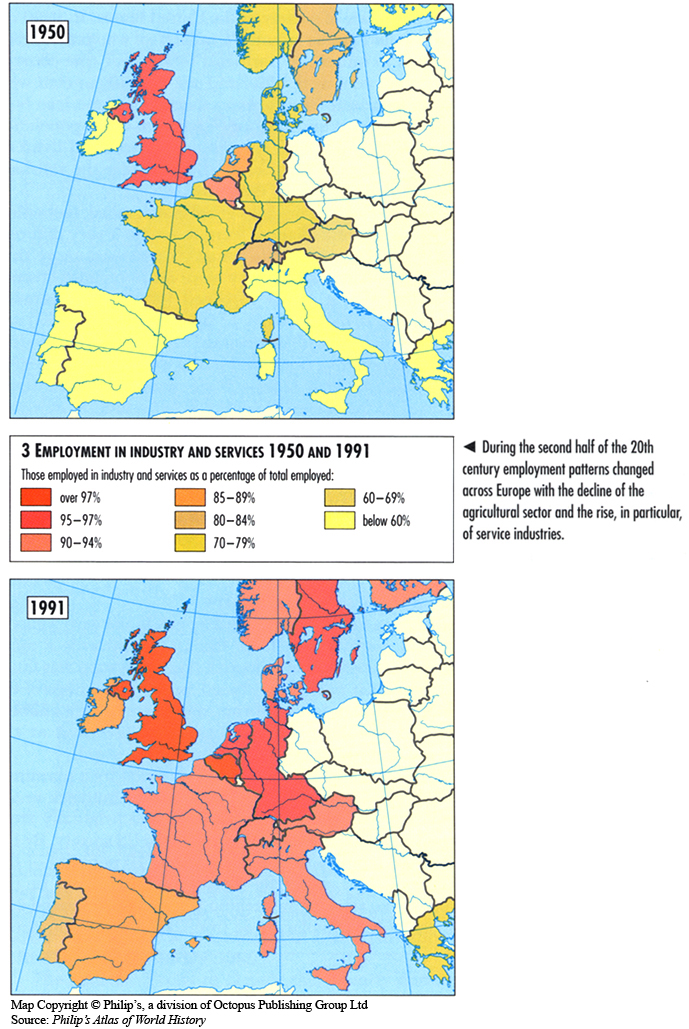
These two maps depict the differences in the levels of employment in industry and services in Europe between 1950 and 1991. Countries are color-keyed according to their shares of employees in industry and services. A brief explanation provides additional information on the topic.
Legend indicates:
- Those employed in industry and services as a percentage of total employed:
- Over 97%
- 95-97%
- 90-94%
- 85-89%
- 80-84%
- 70-79%
- 60-69%
- 200-500%
- below 60%
Source
Oxford Atlas of World History, Oxford University Press, 2002. General Editor Patrick K. O’Brien.
Chapter 5. The Twentieth Century: “Western Europe since 1945,” page 239.
Copyright
Map copyright © Philip’s, a division of Octopus Publishing Ltd. Source: Philip’s Atlas of World History.
Used under license from Octopus Publishing Group.
Series
This map is one in a series:
This map is one in a series of maps selected from the Oxford Atlas of World History.
A gallery using flyover images like this