
Caption
Distribution of Wealth 1995
Summary
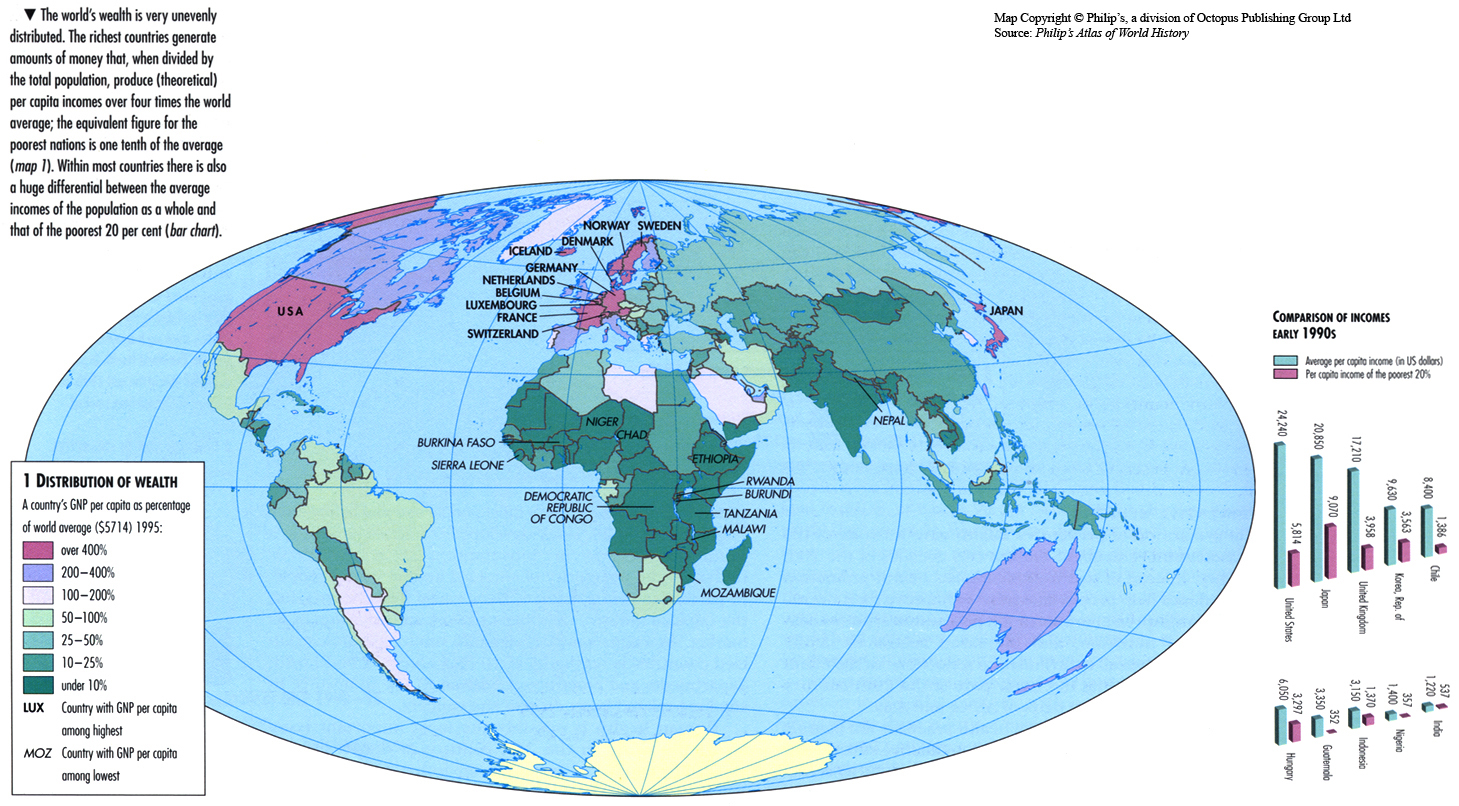
This map shows countries color-keyed according to their GNP per capita as a percentage of the world’s average. Countries with the highest and lowest GNP per capita are also indicated. The differences between GNP levels are attributed to unequal growth, which explains the increasing disparities of wealth between poor and rich countries.
Legend indicates:
- A country’s GNP per capita as percentage of world average ($5714) 1995:
- over 400%
- 200-400%
- 100-200%
- 50-100%
- 25-50%
- 10-25%
- under 10%
- Country with GNP per capita among highest
- Country with GNP per capita among lowest
An explanation about global unequal distribution is provided, together with two bar charts on income disparities.
Source
Oxford Atlas of World History, Oxford University Press, 2002. General Editor Patrick K. O’Brien.
Chapter 5. The Twentieth Century: “Standards of Living since 1945,” page 278.
Copyright
Map copyright © Philip’s, a division of Octopus Publishing Ltd. Source: Philip’s Atlas of World History.
Used under license from Octopus Publishing Group.
Series
This map is one in a series:
This map is one in a series of maps selected from the Oxford Atlas of World History.
A gallery using flyover images like this