
Caption
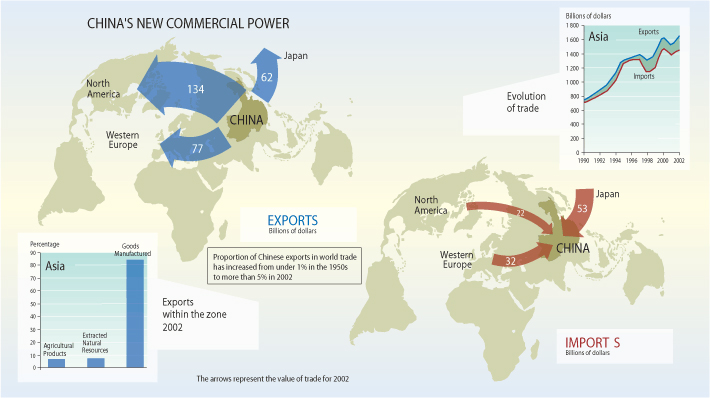
China’s New Commercial Power, 2002
Summary
These two world maps show China’s imports and exports in billions of dollars in 2002.
The bar graph under the exports map shows China’s biggest market (manufactured goods) in comparison to agriculture and natural resources in 2002. The line graph above the imports map shows Asia’s increasing trade surplus from 1990 to 2002.
Source
Cartographer: Philippe Rekacewicz
Primary Sources:
- Paul Kennedy, The Rise and Fall of the Great Powers: Economic Change and Military Conflict from 1500 to 2000, HarperCollins, 1989
- Paul Bairoch, Victoires et déboires, histoire économique et sociale du monde du XVIe siècle à nos jours, vol II, Gallimard “Folio Histoire”, Paris, 1997
- Angus Maddison, L’Economie mondiale: une perspective millénaire and Statistiques historiques (published in 2001 and 2003 respectively), Etudes du centre de développement, OECD, Paris.
Copyright
© Le Monde Diplomatique