
Caption
Biological Oxygen Demand, 1976 to 2000
Summary
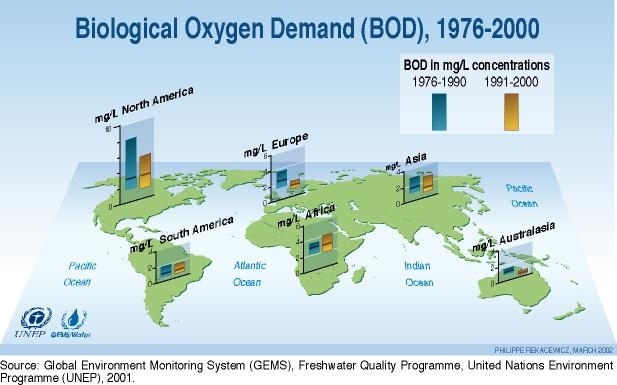
This map shows regional levels of organic pollution of freshwater in 1976-1990 and in 1991-2000, using biological oxygen demand as an indicator of organic pollution.
Source
United Nations Environment Programme / GRID-Arendal[1]
Cartographer/Designer: Philippe Rekacewicz, UNEP/GRID-Arendal
Primary Source:
- Global Environment Monitoring System (GEMS)
- Freshwater Quality Programme, UNEP, 2001.
Copyright
© 2006 UNEP / GRID-Arendal
Licensing
Used with permission.
For use constraints, see [2].
Series
This map is one in a series For a listing with flyovers, see Series:UNEP / GRID-Arendal.